WTO Trade Profiles 2012 - World Trade Organization
WTO Trade Profiles 2012 - World Trade Organization
WTO Trade Profiles 2012 - World Trade Organization

Create successful ePaper yourself
Turn your PDF publications into a flip-book with our unique Google optimized e-Paper software.
Bosnia and Herzegovina<br />
Bosnia and Herzegovina<br />
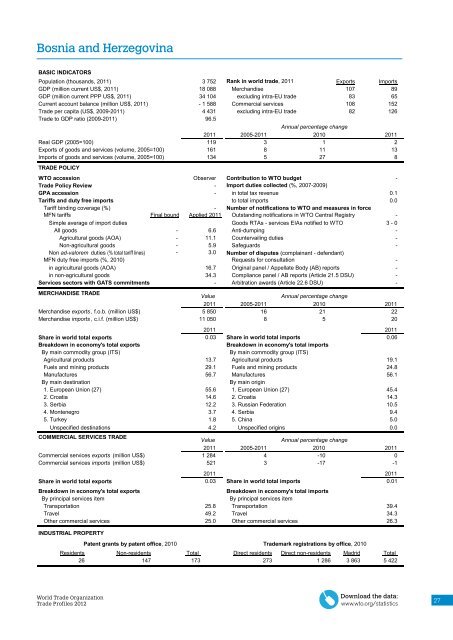
BASIC INDICATORS<br />
Population (thousands, 2011) 3 752 Rank in world trade, 2011 Exports Imports<br />
GDP (million current US$, 2011) 18 088 Merchandise 107 89<br />
GDP (million current PPP US$, 2011) 34 104 excluding intra-EU trade 83 65<br />
Current account balance (million US$, 2011) - 1 588 Commercial services 108 152<br />
<strong>Trade</strong> per capita (US$, 2009-2011) 4 431 excluding intra-EU trade 82 126<br />
<strong>Trade</strong> to GDP ratio (2009-2011) 96.5<br />
2011 2005-2011<br />
Annual percentage change<br />
2010 2011<br />
Real GDP (2005=100) 119<br />
3 1 2<br />
Exports of goods and services (volume, 2005=100) 161<br />
8 11 13<br />
Imports of goods and services (volume, 2005=100)<br />
TRADE POLICY<br />
134<br />
5 27 8<br />
<strong>WTO</strong> accession Observer Contribution to <strong>WTO</strong> budget -<br />
<strong>Trade</strong> Policy Review - Import duties collected (%, 2007-2009)<br />
GPA accession - in total tax revenue 0.1<br />
Tariffs and duty free imports to total imports 0.0<br />
Tariff binding coverage (%) - Number of notifications to <strong>WTO</strong> and measures in force<br />
MFN tariffs Final bound Applied 2011 Outstanding notifications in <strong>WTO</strong> Central Registry<br />
-<br />
Simple average of import duties Goods RTAs - services EIAs notified to <strong>WTO</strong> 3 - 0<br />
All goods - 6.6 Anti-dumping -<br />
Agricultural goods (AOA) - 11.1 Countervailing duties -<br />
Non-agricultural goods - 5.9 Safeguards -<br />
Non ad-valorem duties (% total tariff lines) - 3.0 Number of disputes (complainant - defendant)<br />
MFN duty free imports (%, 2010)<br />
Requests for consultation<br />
-<br />
in agricultural goods (AOA)<br />
16.7 Original panel / Appellate Body (AB) reports -<br />
in non-agricultural goods<br />
34.3 Compliance panel / AB reports (Article 21.5 DSU) -<br />
Services sectors with GATS commitments - Arbitration awards (Article 22.6 DSU) -<br />
MERCHANDISE TRADE<br />
Value<br />
Annual percentage change<br />
2011 2005-2011 2010 2011<br />
Merchandise exports , f.o.b. (million US$) 5 850<br />
16 21 22<br />
Merchandise imports , c.i.f. (million US$) 11 050<br />
8 5 20<br />
2011<br />
2011<br />
Share in world total exports 0.03 Share in world total imports<br />
0.06<br />
Breakdown in economy's total exports<br />
Breakdown in economy's total imports<br />
By main commodity group (ITS) By main commodity group (ITS)<br />
Agricultural products 13.7 Agricultural products 19.1<br />
Fuels and mining products 29.1 Fuels and mining products 24.8<br />
Manufactures 56.7 Manufactures 56.1<br />
By main destination By main origin<br />
1. European Union (27) 55.6 1. European Union (27) 45.4<br />
2. Croatia 14.6 2. Croatia 14.3<br />
3. Serbia 12.2 3. Russian Federation 10.5<br />
4. Montenegro 3.7 4. Serbia 9.4<br />
5. Turkey 1.8 5. China 5.0<br />
Unspecified destinations 4.2 Unspecified origins 0.0<br />
COMMERCIAL SERVICES TRADE<br />
Value<br />
Annual percentage change<br />
2011 2005-2011 2010<br />
2011<br />
Commercial services exports (million US$) 1 284<br />
4 -10 0<br />
Commercial services imports (million US$) 521<br />
3 -17 -1<br />
2011<br />
2011<br />
Share in world total exports 0.03 Share in world total imports<br />
0.01<br />
Breakdown in economy's total exports<br />
Breakdown in economy's total imports<br />
By principal services item<br />
By principal services item<br />
Transportation 25.8 Transportation<br />
39.4<br />
Travel 49.2 Travel<br />
34.3<br />
Other commercial services 25.0 Other commercial services<br />
26.3<br />
INDUSTRIAL PROPERTY<br />
Patent grants by patent office, 2010 <strong>Trade</strong>mark registrations by office, 2010<br />
Residents Non-residents Total<br />
Direct residents Direct non-residents Madrid Total<br />
26 147 173 273 1 286 3 863 5 422<br />
<strong>World</strong> <strong>Trade</strong> <strong>Organization</strong><br />
<strong>Trade</strong> <strong>Profiles</strong> <strong>2012</strong><br />
September <strong>2012</strong><br />
Download the data:<br />
www.wto.org/statistics<br />
27