WTO Trade Profiles 2012 - World Trade Organization
WTO Trade Profiles 2012 - World Trade Organization
WTO Trade Profiles 2012 - World Trade Organization

You also want an ePaper? Increase the reach of your titles
YUMPU automatically turns print PDFs into web optimized ePapers that Google loves.
34<br />
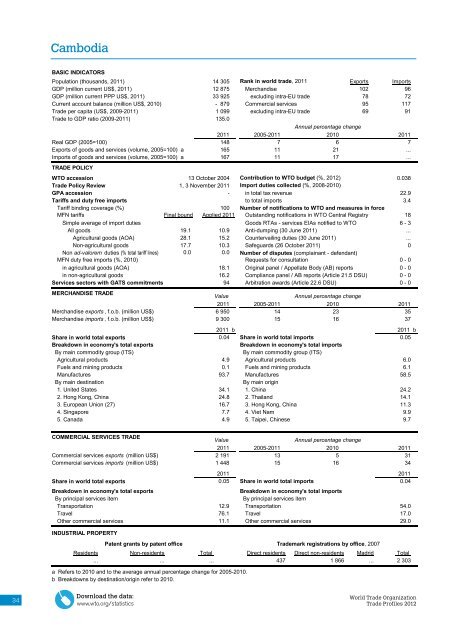
Cambodia<br />
BASIC INDICATORS<br />
Population (thousands, 2011) 14 305 Rank in world trade, 2011 Exports Imports<br />
GDP (million current US$, 2011) 12 875 Merchandise 102 96<br />
GDP (million current PPP US$, 2011) 33 925 excluding intra-EU trade 78 72<br />
Current account balance (million US$, 2010) - 879 Commercial services 95 117<br />
<strong>Trade</strong> per capita (US$, 2009-2011) 1 099 excluding intra-EU trade 69 91<br />
<strong>Trade</strong> to GDP ratio (2009-2011) 135.0<br />
2011 2005-2011<br />
Annual percentage change<br />
2010 2011<br />
Real GDP (2005=100) 148<br />
7 6 7<br />
Exports of goods and services (volume, 2005=100) a 165<br />
11 21 ...<br />
Imports of goods and services (volume, 2005=100) a<br />
TRADE POLICY<br />
167<br />
11 17 ...<br />
<strong>WTO</strong> accession 13 October 2004 Contribution to <strong>WTO</strong> budget (%, <strong>2012</strong>) 0.038<br />
<strong>Trade</strong> Policy Review 1, 3 November 2011 Import duties collected (%, 2008-2010)<br />
GPA accession - in total tax revenue 22.9<br />
Tariffs and duty free imports to total imports 3.4<br />
Tariff binding coverage (%) 100 Number of notifications to <strong>WTO</strong> and measures in force<br />
MFN tariffs Final bound Applied 2011 Outstanding notifications in <strong>WTO</strong> Central Registry<br />
18<br />
Simple average of import duties Goods RTAs - services EIAs notified to <strong>WTO</strong> 6 - 3<br />
All goods 19.1 10.9 Anti-dumping (30 June 2011) ...<br />
Agricultural goods (AOA) 28.1 15.2 Countervailing duties (30 June 2011) ...<br />
Non-agricultural goods 17.7 10.3 Safeguards (26 October 2011) 0<br />
Non ad-valorem duties (% total tariff lines) 0.0 0.0 Number of disputes (complainant - defendant)<br />
MFN duty free imports (%, 2010)<br />
Requests for consultation<br />
0 - 0<br />
in agricultural goods (AOA)<br />
18.1 Original panel / Appellate Body (AB) reports 0 - 0<br />
in non-agricultural goods<br />
16.2 Compliance panel / AB reports (Article 21.5 DSU) 0 - 0<br />
Services sectors with GATS commitments 94 Arbitration awards (Article 22.6 DSU) 0 - 0<br />
MERCHANDISE TRADE<br />
Value<br />
Annual percentage change<br />
2011 2005-2011 2010 2011<br />
Merchandise exports , f.o.b. (million US$) 6 950<br />
14 23 35<br />
Merchandise imports , f.o.b. (million US$) 9 300<br />
15 16 37<br />
2011 b<br />
2011 b<br />
Share in world total exports 0.04 Share in world total imports<br />
0.05<br />
Breakdown in economy's total exports<br />
Breakdown in economy's total imports<br />
By main commodity group (ITS) By main commodity group (ITS)<br />
Agricultural products 4.9 Agricultural products 6.0<br />
Fuels and mining products 0.1 Fuels and mining products 6.1<br />
Manufactures 93.7 Manufactures 58.5<br />
By main destination By main origin<br />
1. United States 34.1 1. China 24.2<br />
2. Hong Kong, China 24.8 2. Thailand 14.1<br />
3. European Union (27) 16.7 3. Hong Kong, China 11.3<br />
4. Singapore 7.7 4. Viet Nam 9.9<br />
5. Canada 4.9 5. Taipei, Chinese 9.7<br />
COMMERCIAL SERVICES TRADE<br />
Value<br />
Annual percentage change<br />
2011 2005-2011 2010<br />
2011<br />
Commercial services exports (million US$) 2 191<br />
13 5 31<br />
Commercial services imports (million US$) 1 448<br />
15 16 34<br />
2011<br />
2011<br />
Share in world total exports 0.05 Share in world total imports<br />
0.04<br />
Breakdown in economy's total exports<br />
Breakdown in economy's total imports<br />
By principal services item<br />
By principal services item<br />
Transportation 12.9 Transportation<br />
54.0<br />
Travel 76.1 Travel<br />
17.0<br />
Other commercial services 11.1 Other commercial services<br />
29.0<br />
INDUSTRIAL PROPERTY<br />
Patent grants by patent office <strong>Trade</strong>mark registrations by office, 2007<br />
Residents Non-residents Total<br />
Direct residents Direct non-residents Madrid Total<br />
... ... ... 437 1 866 ... 2 303<br />
Download the data:<br />
www.wto.org/statistics<br />
Cambodia<br />
a Refers to 2010 and to the average annual percentage change for 2005-2010.<br />
b Breakdowns by destination/origin refer to 2010.<br />
September <strong>2012</strong><br />
<strong>World</strong> <strong>Trade</strong> <strong>Organization</strong><br />
<strong>Trade</strong> <strong>Profiles</strong> <strong>2012</strong>