WTO Trade Profiles 2012 - World Trade Organization
WTO Trade Profiles 2012 - World Trade Organization
WTO Trade Profiles 2012 - World Trade Organization

You also want an ePaper? Increase the reach of your titles
YUMPU automatically turns print PDFs into web optimized ePapers that Google loves.
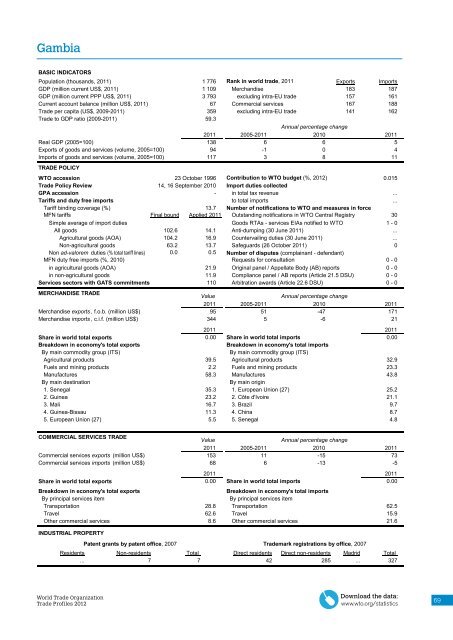
Gambia<br />
BASIC INDICATORS<br />
Population (thousands, 2011) 1 776 Rank in world trade, 2011 Exports Imports<br />
GDP (million current US$, 2011) 1 109 Merchandise 183 187<br />
GDP (million current PPP US$, 2011) 3 793 excluding intra-EU trade 157 161<br />
Current account balance (million US$, 2011) 67 Commercial services 167 188<br />
<strong>Trade</strong> per capita (US$, 2009-2011) 359 excluding intra-EU trade 141 162<br />
<strong>Trade</strong> to GDP ratio (2009-2011) 59.3<br />
2011 2005-2011<br />
Annual percentage change<br />
2010 2011<br />
Real GDP (2005=100) 138<br />
6 6 5<br />
Exports of goods and services (volume, 2005=100) 94<br />
-1 0 4<br />
Imports of goods and services (volume, 2005=100)<br />
TRADE POLICY<br />
117<br />
3 8 11<br />
<strong>WTO</strong> accession 23 October 1996 Contribution to <strong>WTO</strong> budget (%, <strong>2012</strong>) 0.015<br />
<strong>Trade</strong> Policy Review 14, 16 September 2010 Import duties collected<br />
GPA accession - in total tax revenue ...<br />
Tariffs and duty free imports to total imports ...<br />
Tariff binding coverage (%) 13.7 Number of notifications to <strong>WTO</strong> and measures in force<br />
MFN tariffs Final bound Applied 2011 Outstanding notifications in <strong>WTO</strong> Central Registry<br />
30<br />
Simple average of import duties Goods RTAs - services EIAs notified to <strong>WTO</strong> 1 - 0<br />
All goods 102.6 14.1 Anti-dumping (30 June 2011) ...<br />
Agricultural goods (AOA) 104.2 16.9 Countervailing duties (30 June 2011) ...<br />
Non-agricultural goods 63.2 13.7 Safeguards (26 October 2011) 0<br />
Non ad-valorem duties (% total tariff lines) 0.0 0.5 Number of disputes (complainant - defendant)<br />
MFN duty free imports (%, 2010)<br />
Requests for consultation<br />
0 - 0<br />
in agricultural goods (AOA)<br />
21.9 Original panel / Appellate Body (AB) reports 0 - 0<br />
in non-agricultural goods<br />
11.9 Compliance panel / AB reports (Article 21.5 DSU) 0 - 0<br />
Services sectors with GATS commitments 110 Arbitration awards (Article 22.6 DSU) 0 - 0<br />
MERCHANDISE TRADE<br />
Value<br />
Annual percentage change<br />
2011 2005-2011 2010 2011<br />
Merchandise exports , f.o.b. (million US$) 95<br />
51 -47 171<br />
Merchandise imports , c.i.f. (million US$) 344<br />
5 -6 21<br />
2011<br />
2011<br />
Share in world total exports 0.00 Share in world total imports<br />
0.00<br />
Breakdown in economy's total exports<br />
Breakdown in economy's total imports<br />
By main commodity group (ITS) By main commodity group (ITS)<br />
Agricultural products 39.5 Agricultural products 32.9<br />
Fuels and mining products 2.2 Fuels and mining products 23.3<br />
Manufactures 58.3 Manufactures 43.8<br />
By main destination By main origin<br />
1. Senegal 35.3 1. European Union (27) 25.2<br />
2. Guinea 23.2 2. Côte d'Ivoire 21.1<br />
3. Mali 16.7 3. Brazil 9.7<br />
4. Guinea-Bissau 11.3 4. China 8.7<br />
5. European Union (27) 5.5 5. Senegal 4.8<br />
COMMERCIAL SERVICES TRADE<br />
Value<br />
Annual percentage change<br />
2011 2005-2011 2010<br />
2011<br />
Commercial services exports (million US$) 153<br />
11 -15 73<br />
Commercial services imports (million US$) 68<br />
6 -13 -5<br />
2011<br />
2011<br />
Share in world total exports 0.00 Share in world total imports<br />
0.00<br />
Breakdown in economy's total exports<br />
Breakdown in economy's total imports<br />
By principal services item<br />
By principal services item<br />
Transportation 28.8 Transportation<br />
62.5<br />
Travel 62.6 Travel<br />
15.9<br />
Other commercial services 8.6 Other commercial services<br />
21.6<br />
INDUSTRIAL PROPERTY<br />
Patent grants by patent office, 2007 <strong>Trade</strong>mark registrations by office, 2007<br />
Residents Non-residents Total<br />
Direct residents Direct non-residents Madrid Total<br />
... 7 7 42 285 ... 327<br />
<strong>World</strong> <strong>Trade</strong> <strong>Organization</strong><br />
<strong>Trade</strong> <strong>Profiles</strong> <strong>2012</strong><br />
Gambia<br />
September <strong>2012</strong><br />
Download the data:<br />
www.wto.org/statistics<br />
69