Geographical distribution of sulphur and nitrogen ... - EMEP
Geographical distribution of sulphur and nitrogen ... - EMEP
Geographical distribution of sulphur and nitrogen ... - EMEP

Create successful ePaper yourself
Turn your PDF publications into a flip-book with our unique Google optimized e-Paper software.
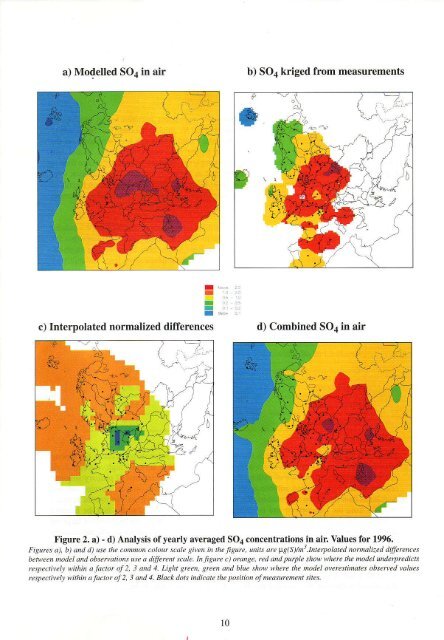
a) Modelled SOa in air b) SOa kriged lrom measurements<br />
c) Interpolated normalized differences d) Combined SOa in air<br />
-<br />
t<br />
-<br />
I<br />
I<br />
Figure 2, a) - d) Analysis <strong>of</strong>yearly averaged SO4 concentrations in air, Values for 1996,<br />
Fisur?s d), b) <strong>and</strong> d) use the cannan coh0 scale siwn in the lisuk. units are tr.g(S)/n'.Interyol!1t.d nornalized differences<br />
betue?n klo.lel <strong>and</strong> abser,-ations use a dituftnt scole. In jisurc c) otunge, rcd <strong>and</strong> puryLe show \,,'h.re the nodcl underprctlicts<br />
rcspectiwL- within a lacbr oJ 2, 3 <strong>and</strong> 1. Li\llt grcen, grcetl dna btue slnw flheft the nod?l orercstinates abserved wlues<br />
resNctirely vithin a factor oJ2, 3 <strong>and</strong> 4. Bklck dots inlicate the po\ition ol medsurement sites.<br />
t0