Geographical distribution of sulphur and nitrogen ... - EMEP
Geographical distribution of sulphur and nitrogen ... - EMEP
Geographical distribution of sulphur and nitrogen ... - EMEP

Create successful ePaper yourself
Turn your PDF publications into a flip-book with our unique Google optimized e-Paper software.
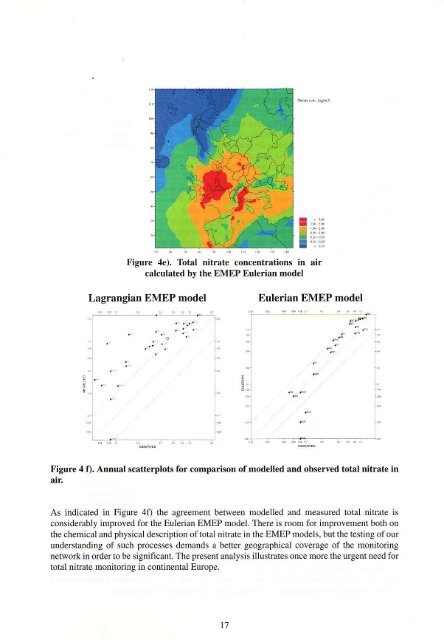
Figure 4e). Total nitrate concentrations in air<br />
calculated by the <strong>EMEP</strong> Eulerian model<br />
Lagrangian <strong>EMEP</strong> model Eulerian <strong>EMEP</strong> model<br />
Figure 4 f), Annual scatterplots for comparison <strong>of</strong> modelled <strong>and</strong> observed total nitrate in<br />
air.<br />
As indicated in Figure 4t) the agrcement between modelled <strong>and</strong> measured total nihate is<br />
considerably improved for the Eulerian <strong>EMEP</strong> model. There is room for improvement both on<br />
the chemical <strong>and</strong> physical description <strong>of</strong> total nitate in the <strong>EMEP</strong> models, but the testing <strong>of</strong> our<br />
underst<strong>and</strong>ing <strong>of</strong> such prccesses dem<strong>and</strong>s a better geographical coverage <strong>of</strong> the monitoring<br />
network in order to be significant. The prcsent analysis illustrates once morc the urgent need for<br />
total nitate monitodng in continental Ewope.<br />
t'7