Geographical distribution of sulphur and nitrogen ... - EMEP
Geographical distribution of sulphur and nitrogen ... - EMEP
Geographical distribution of sulphur and nitrogen ... - EMEP

Create successful ePaper yourself
Turn your PDF publications into a flip-book with our unique Google optimized e-Paper software.
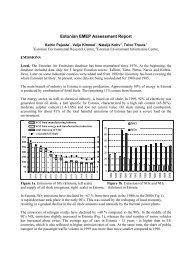
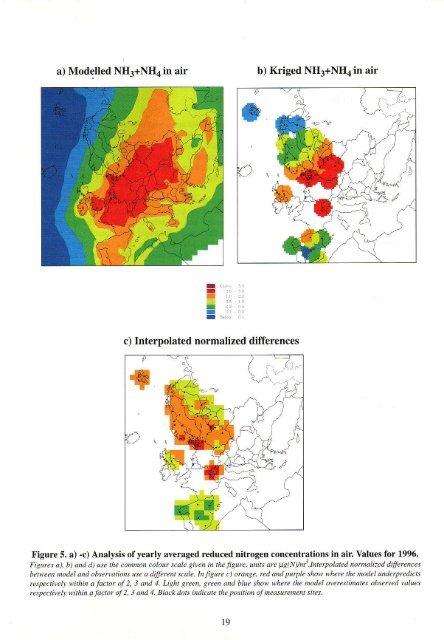
a) Modelled NH3+NHa in air b) Kriged NII3+NH4 in air<br />
I Id<br />
r<br />
-<br />
I<br />
c) Interpolated normalized differences<br />
Figure 5. a) -c) Analysis <strong>of</strong> yearly averaged reduced <strong>nitrogen</strong> concentrations in air. Values for 1996.<br />
Fiiutes a), b) dntt d) use the .onnon cot.)w scate B^ et n the f surc. unn ure latNvni'.tnterpolat.d normalized dilfercnces<br />
beh-een model atul obs.notio use a dillercnt scaL.. ttlfisurc c)oranse, red <strong>and</strong> puryle sho'| where the nodel underyrcdicts<br />
respediwb- tr ithin a factor <strong>of</strong> 2, 3 ond 1. Lisht gfte , Eft?n m.l blLE sho\i rihere the model overcstinates obsenetl values<br />
rcspectireb withitl a lactot <strong>of</strong>2,3 <strong>and</strong> 4. Block tlots in.licdte the pasitiatl oJ neasurement sites.<br />
19