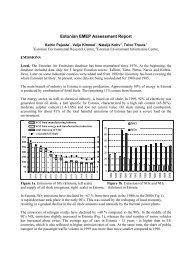
Geographical distribution of sulphur and nitrogen ... - EMEP
Geographical distribution of sulphur and nitrogen ... - EMEP
Geographical distribution of sulphur and nitrogen ... - EMEP

Create successful ePaper yourself
Turn your PDF publications into a flip-book with our unique Google optimized e-Paper software.
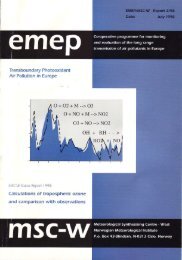
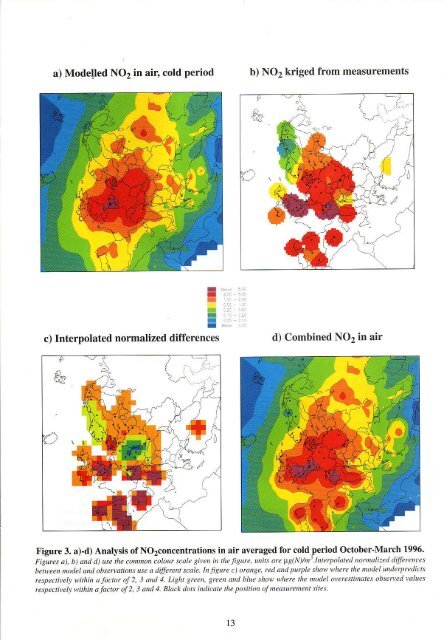
a) Modelled NO2 in air, cold Period<br />
c) Interpolated normalized differences<br />
I {,.. :.<br />
I<br />
:.. iir<br />
._ ,..<br />
I .::<br />
_i<br />
I : : : ] :<br />
I ::: __<br />
l - - .<br />
b) NO2 kriged from measurements<br />
d) Combined NO' in air<br />
Figure 3. a)-d) Analysis <strong>of</strong> No2concentrations in air averaged for cold period October-March 1996.<br />
Figures a), b)<strong>and</strong> d)use the comn'rn colour scale gfien intheJigurc, units arc pe(Nym'.tnteryohted nomalized differcnces<br />
betvreen noder Lnrt obsenations use 4.liffercnt scale. h fisurc c) onn:ae, rcd <strong>and</strong> putpLe shotr ||here the nodel underyte.titts<br />
rcspectivety within a J.tctor <strong>of</strong> 2, 3 <strong>and</strong> L Li|ht green, Breen <strong>and</strong> blue show tthere the no.lel overcstiMtes obserred Mlues<br />
respedireb \rithin o factot oJ 2, J <strong>and</strong> 4. Black dots indicate the position d neasurement sit.s<br />
13