Geographical distribution of sulphur and nitrogen ... - EMEP
Geographical distribution of sulphur and nitrogen ... - EMEP
Geographical distribution of sulphur and nitrogen ... - EMEP

Create successful ePaper yourself
Turn your PDF publications into a flip-book with our unique Google optimized e-Paper software.
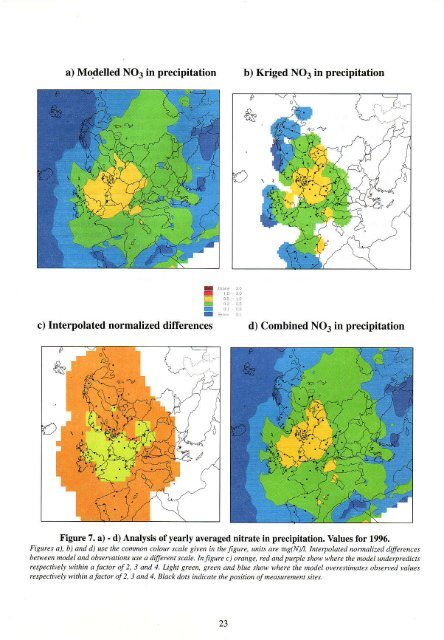
a) Modelled NOj in precipitation b) Kriged NO3 in precipitation<br />
I<br />
T<br />
I<br />
c) Interpolated normalized differences d) Combined NO3 in precipitation<br />
,' i .1, t,,<br />
Figure 7. a) - d) Analysis <strong>of</strong> yearly averaged nitrate in precipitation. Values for 1996.<br />
Fisures a), b) <strong>and</strong> d) use the comnrn colow scak s,l,en in the fisure, units arc ms(N),4. Interyol^1ted nornalizerl differcnces<br />
between nodel anlt obsenations uxe a difercnt scak. ln figurc c) orange, rcd <strong>and</strong> puryle show wherc the model underpredicts<br />
respectirely within a factor oJ 2, 3 Md 4. Light Brcen, grcen <strong>and</strong> blue show irhere the model o|erestinates obsened lalues<br />
rcspectivlt within a factor oJ 2, 3 <strong>and</strong> 4. Black dots indiate the position <strong>of</strong> measurement sites.<br />
23