Geographical distribution of sulphur and nitrogen ... - EMEP
Geographical distribution of sulphur and nitrogen ... - EMEP
Geographical distribution of sulphur and nitrogen ... - EMEP

Create successful ePaper yourself
Turn your PDF publications into a flip-book with our unique Google optimized e-Paper software.
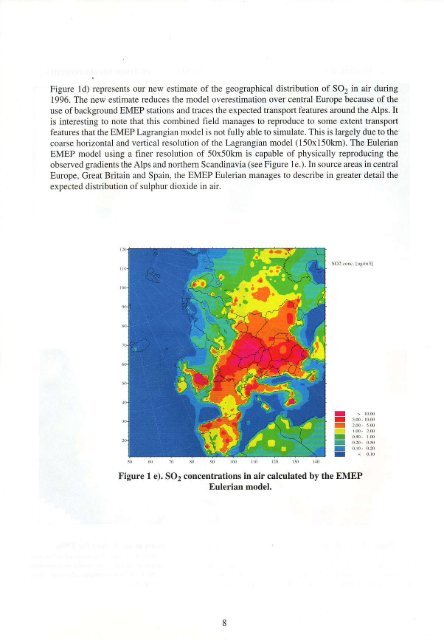
Figure ld) represents our new estimate <strong>of</strong> the geographical <strong>distribution</strong> <strong>of</strong> SO2 in at during<br />
1996. The new estimate reduces the model overcstimation over central Europe because <strong>of</strong> the<br />
use <strong>of</strong>backgrould <strong>EMEP</strong> stations <strong>and</strong> traces the expected transport features arcund the Alps. It<br />
is interestirg to note that this combined field manages to reproduce to some extent transport<br />
features ihat the <strong>EMEP</strong> Lagrangian model is not fully able to simulate. This is largely due to the<br />
coarse horizontal <strong>and</strong> vertical resolution <strong>of</strong> the Lagrangian model (150x150km). The Euledan<br />
<strong>EMEP</strong> model using a finel resolution ol 50x50km is capable <strong>of</strong> physically reproducing the<br />
observed gradients the Alps <strong>and</strong> nonhern Sc<strong>and</strong>inavia (see Figure 1e.). In source areas in central<br />
Eurcpe, Great Britain <strong>and</strong> Spain, the <strong>EMEP</strong> Eulerian manages ro descdbe in greater detail the<br />
e\Decled diirribution ol .ulDhur dioxide in air.<br />
Figure I e). SO2 concentrations in air calculated by the <strong>EMEP</strong><br />
Eulerian model.<br />
I<br />
I<br />
I<br />
r<br />
I<br />
r<br />
I