Titel-Trader 2.2009.indd - Agritechnica Trader
Titel-Trader 2.2009.indd - Agritechnica Trader
Titel-Trader 2.2009.indd - Agritechnica Trader

Create successful ePaper yourself
Turn your PDF publications into a flip-book with our unique Google optimized e-Paper software.
COMPANIES AND MARKETS<br />
Continues from page 23<br />
lowing good harvests, above<br />
all global combine production<br />
grew – by 9,000 units to some<br />
47,000 combines in 2008. (Table<br />
4 “Global production estimates”).<br />
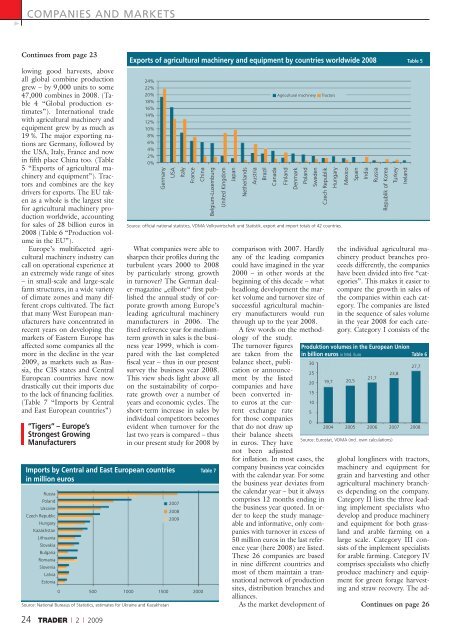
International trade<br />
with agricultural machinery and<br />
equipment grew by as much as<br />
19 %. The major exporting nations<br />
are Germany, followed by<br />
the USA, Italy, France and now<br />
in fi fth place China too. (Table<br />
5 “Exports of agricultural machinery<br />
and equipment”). Tractors<br />
and combines are the key<br />
drivers for exports. The EU taken<br />
as a whole is the largest site<br />
for agricultural machinery production<br />
worldwide, accounting<br />
for sales of 28 billion euros in<br />
2008 (Table 6 “Production volume<br />
in the EU”).<br />
Europe’s multifaceted agricultural<br />
machinery industry can<br />
call on operational experience at<br />
an extremely wide range of sites<br />
– in small-scale and large-scale<br />
farm structures, in a wide variety<br />
of climate zones and many different<br />
crops cultivated. The fact<br />
that many West European manufacturers<br />
have concentrated in<br />
recent years on developing the<br />
markets of Eastern Europe has<br />
affected some companies all the<br />
more in the decline in the year<br />
2009, as markets such as Russia,<br />
the CIS states and Central<br />
European countries have now<br />
drastically cut their imports due<br />
to the lack of fi nancing facilities.<br />
(Table 7 “Imports by Central<br />
and East European countries”)<br />
“Tigers” – Europe’s<br />
Strongest Growing<br />
Manufacturers<br />
24 TRADER | 2 | 2009<br />
Exports of agricultural machinery and equipment by countries worldwide 2008 Table 5<br />
24%<br />
22%<br />
20%<br />
18%<br />
16%<br />
14%<br />
12%<br />
10%<br />
8%<br />
6%<br />
4%<br />
2%<br />
0%<br />
Germany<br />
USA<br />
Italy<br />
France<br />
China<br />
Belgium-Luxemburg<br />
What companies were able to<br />
sharpen their profi les during the<br />
turbulent years 2000 to 2008<br />
by particularly strong growth<br />
in turnover? The German dealer-magazine<br />
„eilbote“ fi rst published<br />
the annual study of corporate<br />
growth among Europe’s<br />
leading agricultural machinery<br />
manufacturers in 2006. The<br />
fi xed reference year for mediumterm<br />
growth in sales is the business<br />
year 1999, which is compared<br />
with the last completed<br />
fi scal year – thus in our present<br />
survey the business year 2008.<br />
This view sheds light above all<br />
on the sustainability of corporate<br />
growth over a number of<br />
years and economic cycles. The<br />
short-term increase in sales by<br />
individual competitors becomes<br />
evident when turnover for the<br />
last two years is compared – thus<br />
in our present study for 2008 by<br />
Imports by Central and East European countries Table 7<br />
in million euros<br />
Russia<br />
Poland<br />
Ukraine<br />
Czech Republic<br />
Hungary<br />
Kazakhstan<br />
Lithuania<br />
Slovakia<br />
Bulgaria<br />
Romania<br />
Slovenia<br />
Latvia<br />
Estonia<br />
Source: National Bureaus of Statistics, estimates for Ukraine and Kazakhstan<br />
United Kingdom<br />
Japan<br />
Netherlands<br />
Austria<br />
Brazil<br />
Canada<br />
Agricultural machinery Tractors<br />
Finland<br />
Denmark<br />
Poland<br />
Sweden<br />
Czech Republik<br />
Hungary<br />
Source: offi cial national statistics, VDMA Volkswirtschaft und Statistik, export and import totals of 42 countries.<br />
2007<br />
2008<br />
2009<br />
0 500 1000 1500 2000<br />
comparison with 2007. Hardly<br />
any of the leading companies<br />
could have imagined in the year<br />
2000 – in other words at the<br />
beginning of this decade – what<br />
headlong development the market<br />
volume and turnover size of<br />
successful agricultural machinery<br />
manufacturers would run<br />
through up to the year 2008.<br />
A few words on the method-<br />
ology of the study.<br />
The turnover fi gures<br />
are taken from the<br />
balance sheet, publication<br />
or announcement<br />
by the listed<br />
companies and have<br />
been converted into<br />
euros at the current<br />
exchange rate<br />
for those companies<br />
that do not draw up<br />
their balance sheets<br />
in euros. They have<br />
not been adjusted<br />
for infl ation. In most cases, the<br />
company business year coincides<br />
with the calendar year. For some<br />
the business year deviates from<br />
the calendar year – but it always<br />
comprises 12 months ending in<br />
the business year quoted. In order<br />
to keep the study manageable<br />
and informative, only companies<br />
with turnover in excess of<br />
50 million euros in the last reference<br />
year (here 2008) are listed.<br />
These 26 companies are based<br />
in nine different countries and<br />
most of them maintain a transnational<br />
network of production<br />
sites, distribution branches and<br />
alliances.<br />
As the market development of<br />
Mexico<br />
Spain<br />
India<br />
Russia<br />
Republik of Korea<br />
Turkey<br />
Ireland<br />
the individual agricultural machinery<br />
product branches proceeds<br />
differently, the companies<br />
have been divided into fi ve “categories”.<br />
This makes it easier to<br />
compare the growth in sales of<br />
the companies within each category.<br />
The companies are listed<br />
in the sequence of sales volume<br />
in the year 2008 for each category.<br />
Category I consists of the<br />
Produktion volumes in the European Union<br />
in billion euros in Mrd. Euro Table 6<br />
30<br />
27,7<br />
25<br />
20<br />
15<br />
10<br />
5<br />
0<br />
19,7 20,5<br />
21,7<br />
23,8<br />
2004 2005 2006 2007 2008<br />
Source: Eurostat, VDMA (incl. own calculations)<br />
global longliners with tractors,<br />
machinery and equipment for<br />
grain and harvesting and other<br />
agricultural machinery branches<br />
depending on the company.<br />
Category II lists the three leading<br />
implement specialists who<br />
develop and produce machinery<br />
and equipment for both grassland<br />
and arable farming on a<br />
large scale. Category III consists<br />
of the implement specialists<br />
for arable farming. Category IV<br />
comprises specialists who chiefl y<br />
produce machinery and equipment<br />
for green forage harvesting<br />
and straw recovery. The ad-<br />
Continues on page 26