Numerical Study of Passive and Active Flow Separation Control ...
Numerical Study of Passive and Active Flow Separation Control ...
Numerical Study of Passive and Active Flow Separation Control ...

Create successful ePaper yourself
Turn your PDF publications into a flip-book with our unique Google optimized e-Paper software.
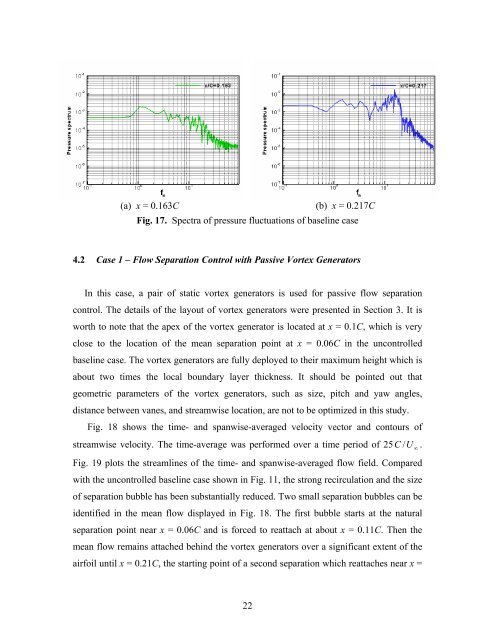
(a) x = 0.163C<br />
22<br />
(b) x = 0.217C<br />
Fig. 17. Spectra <strong>of</strong> pressure fluctuations <strong>of</strong> baseline case<br />
4.2 Case 1 – <strong>Flow</strong> <strong>Separation</strong> <strong>Control</strong> with <strong>Passive</strong> Vortex Generators<br />
In this case, a pair <strong>of</strong> static vortex generators is used for passive flow separation<br />
control. The details <strong>of</strong> the layout <strong>of</strong> vortex generators were presented in Section 3. It is<br />
worth to note that the apex <strong>of</strong> the vortex generator is located at x = 0.1C, which is very<br />
close to the location <strong>of</strong> the mean separation point at x = 0.06C in the uncontrolled<br />
baseline case. The vortex generators are fully deployed to their maximum height which is<br />
about two times the local boundary layer thickness. It should be pointed out that<br />
geometric parameters <strong>of</strong> the vortex generators, such as size, pitch <strong>and</strong> yaw angles,<br />
distance between vanes, <strong>and</strong> streamwise location, are not to be optimized in this study.<br />
Fig. 18 shows the time- <strong>and</strong> spanwise-averaged velocity vector <strong>and</strong> contours <strong>of</strong><br />
streamwise velocity. The time-average was performed over a time period <strong>of</strong> 25 ∞ U C / .<br />
Fig. 19 plots the streamlines <strong>of</strong> the time- <strong>and</strong> spanwise-averaged flow field. Compared<br />
with the uncontrolled baseline case shown in Fig. 11, the strong recirculation <strong>and</strong> the size<br />
<strong>of</strong> separation bubble has been substantially reduced. Two small separation bubbles can be<br />
identified in the mean flow displayed in Fig. 18. The first bubble starts at the natural<br />
separation point near x = 0.06C <strong>and</strong> is forced to reattach at about x = 0.11C. Then the<br />
mean flow remains attached behind the vortex generators over a significant extent <strong>of</strong> the<br />
airfoil until x = 0.21C, the starting point <strong>of</strong> a second separation which reattaches near x =