Numerical Study of Passive and Active Flow Separation Control ...
Numerical Study of Passive and Active Flow Separation Control ...
Numerical Study of Passive and Active Flow Separation Control ...

Create successful ePaper yourself
Turn your PDF publications into a flip-book with our unique Google optimized e-Paper software.
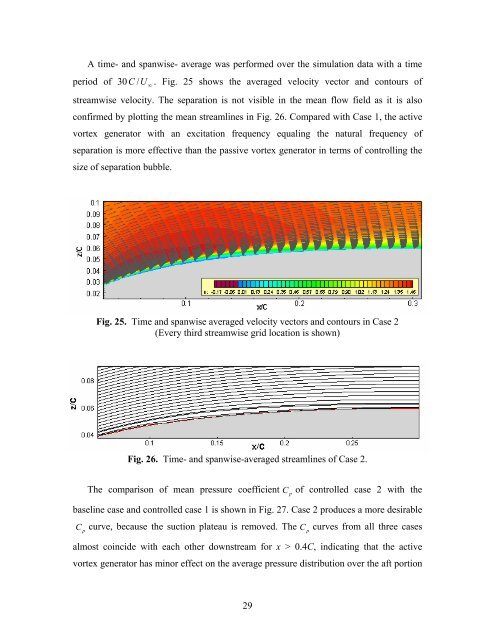
A time- <strong>and</strong> spanwise- average was performed over the simulation data with a time<br />
period <strong>of</strong> 30 ∞ U C / . Fig. 25 shows the averaged velocity vector <strong>and</strong> contours <strong>of</strong><br />
streamwise velocity. The separation is not visible in the mean flow field as it is also<br />
confirmed by plotting the mean streamlines in Fig. 26. Compared with Case 1, the active<br />
vortex generator with an excitation frequency equaling the natural frequency <strong>of</strong><br />
separation is more effective than the passive vortex generator in terms <strong>of</strong> controlling the<br />
size <strong>of</strong> separation bubble.<br />
Fig. 25. Time <strong>and</strong> spanwise averaged velocity vectors <strong>and</strong> contours in Case 2<br />
(Every third streamwise grid location is shown)<br />
Fig. 26. Time- <strong>and</strong> spanwise-averaged streamlines <strong>of</strong> Case 2.<br />
The comparison <strong>of</strong> mean pressure coefficient C <strong>of</strong> controlled case 2 with the<br />
p<br />
baseline case <strong>and</strong> controlled case 1 is shown in Fig. 27. Case 2 produces a more desirable<br />
C curve, because the suction plateau is removed. The p<br />
p<br />
29<br />
C curves from all three cases<br />
almost coincide with each other downstream for x > 0.4C, indicating that the active<br />
vortex generator has minor effect on the average pressure distribution over the aft portion