Numerical Study of Passive and Active Flow Separation Control ...
Numerical Study of Passive and Active Flow Separation Control ...
Numerical Study of Passive and Active Flow Separation Control ...

You also want an ePaper? Increase the reach of your titles
YUMPU automatically turns print PDFs into web optimized ePapers that Google loves.
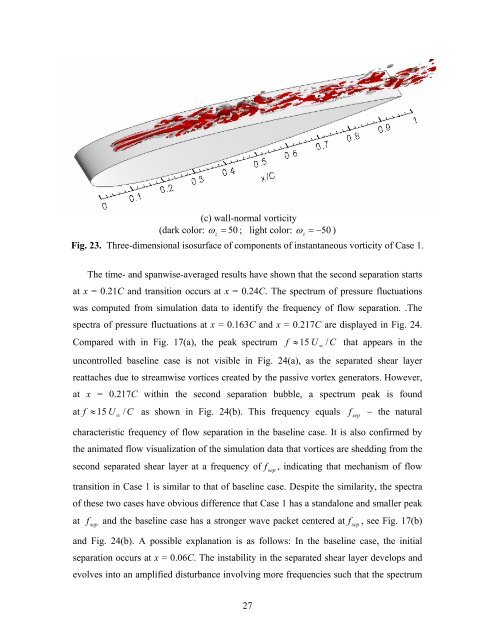
(c) wall-normal vorticity<br />
(dark color: ω z = 50 ; light color: ω z = −50<br />
)<br />
Fig. 23. Three-dimensional isosurface <strong>of</strong> components <strong>of</strong> instantaneous vorticity <strong>of</strong> Case 1.<br />
The time- <strong>and</strong> spanwise-averaged results have shown that the second separation starts<br />
at x = 0.21C <strong>and</strong> transition occurs at x = 0.24C. The spectrum <strong>of</strong> pressure fluctuations<br />
was computed from simulation data to identify the frequency <strong>of</strong> flow separation. .The<br />
spectra <strong>of</strong> pressure fluctuations at x = 0.163C <strong>and</strong> x = 0.217C are displayed in Fig. 24.<br />
Compared with in Fig. 17(a), the peak spectrum f ≈ 15 U ∞ / C that appears in the<br />
uncontrolled baseline case is not visible in Fig. 24(a), as the separated shear layer<br />
reattaches due to streamwise vortices created by the passive vortex generators. However,<br />
at x = 0.217C within the second separation bubble, a spectrum peak is found<br />
at f ≈ 15 U ∞ / C as shown in Fig. 24(b). This frequency equals f sep − the natural<br />
characteristic frequency <strong>of</strong> flow separation in the baseline case. It is also confirmed by<br />
the animated flow visualization <strong>of</strong> the simulation data that vortices are shedding from the<br />
second separated shear layer at a frequency <strong>of</strong> f sep , indicating that mechanism <strong>of</strong> flow<br />
transition in Case 1 is similar to that <strong>of</strong> baseline case. Despite the similarity, the spectra<br />
<strong>of</strong> these two cases have obvious difference that Case 1 has a st<strong>and</strong>alone <strong>and</strong> smaller peak<br />
at f sep <strong>and</strong> the baseline case has a stronger wave packet centered at f sep , see Fig. 17(b)<br />
<strong>and</strong> Fig. 24(b). A possible explanation is as follows: In the baseline case, the initial<br />
separation occurs at x = 0.06C. The instability in the separated shear layer develops <strong>and</strong><br />
evolves into an amplified disturbance involving more frequencies such that the spectrum<br />
27