Numerical Study of Passive and Active Flow Separation Control ...
Numerical Study of Passive and Active Flow Separation Control ...
Numerical Study of Passive and Active Flow Separation Control ...

You also want an ePaper? Increase the reach of your titles
YUMPU automatically turns print PDFs into web optimized ePapers that Google loves.
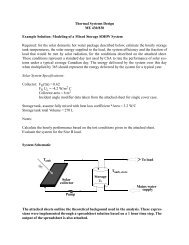
Fig. 22. Chord-wise distribution <strong>of</strong> peak turbulence kinetic energy <strong>of</strong> Case 1 in<br />
comparison with baseline case.<br />
Fig. 23 shows the three-dimensional isosurfaces <strong>of</strong> the instantaneous streamwise,<br />
spanwise, <strong>and</strong> wall-normal vorticity over the upper surface <strong>of</strong> the airfoil. The passive<br />
vortex generators at x = 0.1C produce a pair <strong>of</strong> counter-rotating streamwise vortices in<br />
the immediate downstream region, see Fig. 23(a). These vortices are the only threedimensional<br />
structures upstream <strong>of</strong> x = 0.2C. They bring high momentum fluid into the<br />
near-wall region <strong>and</strong> reattach the separated flow as shown in Fig. 23(b). The reattached<br />
flow separates again at about x = 0.2C which is very close to the mean separation point<br />
The animated flow field also shows a steady location <strong>of</strong> the second separation point. The<br />
animation also shows that the instantaneous reattachment point w<strong>and</strong>ers between x =<br />
0.25C <strong>and</strong> x = 0.3C. At the instant shown by Fig. 23, the reattachment occurs at about x =<br />
0.3C. Fig. 23 also shows the most active vortical structures between x = 0.3C <strong>and</strong> x =<br />
0.5C which is consistent with the distribution <strong>of</strong> peak turbulence kinetic energy in Fig.<br />
22.<br />
25