Gradient Master - Wolf Laboratories
Gradient Master - Wolf Laboratories
Gradient Master - Wolf Laboratories

Create successful ePaper yourself
Turn your PDF publications into a flip-book with our unique Google optimized e-Paper software.
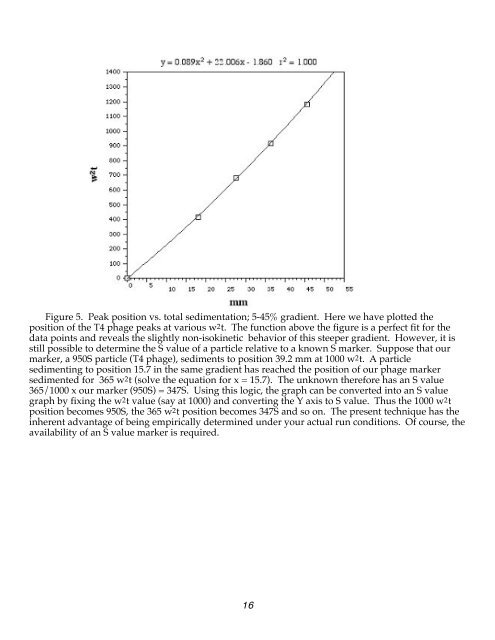
Figure 5. Peak position vs. total sedimentation; 5-45% gradient. Here we have plotted the<br />
position of the T4 phage peaks at various w2t. The function above the figure is a perfect fit for the<br />
data points and reveals the slightly non-isokinetic behavior of this steeper gradient. However, it is<br />
still possible to determine the S value of a particle relative to a known S marker. Suppose that our<br />
marker, a 950S particle (T4 phage), sediments to position 39.2 mm at 1000 w2t. A particle<br />
sedimenting to position 15.7 in the same gradient has reached the position of our phage marker<br />
sedimented for 365 w2t (solve the equation for x = 15.7). The unknown therefore has an S value<br />
365/1000 x our marker (950S) = 347S. Using this logic, the graph can be converted into an S value<br />
graph by fixing the w2t value (say at 1000) and converting the Y axis to S value. Thus the 1000 w2t<br />
position becomes 950S, the 365 w2t position becomes 347S and so on. The present technique has the<br />
inherent advantage of being empirically determined under your actual run conditions. Of course, the<br />
availability of an S value marker is required.<br />
16