Assessing the Costs and Benefits of Telelearning: A Case Study ...
Assessing the Costs and Benefits of Telelearning: A Case Study ...
Assessing the Costs and Benefits of Telelearning: A Case Study ...

Create successful ePaper yourself
Turn your PDF publications into a flip-book with our unique Google optimized e-Paper software.
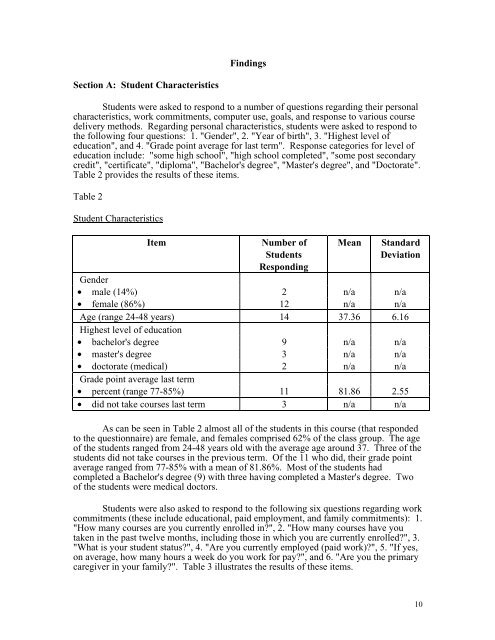
Section A: Student Characteristics<br />
Findings<br />
Students were asked to respond to a number <strong>of</strong> questions regarding <strong>the</strong>ir personal<br />
characteristics, work commitments, computer use, goals, <strong>and</strong> response to various course<br />
delivery methods. Regarding personal characteristics, students were asked to respond to<br />
<strong>the</strong> following four questions: 1. "Gender", 2. "Year <strong>of</strong> birth", 3. "Highest level <strong>of</strong><br />
education", <strong>and</strong> 4. "Grade point average for last term". Response categories for level <strong>of</strong><br />
education include: "some high school", "high school completed", "some post secondary<br />
credit", "certificate", "diploma", "Bachelor's degree", "Master's degree", <strong>and</strong> "Doctorate".<br />
Table 2 provides <strong>the</strong> results <strong>of</strong> <strong>the</strong>se items.<br />
Table 2<br />
Student Characteristics<br />
Item Number <strong>of</strong><br />
Students<br />
Responding<br />
Mean St<strong>and</strong>ard<br />
Deviation<br />
Gender<br />
• male (14%) 2 n/a n/a<br />
• female (86%) 12 n/a n/a<br />
Age (range 24-48 years) 14 37.36 6.16<br />
Highest level <strong>of</strong> education<br />
• bachelor's degree 9 n/a n/a<br />
• master's degree 3 n/a n/a<br />
• doctorate (medical) 2 n/a n/a<br />
Grade point average last term<br />
• percent (range 77-85%) 11 81.86 2.55<br />
• did not take courses last term 3 n/a n/a<br />
As can be seen in Table 2 almost all <strong>of</strong> <strong>the</strong> students in this course (that responded<br />
to <strong>the</strong> questionnaire) are female, <strong>and</strong> females comprised 62% <strong>of</strong> <strong>the</strong> class group. The age<br />
<strong>of</strong> <strong>the</strong> students ranged from 24-48 years old with <strong>the</strong> average age around 37. Three <strong>of</strong> <strong>the</strong><br />
students did not take courses in <strong>the</strong> previous term. Of <strong>the</strong> 11 who did, <strong>the</strong>ir grade point<br />
average ranged from 77-85% with a mean <strong>of</strong> 81.86%. Most <strong>of</strong> <strong>the</strong> students had<br />
completed a Bachelor's degree (9) with three having completed a Master's degree. Two<br />
<strong>of</strong> <strong>the</strong> students were medical doctors.<br />
Students were also asked to respond to <strong>the</strong> following six questions regarding work<br />
commitments (<strong>the</strong>se include educational, paid employment, <strong>and</strong> family commitments): 1.<br />
"How many courses are you currently enrolled in?", 2. "How many courses have you<br />
taken in <strong>the</strong> past twelve months, including those in which you are currently enrolled?", 3.<br />
"What is your student status?", 4. "Are you currently employed (paid work)?", 5. "If yes,<br />
on average, how many hours a week do you work for pay?", <strong>and</strong> 6. "Are you <strong>the</strong> primary<br />
caregiver in your family?". Table 3 illustrates <strong>the</strong> results <strong>of</strong> <strong>the</strong>se items.<br />
10