Handout 1 - Clemson University
Handout 1 - Clemson University
Handout 1 - Clemson University

You also want an ePaper? Increase the reach of your titles
YUMPU automatically turns print PDFs into web optimized ePapers that Google loves.
Development of a Helmet Liner for Protection Against Blast<br />
Induced Trauma<br />
by<br />
George Alexander Christou<br />
Diploma, Mechanical Engineering<br />
National Technical <strong>University</strong> of Athens, 2006<br />
Submitted to the Department of Aeronautics and Astronautics<br />
in partial fulfillment of the requirements for the Degree of<br />
Master of Science in Aeronautics and Astronautics<br />
at the<br />
MASSACHUSETTS INSTITUTE OF TECHNOLOGY<br />
February 2010<br />
© Massachusetts Institute of Technology 2010. All rights reserved.<br />
A u th o r ......................- ............................................ . ...............................<br />
Certified by ...................................<br />
Accepted by ..............................<br />
MASSACHUSETTS INSTITUTE<br />
OF TECHNOLOGY<br />
MAR 2 2 2010<br />
LIBRARIES<br />
ARCHIVES<br />
Departmen Aerona c and Astronautics<br />
January 29, 2010<br />
............ ... ........<br />
Laurence R. Young<br />
Apollo Program Professor of Astronautics<br />
Professor of Health Sciences and Technology<br />
Thesis Supervisor<br />
.. . ...........................<br />
. .<br />
Prof. Eytan H. Modiano<br />
Associate Professor of Aeronautics and Astronautics<br />
Chair, Committee on Graduate Students
Development of a Helmet Liner for Protection Against Blast<br />
Abstract<br />
Induced Trauma<br />
by<br />
George Alexander Christou<br />
Submitted to the Department of Aeronautics and Astronautics<br />
on January 29, 2010, in partial fulfillment of the<br />
requirements for the Degree of Master of Science in<br />
Aeronautics and Astronautics<br />
Traumatic brain injuries caused by shock waves attracted have increased medical and<br />
scientific attention to the due large percentage of combat troops that have sustained<br />
such injuries in recent conflict theatres. To this day, the knowledge in the fields of<br />
causes, effects and identification of traumatic brain injury is limited. The use of<br />
advanced body armor has decreased the number of fatalities from fragments observed<br />
in previous military operations, resulting in the increase of non-fatal brain injuries from<br />
shock waves.<br />
The purpose of this project is the advancement of the knowledge the field in of<br />
shock wave mitigation strategies and the development of helmet a liner for protection<br />
against blast trauma. induced The proposed helmet liner design is based on the<br />
introduction of solid and fluid filler materials channels inside opened in the interior of a<br />
foam liner order to in enhance the attenuation of incoming shock waves. Primary<br />
investigated attenuation mechanisms include acoustic impedance mismatches between<br />
the filler and foam material interfaces, viscous effects of fluid fillers, porosity<br />
particle size of solid filler materials. Specific goals of this research project include the<br />
and<br />
reduction of the peak pressure and pressure gradient of the transmitted wave through<br />
the helmet liner and the enhancement of the<br />
incoming shock wave.<br />
spatial distribution of the energy of the<br />
This research effort employed both shock tube experiments and numerical<br />
in order to investigate the effectiveness of the proposed helmet liner design.<br />
studies<br />
Quantitative have results shown that the use of high density filler materials result in<br />
higher attenuation levels than low density materials comparing while to solid foam
control samples. The peak transmitted overpressure and pressure gradient were<br />
significantly reduced with the use of high density materials while the duration of the<br />
positive phase was increased. This response resulted in lower overall impulse values of<br />
the transmitted wave. The use of high density filler materials also results in superior<br />
frequency distribution.<br />
Thesis Supervisor: Laurence R. Young<br />
Apollo Program Professor of Astronautics<br />
Professor of Health Sciences and Technology
Acknowledgments<br />
First and foremost, the author would like to thank his research and academic<br />
advisor Professor Laurence Young for his guidance, assistance and above all support for<br />
the whole duration of this research effort. This project would not have advanced this far<br />
without the help and assistance of the following Professors at MIT through their<br />
assistance at crucial points over the course of this work. Professor Lorna Gibson and her<br />
graduate students of the MIT Materials Lab have shared with us their extensive<br />
knowledge in the field of cellular materials and provided assistance during material<br />
testing procedures. Dr. Jack Germaine of the MIT Soils Lab has been generous in<br />
providing his laboratory facilities for additional material testing. I would also like to<br />
thank Professor Raul Radovitzky for his contribution to the numerical simulation leg of<br />
this project.<br />
I would also like express to my gratitude and appreciation to Professor Steven Son<br />
and his graduate student Matthew Alley of Purdue <strong>University</strong> for the experimental<br />
work they have undertaken and our fruitful collaboration. I would also like to thank the<br />
technicians of the Aero/Astro machine shop who have provided assistance and their<br />
expertise in various manufacturing processes important to our project. During the last<br />
year and a half Mr. Rahul Goel's contribution and assistance on all aspects of this<br />
project have been of high value for which the author is deeply thankful. I would like to<br />
acknowledge the support from CIMIT and the ONR ("A Fluid Helmet Liner for<br />
Protection Against Blast Induced Traumatic Brain Injury", Contract #: N00014-08-1-<br />
0261) through research funding.<br />
I would especially like to acknowledge the invaluable assistance of Dr. Antoine<br />
Jerusalem in the numerical portion of this thesis. Despite the distance between Boston<br />
and Madrid, Dr. Jerusalem has always been available to provide ample guidance and<br />
support.<br />
Finally, I would like to thank my parents back in Greece. Their support, encouragement<br />
and above all belief in me have always motivated me throughout my life and especially<br />
during the last two and a half years that I have been in the US.
List of Contents<br />
1 In trod u ction .......................................................................................................................... 17<br />
1.1 M otivation................................................................................................................... 17<br />
1.2 Objectives .................................................................................................................... 18<br />
1.3 Thesis Organization............................................................................................... 20<br />
2 Blast Induced Traumatic Brain Injury - Effects and Mitigation Efforts......................... 23<br />
2.1 Blast Effects on Hum ans ........................................................................................ 23<br />
2.2 Traum atic Brain Injury Research........................................................................ 27<br />
2.3 Blast M itigation Strategies ................................................................................... 30<br />
3 Fundamentals of Blast W ave M echanics .......................................................................... 33<br />
3.1 Blast W avefront Profile and Param eters............................................................. 33<br />
3.1.1 Introduction to Explosive Driven Blast W aves ............................................... 33<br />
3.1.2 Blast W ave Profiles .......................................................................................... 34<br />
3.2 Air Blast Theory ..................................................................................................... 40<br />
3.3 Blast Scaling ................................................................................................................ 46<br />
3.4 Blast W ave Interactions........................................................................................ 52<br />
3.4.1 Air Blast Impact on Fixed, Rigid Boundaries.................................................. 52<br />
3.4.2 Fluid-Structure Interaction in the Acoustic Range ........................................ 54<br />
3.4.3 Fluid-Structure Interaction with Nonlinear Gas Compressibility................... 55<br />
3.4.4 Non Zero Incident W ave Reflection ................................................................. 56<br />
3.5 Constitutive M odel of M aterials under Shock Loading .................................... 58<br />
3.5.1 Linear Hugoniot M odel ................................................................................... 58<br />
3.5.2 M ie Griineisen Equation of State ...................................................................... 60<br />
4 M aterials - M aterial Testing and M odeling ................................. ...... 61<br />
4.1 Dertex VN 600 Foam ................................................................................................. 61<br />
4.1.1 Modeling of VN 600 foam through Stress-Strain Curves ................ 63<br />
Uniaxial Testing of VN 600 Foam ....................................................................................... 63<br />
Hydrostatic Compression Testing of VN 600 Foam ............................................................ 67<br />
Scaling of M echanical Properties of VN 600 Foam .............................................................. 70<br />
4.1.2 Modeling of VN 600 foam through Mie - Graneisen Equation of State ...... 74<br />
4.2 Expanded Polystyrene Foam ............................................................................... 76<br />
4.3 Filler M aterials............................................................................................................ 80<br />
4.4 Plexiglas PM M A...................................................................................................... 82<br />
4 .5 W ater............................................................................................................................ 82<br />
4 .6 A ir................................................................................................................................. 8 3
5 Experimental Blast M itigation Study ............................................................................... 85<br />
5.1 Testing Apparatus.................................................................................................. 85<br />
5.2 Test Sam ples ............................................................................................................... 89<br />
5.3 Instrum entation...................................................................................................... 90<br />
5.4 Incom ing Blast W ave Param eters........................................................................ 93<br />
5 .5 R esu lts.......................................................................................................................... 9 5<br />
5.5.1 Foam - Filler M aterial Attenuation Study ...................................................... 95<br />
5.5.2 Attenuation - Blast Intensity Study ................................................................... 104<br />
6 Numerical Simulation of M aterial Response under Impulse Loading ............................... 109<br />
6.1 Sim ulation and Specim en Description.................................................................. 109<br />
6.2 Im pulse Loading Sim ulation Results ........ ........................ ............................... 115<br />
6.2.1 Pressure Response at 2 atm Loading Conditions ............................................... 115<br />
6.2.2 Pressure response at Alternate Loading Conditions .......................................... 128<br />
6.3 Conclusions............................................................................................................... 135<br />
7 Numerical Simulation of M aterial Response under Shock Loading .................................. 137<br />
7.1 Coupled Eulerian-Lagrangian Implementation in ABAQUS............................ 137<br />
7.2 Numerical Simulation of Shock Wave Propagation and Reflection................. 139<br />
7.3 Artificial Viscosity.................................................................................................... 149<br />
7.3.1 Artificial viscosity implementation in ABA QUS .............................................. 149<br />
7.3.2 Calibration of artificial viscosity ......................................................................... 151<br />
7.4 Sim ulation Description............................................................................................ 155<br />
7.5 Shock Loading Sim ulation Results........................................................................ 167<br />
7.6 Conclusions............................................................................................................... 180<br />
8 Final Conclusions ............................................................................................................... 183<br />
8.1 Sum m ary and Conclusions..................................................................................... 184<br />
8.2 Recommendations for Future Work............................... 187<br />
A. Appendix A - Scaling of Mechanical Properties of VN 600 Foam ................ 191<br />
B. Appendix B - Impulse Loading .......................................................................................... 197<br />
R eferen ces.................................................................................................................................... 2 1 1
List of Figures<br />
Figure 2.1-1: Survival curves of humans subject to blast waves depending on body<br />
orien tation [8] ............................................................................................................................. 24<br />
Figure 2.1-2: Coup and countrecoup regions [12]............................................................. 26<br />
Figure 2.2-1: DERAMan headform [20].................................................................................. 29<br />
Figure 3.1-1: Ideal blast w ave [35] ....................................................................................... 35<br />
Figure 3.1-2: Recorded pressure time histories of actual blast waves [32]..................... 39<br />
Figure 3.1-3: Pressure time curves produced from a cased charge [35]............. 40<br />
Figure 3.2-1: Moving and stationary shock wave [26]...................................................... 41<br />
Figure 3.2-2: Shock and particle velocity versus ps/p1 pressure ratio ........................... 45<br />
Figure 3.2-3: Density ratio versus ps/p1 pressure ratio.............................. 46<br />
Figure 3.3-1: Hopkinson blast scaling law [32]......................................................................<br />
Figure 3.4-1: a) Mach stem triple point formation; b) Mach stem and triple point<br />
49<br />
development in respect to height of burst explosion; c) Pressure on ground vs. range [7]<br />
....................................................................................................................................................... 5 7<br />
Figure 3.5-1: The Hugoniot curve (- -) - and the Rayleigh line ( ... ).......................... 59<br />
Figure 4.1-1: Experimental uniaxial compression stress-strain curves for VN 600 foam 65<br />
Figure 4.1-2: Pressure chamber and foam specimen (left picture) compartment with<br />
p iston (right p ictu re).................................................................................................................. 67<br />
Figure 4.1-3: Experimental hydrostatic compression pressure- volumetric strain curves<br />
for V N 600 foam ......................................................................................................................... 69<br />
Figure 4.1-4: Experimental and scaled curves for uniaxial compression....................... 72<br />
Figure 4.1-5: Experimental and scaled curves for hydrostatic compression................. 72<br />
Figure 4.2-1: Hardening data oc vs. true strain for EPS foam ........................................ 79<br />
Figure 5.1-1: Experimental apparatus in its final form. Front view ............................... 86<br />
Figure 5.1-2: Experimental apparatus in its final form. Side view ................................. 87<br />
Figure 5.1-3: Explosive driven shock tube [21]................................................................. 88<br />
Figure 5.2-1: Illustration of single cavity test samples...................................................... 89<br />
Figure 5.3-1: Shadowgraph and experimental setup [21] ............................................... 92<br />
Figure 5.4-1: Profile of incoming blast wave [21]...............................................................<br />
Figure 5.5-1: Transmitted pressure profiles for the solid foam, aerogel, cabosil and<br />
94<br />
expanding foam filled test sam ples......................................................................................... 97<br />
Figure 5.5-2: PSD graph for free-field, solid foam, aerogel, cabosil and expanding foam<br />
filled test sam p les.......................................................................................................................<br />
Figure 5.5-3: Transmitted pressure profiles for the solid foam, volcanic tuff and glass<br />
98<br />
shot filled foam sam ples ......................................................................................................... 100
Figure 5.5-4: PSD graph for free-field, solid foam, volcanic tuff and glass shot filled test<br />
sam p les ...................................................................................................................................... 10 0<br />
Figure 5.5-5: Transmitted pressure profiles for the solid water foam, and glycerin filled<br />
fo am sam p les ............................................................................................................................ 102<br />
Figure 5.5-6: PSD graph for free-field, solid foam, water and glycerin filled foam<br />
sam p les ...................................................................................................................................... 1 0 2<br />
Figure 5.5-7: Shadowgraph images during blast of solid foam [21]...............104<br />
Figure 5.5-8: Blast profiles for blast intensity parametric study at 12 inch, 8 inch and 4<br />
inch standoff distance [21]......................................................................................................106<br />
Figure 6.1-1: Foam specim en .................................................................................................. 110<br />
Figure 6.1-2: Single cavity configuration .............................................................................. 111<br />
Figure 6.1-3: D ual cavity configuration ................................................................................ 111<br />
Figure 6.1-4: Surface element region used to define fluid cavity......................................113<br />
Figure 6.1-5: Mesh for dual cavity configuration................................................................114<br />
Figure 6.2-1: Probed elements of bottom surface ................................................................ 116<br />
Figure 6.2-2: Pressure profiles at element A of bottom surface at loading.....118<br />
2atm<br />
Figure 6.2-3: Pressure profiles at element D of bottom surface at 2atm loading......119<br />
Figure 6.2-4: Pressure profiles at element G of bottom surface at 2atm loading......120<br />
Figure 6.2-5: Pressure profiles at element B of bottom surface at 2atm loading......121<br />
Figure 6.2-6: Pressure profiles at element C of bottom surface 2atm at loading ...... 122<br />
Figure 6.2-7: Pressure profiles at element of bottom H surface at 2atm loading.....122<br />
Figure 6.2-8: Pressure profiles at element J of bottom surface 2atm at loading......123<br />
Figure 6.2-9: Pressure profiles at element L of bottom surface at 2atm............ 124<br />
Figure 6.2-10: Integrated absolute pressure values for bottom surface of solid EPS foam<br />
at 2 atm loading conditions .................................................................................................... 125<br />
Figure 6.2-11: Integrated absolute pressure values for bottom surface of air filled dual<br />
cavity configuration at 2 atm loading conditions............................ ....... 126<br />
Figure 6.2-12: Integrated absolute pressure values for bottom surface of water filled<br />
dual cavity configuration at 2 atm loading conditions.......................................................126<br />
Figure 6.2-13: Integrated absolute pressure values for bottom surface of air filled single<br />
cavity configuration at 2 atm loading conditions................................................................ 127<br />
Figure 6.2-14: Integrated absolute pressure values for bottom surface of water filled<br />
single cavity configuration at 2 atm loading conditions .................................................... 127<br />
Figure 6.2-15: Pressure profiles at element A of bottom surface latm at loading..........129<br />
Figure 6.2-16: Pressure profiles at element A of bottom surface 3atm at loading..........130<br />
Figure 6.2-17: Pressure profiles at element B of bottom surface latm at loading...........131<br />
Figure 6.2-18: Pressure profiles at element B of bottom surface 3atm at loading...........131<br />
Figure 6.2-19: Pressure profiles at element C of bottom surface at latm loading .......... 132<br />
Figure 6.2-20: Pressure profiles at element C of bottom surface 3atm at loading .......... 133<br />
Figure 6.2-21: Integrated absolute pressure values for bottom surface of water filled<br />
dual cavity configuration ........................................................................................................ 134
Figure 7.2-1: Air pressure values in computational grid ................................................... 140<br />
Figure 7.2-2: Pressure profiles at 0.17 MPa loading ............................................................ 141<br />
Figure 7.2-3: Pressure profiles at 1 MPa loading ................................................................. 142<br />
Figure 7.2-4: Density profiles at 0.17 MPa loading ............................................................. 143<br />
Figure 7.2-5: Density profiles at 1 MPa loading .................................................................. 144<br />
Figure 7.2-6: Particle velocity profiles at 0.17 MPa loading...............................................145<br />
Figure 7.2-7: Particle velocity profiles at 1 MPa loading....................................................145<br />
Figure 7.3-1: Incoming wave pressure profiles at 52.5m distance for combinations of<br />
artificial viscosity coefficients (b1/b 2) ................................................................................... 152<br />
Figure 7.3-2: Reflected wave pressure profiles at 52.5m distance for combinations of<br />
artificial viscosity coefficients (b1/b2) ................................................................................... 153<br />
Figure 7.3-3: Incoming wave pressure profiles at 122.5m distance for combinations of<br />
artificial viscosity coefficients (b1/b 2) ................................................................................... 153<br />
Figure 7.3-4: Reflected wave pressure profiles at 122.5m distance for combinations of<br />
artificial viscosity coefficients (b1/b 2) ................................................................................... 154<br />
Figure 7.4-1: Views of quarter solid foam specimen (left) and quarter single cavity<br />
specimen (right), green ellipse X symmetry, red ellipse Y symmetry ............................. 156<br />
Figure 7.4-2: Regions of constrained translational degrees of freedom on top (left) and<br />
bottom surface (right) of solid foam specimen.................................................................... 157<br />
Figure 7.4-3: Eulerian dom ain ................................................................................................ 157<br />
Figure 7.4-4: 3D view of Eulerian domain............................................................................159<br />
Figure 7.4-5: View of cavity configuration inside Eulerian domain...............159<br />
Figure 7.4-6: Boundary conditions imposed on internal (left) and external surfaces<br />
(right) of Eulerian domain, solid green ellipse X symmetry, solid red ellipse Y<br />
symmetry, dashed green ellipse zero X displacement, dashed red ellipse zero Y<br />
d isp lacem en t.............................................................................................................................161<br />
Figure 7.4-7: External boundary of cavity ............................................................................ 162<br />
Figure 7.4-8: Single cavity configuration sample mesh......................................................163<br />
Figure 7.4-9: Eulerian domain mesh......................................................................................164<br />
Figure 7.4-10: Surface of Eulerian domain where loading is applied .............................. 166<br />
Figure 7.4-11: Experimental and numerical shock wave profiles ..................................... 167<br />
Figure 7.5-1: Recorded transmitted wave locations............................................................ 168<br />
Figure 7.5-2: Solid foam configuration experimental and numerical transmitted pressure<br />
p rofiles at p oin t A .................................................................................................................... 170<br />
Figure 7.5-3: Water filled single cavity configuration experimental and numerical<br />
transmitted pressure profiles at point A...............................................................................172<br />
Figure 7.5-4: Reflected wave profiles at top of Plexiglas sheet..........................................174<br />
Figure 7.5-5: Pressure at moment of attained peak transmitted pressure at point A for<br />
solid foam case ......................................................................................................................... 175<br />
Figure 7.5-6: Pressure at moment of attained peak transmitted pressure at point A for<br />
solid foam and water filled cavity case.................................................................................176<br />
Figure 7.5-7: Pressure at moment of attained 1500 Pa pressure at point A for solid foam<br />
c a se .............................................................................................................................................<br />
1 7 7
Figure 7.5-8: Pressure at moment of attained 1500 Pa pressure at point A for solid foam<br />
and w ater filled cavity case .................................................................................................... 177<br />
Figure 7.5-9: P1 and P2 points located on top and bottom points of foam region along<br />
axis sy of m m etry ...................................................................................................................... 178<br />
Figure 7.5-10: Deflection of points P1 and P2 for solid foam and water filled cavity<br />
sim u latio n s ................................................................................................................................ 1 79<br />
Figure 8.2-1: Exploded of proposed view 3D helmet liner ................................................ 188<br />
Figure A-1: 9th order polynomial fitted curves to uniaxial experimental data of VN 600<br />
fo am ...........................................................................................................................................<br />
Figure A-2: 9th order polynomial fitted curves to hydrostatic experimental data of VN<br />
1 9 2<br />
600 fo am .................................................................................................................................... 193<br />
Figure A-3: Power law strain rate sensitivity of VN 600 foam for uniaxial compression<br />
.....................................................................................................................................................<br />
Figure A-4: Power law strain rate sensitivity of VN 600 foam for hydrostatic<br />
1 9 4<br />
co m p ression .............................................................................................................................. 194<br />
Figure B-1: Pressure profiles at element A of bottom surface latm at loading .............. 197<br />
Figure B-2: Pressure profiles at element A of bottom surface 3atm at loading ....... 198<br />
Figure B-3: Pressure profiles element at B of bottom surface latm at loading ............... 198<br />
Figure B-4: Pressure profiles at element B of bottom surface 3atm at loading ............... 199<br />
Figure B-5: Pressure profiles at C element of bottom surface at latm loading.......199<br />
Figure B-6: Pressure profiles at element C of bottom surface at 3atm loading....... 200<br />
Figure B-7: Pressure profiles at element D of bottom surface at latm loading ....... 200<br />
Figure B-8: Pressure profiles at D element of bottom surface at 3atm loading ....... 201<br />
Figure B-9: Pressure profiles at element G of bottom surface at latm loading............... 201<br />
Figure B-10: Pressure profiles at element G of bottom surface at 3atm loading...... 202<br />
Figure B-11: Pressure profiles at element H of bottom surface latm at loading ...... 202<br />
Figure B-12: Pressure profiles at element H of bottom surface at 3atm loading ......<br />
Figure B-13: Pressure profiles at element J of bottom surface latm at loading .......<br />
Figure B-14: Pressure profiles at element J of bottom surface 3atm at loading .......<br />
203<br />
203<br />
204<br />
Figure B-15: Pressure profiles at element L of bottom surface latm at loading ...... 204<br />
Figure B-16: Pressure profiles at element L of bottom surface 3atm at loading ...... 205<br />
Figure B-17: Integrated absolute pressure values for bottom surface of solid foam<br />
sa m p le ........................................................................................................................................ 2 0 6<br />
Figure B-18: Integrated absolute pressure values for bottom surface of air filled dual<br />
cavity con figu ration ................................................................................................................. 207<br />
Figure B-19: Integrated absolute pressure values for bottom surface of air filled single<br />
cav ity con figu ration ................................................................................................................. 208
Figure B-20: Integrated absolute pressure values for bottom surface of water filled dual<br />
cavity con figuration ................................................................................................................. 209<br />
Figure B-21: Integrated absolute pressure values for bottom surface of water filled<br />
single cavity configuration ..................................................................................................... 210
List of Tables<br />
Table 3.3-1: Mass specific energy and TNT conversion factors for various explosives [7]<br />
....................................................................................................................................................... 4 8<br />
Table 4.1-1: V N 600 foam properties ....................................................................................... 62<br />
Table 4.1-2: Uniaxial compression tests for VN 600 foam.................................................... 64<br />
Table 4.1-3: Mechanical properties of VN 600 foam under uniaxial compression..... 66<br />
Table 4.1-4: Hydrostatic tests for VN 600 foam ................................................................. 68<br />
Table 4.1-5: Mechanical properties of VN 600 foam under hydrostatic compression..... 70<br />
Table 4.1-6: Rate sensitivity power coefficient n(s) of VN 600 foam for uniaxial and<br />
h y d rostatic load in g .................................................................................................................... 71<br />
Table 4.1-7: Material properties of scaled curves for VN 600 foam................ 73<br />
Table 4.1-8: Mie-Grtneisen parameters for VN 600 foam.................................................... 76<br />
Table 4.2-1: Material properties of EPS foam [50, 51, 52]..................................................... 79<br />
Table 4.3-1: Properties of filler materials [21, 53, 54] ........................................................ 81<br />
Table 4.4-1: PMMA material parameters............................................................................. 82<br />
Table 4.5-1: Water material parameters ............................................................................... 82<br />
Table 4.6-1: Air Material parameters....................................................................................83<br />
Table 5.4-1: Measured blast parameters for incoming wave [21] ................................... 93<br />
Table 5.5-1: Measured blast parameters for all test configurations [21] .......................... 103<br />
Table 5.5-2: Blast parameters for blast intensity parametric study at 12 inch, 8 inch and 4<br />
inch standoff distance [21]......................................................................................................107<br />
Table 7.2-1: Numerical and theoretical values of shock wave propagation parameters for<br />
in com in g w av e ......................................................................................................................... 146<br />
Table 7.2-2: Numerical and theoretical values of reflection coefficient CR...................... 147<br />
Table 7.2-3: Numerical and theoretical values of shock wave propagation parameters for<br />
in com in g w av e ......................................................................................................................... 148<br />
Table 7.5-1: Solid foam experimental and numerical transmitted wave parameters .... 170<br />
Table 7.5-2: Single cavity water experimental and numerical transmitted wave<br />
p aram eters.................................................................................................................................171<br />
Table A-1: Rate sensitivity power coefficient n(s) of VN 600 foam for uniaxial and<br />
hy drostatic loadin g .................................................................................................................. 195
1 Introduction<br />
This first introductory chapter provides the reader with a short description of the<br />
important issue that has been primary the motivation of this research effort. An<br />
overview of the goals set to be accomplished and a description of this thesis follow as to<br />
provide the reader basic with insight in the structure and methodology of the research<br />
project.<br />
1.1 Motivation<br />
Improvised Explosive Devices (IEDs) also known as roadside bombs have caused<br />
over 60% of all American combat in Iraq and casualties about 50% of combat casualties<br />
in Afghanistan, both killed and wounded in the period 2001-2007 [1]. Traumatic Brain<br />
Injury (TBI) caused by shock waves produced by the detonation of IEDs has attracted<br />
increasing medical and scientific attention due to the large percentage of combat troops<br />
that sustain blast induced TBI. The Military Health System has recorded almost 44,000<br />
patients who have been diagnosed with TBI during the period 2003-2007 [2]. The<br />
Department of Defense has established a number of organizations order to develop in<br />
countermeasures against the increasing threat of IEDs and blast induced TBI. However,<br />
insurgents appear to quickly adapt to countermeasures, and new more sophisticated<br />
IEDs are increasingly used in combat theatres [1].<br />
According to numerous sources, various factors have contributed to the<br />
substantially increased number of cases with TBI in the recent wars in Afghanistan and<br />
Iraq [2, 3, 4]. The frequent use of IEDs in urban combat environments is one of the most<br />
significant factors. The use of personal protective equipment including Kevlar helmets<br />
and vests, provide better protection against ballistic threats and have improved the<br />
survivability rate compared to previous wars. In the Vietnam War mortality after
combat related brain injuries was high; hence few combatant casualties were treated for<br />
traumatic brain injuries. However, the protective gear that is currently used does not<br />
offer much protection against closed head injuries which are typical in cases of blasts.<br />
Another determining factor is the fact that there was relative little knowledge in<br />
previous conflicts about traumatic brain injuries and more life threatening injuries were<br />
a priority.<br />
Let us conclude this introductory paragraph by quoting Lt. Col. Rocco Armondo<br />
MD., an attending neurosurgeon at the National Naval Medical Center in Bethesda in<br />
order to emphasize the problem at hand, "Traumatic brain injury is the signature<br />
wound of this war". The increasing frequency and severity of blast induced TBI is the<br />
motivation behind our research effort. Subsequently, the development of protective<br />
head gear with an increased level of protection against blast waves created by IED<br />
detonations is our primary goal.<br />
1.2 Objectives<br />
In the previous paragraph we introduced the concept of TBI and established the fact<br />
that according to many sources it is the signature injury of the war in Iraq [2, 3, 4]. There<br />
are currently numerous research efforts investigating the effects, treatment and causes<br />
of TBI. However, another important aspect is the development of mitigation strategies,<br />
which can be introduced in the front line. Our research project focuses on the mitigation<br />
aspect of the problem at hand.<br />
The aim of this research project is the development of a new helmet liner, containing<br />
channels with various filler materials, in order to provide enhanced protection against<br />
blast induced TBI compared to current standard army helmets. As previously<br />
mentioned, the protective gear that is in current use provides improved level of<br />
protection against ballistic threats, such as shrapnel and debris. However the level of
protection against blast waves is limited. Therefore, the need for additional protection<br />
against blast threats is of high priority.<br />
This research project stems from a previous helmet liner design for sports helmets.<br />
Previous experimental studies undertaken at the Man Vehicle at MIT Lab [5] suggest<br />
that the use of a helmet liner with internal fluid filled channels and chambers offers<br />
increased protection against impacts. Drop test experiments have indicated that the<br />
acceleration levels experienced with the use of a fluid filled helmet liner are<br />
significantly lower as compared to g levels attained by pure foam liners. Based on this<br />
mitigation strategy our goal is to test both experimentally and numerically, the proven<br />
effectiveness of this concept at higher energy levels and specifically against incoming<br />
blast waves.<br />
Specifically, the goal of this project is to use fluid and solid filler materials in<br />
channels and chambers opened inside a foam helmet liner in order to attenuate an<br />
incoming blast wave. Primary investigated attenuation mechanisms include acoustic<br />
impedance mismatches between the filler material and foam interfaces, viscous effects<br />
of fluid fillers, porosity and particle size of solid filler materials. Focus has been directed<br />
on both experimental and numerical efforts in order to derive validated results.<br />
Specifically the goals of our project be summarized can as:<br />
* The reduction of the peak transmitted pressure of an incoming blast wave is of primary<br />
concern since the peak pressure plays a significant role in TBI.<br />
* The enhancement of the spatial distribution of the incoming energy; we are looking into<br />
distributing the incoming energy over a large surface in area order to decrease<br />
the effects of localized injuries.<br />
e The increase of the time duration the transmitted of wave, in order to obtain smaller<br />
pressure gradients.
0 The determination of optimal filler materials, which satisfy above the goals.<br />
1.3 Thesis Organization<br />
This thesis includes results, findings and discussion topics that derive both from<br />
experimental and numerical aspects of this research project aimed at the development<br />
of a new helmet liner concept. The thesis consists of seven chapters.<br />
Chapter 2 concentrates on blast induced TBI. A summary of the current knowledge<br />
in this field is presented; causes, effects and treatment options are discussed. The<br />
chapter continues with fundamental research efforts that are being undertaken in the<br />
field of TBI in order to further enhance the current level of knowledge. Current medical,<br />
experimental and numerical studies in the field presented. are Finally, a number of<br />
representative studies concerning mitigation efforts are also discussed.<br />
The fundamentals of blast wave mechanics are presented in Chapter 3. Propagation<br />
mechanisms of blast waves are discussed in detail including the governing equations,<br />
characteristic forms of the incoming pressure waves and blast parameters. The chapter<br />
covers important scaling rules, the fundamentals of blast wave interactions and Fluid<br />
Structure Interaction (FSI). Finally, the Hugoniot linear shock model and Mie-Grtneisen<br />
Equation of State, used for the material description during the numerical study, are<br />
described.<br />
The main core of the thesis begins with Chapter 4 which is solely devoted to the<br />
mechanical properties of the materials that were used during our research project.<br />
Material testing procedures and derived mechanical properties occupy a large part of<br />
this chapter. Properties for both filler materials, placed inside the opened channels, and<br />
foam materials used are presented.<br />
Chapter 5 provides a description of the experimental approach that was taken in<br />
order to evaluate the blast attenuation capabilities of the mitigation design. The
experimental apparatus, procedure and results are presented for the range of<br />
investigated filler materials.<br />
Chapters 6 and 7 concentrate on the numerical study of the problem at hand. The<br />
numerical that models were developed in order to study and assess the response of the<br />
proposed helmet liner samples under impulse and shock loading conditions are<br />
presented and discussed.<br />
Finally, Chapter 8 contains the conclusions and the final summary of this study. The<br />
results are compared to the objectives that were initially stated in the first chapter and<br />
analyzed. Furthermore, recommendations for future are work proposed in order to<br />
advance the work and foundations have been that set by this study.
2 Blast Induced Traumatic Brain Injury - Effects and<br />
Mitigation Efforts<br />
Our research effort concentrates on the development of a helmet liner that increases<br />
the effectiveness against blast induced trauma in comparison with previous<br />
conventional helmet liners constructed of pure foam. The following chapter focuses on<br />
current and previous blast mitigation strategies and the adverse effects of blast induced<br />
Traumatic Brain Injury (TBI).<br />
2.1 Blast Effects on Humans<br />
The four basic mechanisms of blast injury for humans are characterized as primary,<br />
secondary, tertiary and quaternary. Blast injuries are characterized by anatomical and<br />
physiological changes from the direct or reflective over-pressurization force impacting<br />
the body's surface. The characteristics of the four types of blast injury are [6,7]:<br />
> Primary: Results from the impact of high pressure blast waves with body<br />
surfaces. Gas filled structures, such as lungs, middle ear and gastrointestinal (GI)<br />
tract, are most susceptible. Injuries such as abdominal hemorrhage and perfora,<br />
middle ear rupture damage, lung damage (pulmonary barotraumas) and<br />
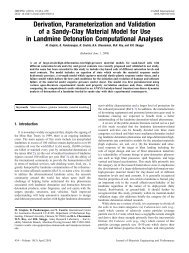
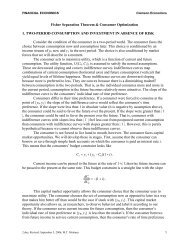
concussion are typical forms associated with primary blast effects. The following<br />
Figure 2.1-1 represents the survival curves for humans subjected to blast waves<br />
[8].<br />
> Secondary: This form of injury is mostly attributed to projectiles, debris and<br />
fragments. Due to its mechanical origin, any body part may be affected by<br />
penetrating ballistic damage.
Tertiary: Results form individuals being thrown by the blast wind. As with<br />
secondary injury types, any body part may be affected. Typical injuries include<br />
fracture and traumatic amputation and open/closed brain injury.<br />
> Quaternary: This form includes all other explosion-related injuries which do not<br />
fall under the previous three categories. These include burns, crash injuries,<br />
breathing problems etc.<br />
P 0 k~ UN 021 0kt<br />
AsV-.<br />
7 '/<br />
Figure 2.1-1: Survival curves of humans subject blast to waves depending on body orientation [8]<br />
In this research effort we will focus on primary injuries and specifically blast<br />
induced TBI. In the past, injuries due to blasts sustained in gas filled organs such as<br />
lungs, ears and GI tract were of more concern. Mild to moderate TBI resulting from<br />
blast shock waves has received increasing attention as the signature injury of recent
military conflicts [9]. A TBI is defined as a blow, jolt to the head or a penetrating head<br />
injury that disrupts the function of the brain [10]. Concussions, also called "closed head<br />
injuries" are a type of TBI. However, not all jolts or blows to the head result in TBI. The<br />
severity of such an injury may range from "mild", i.e. a brief change mental in status or<br />
consciousness, to "severe", i.e. an extended of unconsciousness period or amnesia after<br />
the injury. TBI can cause a wide range of functional changes affecting thought,<br />
sensation, movement, and language emotions. Some symptoms may appear<br />
immediately after the injury; however, other symptoms not appear may for days or<br />
weeks. This attribute makes the detection of TBI a very difficult process. In cases of<br />
mild-TBI patients recovery the time is within weeks/months, but a small percentage<br />
has persistent symptoms. the other On hand, patients with moderate to severe TBI may<br />
never fully recover [10].<br />
To this date the exact physical mechanisms by which waves blast reach the brain<br />
and cause mild to moderate TBI have not been exactly determined are being and<br />
currently investigated. Possible mechanisms include the direct passage of the blast<br />
wave to the brain through some cranium mechanism, the propagation of the blast wave<br />
to the brain through orbital and/or aural openings or even through a thoracic<br />
mechanism [9].<br />
The initial events of brain trauma involve mechanical distortion of the brain within<br />
the head due to an experienced acceleration. The translational cranial motion causes<br />
relative brain movements and short term intracranial pressure gradients. As a result a<br />
possible outcome is a coup-countrecoup injury. Coup contusions are produced by the<br />
impact of the skull on brain the at the loading location while countrecoup lesions follow<br />
from the bouncing of the brain against the inner posterior surface of the brain, resulting<br />
in possible development of cavitation bubbles within the brain to due negative<br />
pressure. Cavitation effects can also be present in the coup following region a severe<br />
shock wave both in coup and countrecoup regions [11]. The following Figure 2.1-2<br />
illustrates the previously mentioned coup and countrecoup regions.
Skull<br />
CONTRE COUP COUP<br />
Figure 2.1-2: Coup and countrecoup regions [121<br />
Contemporary knowledge shows us that primary disruption of axons and<br />
subsequent instantaneous cell death are not common initial events following TBI. The<br />
most probable initial cellular abnormality following TBI is focal impairment of axonal<br />
transport. Axonal transport injury occurs fundamentally produces diffuse and axonal<br />
injury primarily the subcortical in white matter, a process that recent work suggest<br />
might take several hours to complete [13]. Another area of interest is the formation of<br />
small air bubbles due to the propagation of shock waves through the brain. These<br />
bubbles create small cavities in the brain when they eventually burst. If these bubbles<br />
form within blood vessels, they can form emboli that travel to the brain, causing parts<br />
of the brain to die due to the lack of oxygen. It is also clear that shock waves lead to<br />
activation of microglia, cells of the immune system that are recruited at sites of brain<br />
injury [14].
2.2 Traumatic Brain Injury Research<br />
Until recent military conflicts TBI had not been the focus of much attention, since it<br />
had been chiefly dismissed in order to focus on more severe cases. In the present time,<br />
there has been a large national effort in order to diagnose, treat and prevent traumatic<br />
brain injuries. However, to this day little is unambiguously known and proven about<br />
the epidemiology of mild TBI during deployment and its association with adverse<br />
health issues post deployment. The case definition of mild TBI that is being adopted by<br />
the Department of Defense and Department of Veteran Affairs has not been completely<br />
evaluated and does not seem to be sufficient for the combat environment, where acute<br />
signs of concussion, such as alteration of mental status, overlap may with dissociative<br />
symptoms of acute stress disorder. There seems to be difficulties in identifying TBI even<br />
in the post combat period, during which postconcussive symptoms may overlap with<br />
symptoms of post traumatic stress disorder (PTSD) [15]. During the past few years<br />
numerous clinical and biomedical research efforts have been initiated which aim to<br />
enhance our knowledge on the causes, damage patterns, symptoms and treatment of<br />
blast induced TBI.<br />
In regard to experimental research efforts, most researchers have focused on blast<br />
induced brain injuries on animal subjects such as rats, pigs, sheep etc. Blast studies on<br />
animal subjects have revealed that the mechanisms of trauma induced by blast waves in<br />
solid tissues with various density, such as the brain, likely involve different wave<br />
parameters, such as impact pressure, velocity and wave duration, than in gas filled<br />
organs such as lungs. These research efforts indicate internal wave speed variations,<br />
possibly due to reflections and refractions on internal structures and interfaces due to<br />
impedance mismatches [9, 16]. Other studies have shown that exposure to low level<br />
blast pressure resulted in significant performance decrement and degenerative changes<br />
in cortical neurons in rat brains [17]. Another interesting artifact of research efforts is<br />
that a critical factor in the alteration of the biophysical properties of the neuronal
membranes is the pressure integrated over time, rather than the peak pressure [18].<br />
However, not all of the available research in studies the field of TBI have been focused<br />
solely on brain injuries but primarily on cranial/tissue response from blast andwaves<br />
stress waves by missile created attacks [9, 19].<br />
Other research efforts in the field of TBI focus on the development and use of<br />
synthetic headforms in order to assess the effects of blast loading. Considerable effort<br />
has been made in order to construct headforms with properties similar to the human<br />
brain tissue. and References [20, 21] present a thorough literature survey of current<br />
available headforms used in blast TBI research. One of the first human surrogate<br />
headforms to be used was the Hybrid III anthropomorphic device (ATD) test developed<br />
by General Motors 1973 in for evaluating automotive occupant safety. This headform is<br />
reasonably accurate and replicates the and mass rigid body kinematics adequately.<br />
However, the physical properties of the headform are not representative of the human<br />
skull and brain, therefore the response to an incoming blast wave will not be similar to<br />
the response of a human headform. Another approach was development the of the<br />
Manikin for Assessing Blast Incapacitation and Lethality (MABIL) by the DRDC<br />
Valcartier for the evaluation of new personal protection concepts against blast threats.<br />
MABIL consists of a solid urethane with head detailed and ear facial features and a<br />
simplified torso representation. The headform is instrumented with two pressure<br />
transducers (one in the ear canal and one in the mouth), however the MABIL relied on<br />
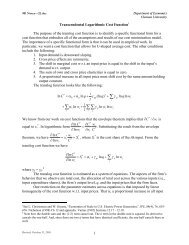
the Hybrid III for global accelerations and impact measurement. The Dynamic Event<br />
Response Analysis (DERAMan) Man head was designed by Britain's Defense<br />
Evaluation and Research Agency. is developed to It closely resemble geometrical<br />
features of the head and includes a soft gelatinous brain. The whole model (head and<br />
neck) is fitted with 85 piezoelectric sensors, accelerometers and a 3-D force gauge.<br />
DERAMan is featured in Figure 2.2-1.
Figure 2.2-1: DERAMan headform [20]<br />
Computational efforts are also under way order in to model the response of the<br />
skull/brain to incoming waves. blast One of the first three dimensional models of the<br />
brain was developed in by Ward and Thompson in 1975 to reproduce the experimental<br />
tests carried out on cadaver heads. This model incorporates a rigid skull, a<br />
cerebrospinal fluid with linear elastic properties and elastic an brain [22]. One of the<br />
most developed and widely used FEM brain models is the Wayne State <strong>University</strong><br />
brain injury model (WSUBIM). The final version of this model differentiates the<br />
material properties of grey brain matter from white matter, simulates essential<br />
anatomical compartments of the head, includes a sliding surface between the brain and<br />
the skull, models the scalp, falx cerebri, sagittal sinus, transverse sinus, cerebrospinal<br />
fluid, cerebellum and other features. The mechanical properties of the brain were<br />
characterized as viscoelastic while elastic-plastic material properties were used for<br />
cortical and cancellous bones of the face [22]. Another well known FEM model is that<br />
developed by Kleiven and Hardy in 2002, where a parameterized FEM of the adult<br />
human head including the scalp, skull, brain, meninges, 11 pairs of parasagittal
idging veins and other features was constructed. Material properties include<br />
viscoelastic, elastic and plastic behavior, while dissipative effects are also taken into<br />
account [12, 22]. A number of other models exist that use FEM for the skull/brain,<br />
namely models by Kang et al. (1997), Takhounts and Eppinger (2003) and Kimpara et al.<br />
(2006) [23].<br />
2.3 Blast Mitigation Strategies<br />
Efforts directed toward the better understanding of the underlying causes,<br />
symptoms and injury patterns of blast induced TBI is only one aspect of the research<br />
that is being currently undertaken by the scientific community. important Another leg<br />
of this effort is the simultaneous development of blast mitigation strategies that focus<br />
on attenuating the effects of the incoming blast wave. In a large percentage of the<br />
studies concerning blast mitigation, substantial efforts have been aimed toward taking<br />
advantage of the mechanical properties of the considered materials. When an incoming<br />
wave encounters an interface between two materials of different acoustic impedance, a<br />
percentage of the incoming energy reflects back into the original medium of<br />
propagation while remaining the transmits into the other medium. The intensity and<br />
angle of the reflected and transmitted waves depend on the impedance mismatch of the<br />
material interface and the incidence angle. The acoustic impedance of a material is<br />
dependent on the density and the speed of sound through that medium. Therefore,<br />
many studies focus on selecting materials with beneficial material properties and<br />
placing them such in a manner as to fully take advantage of the acoustic impedance<br />
mismatches between their interfaces, ultimately attenuating the strength of the<br />
incoming wave. blast There are numerous scientific reports on the issue of blast<br />
mitigation both computational and experimental. In this paragraph we will note some<br />
of the blast mitigation work that has recently been undergone.
Xue and Hutchinson [24, 25] proposed a new protection concept that utilizes light<br />
sandwich constructions. This concept is based on the fluid structure interaction effect<br />
that was initially proposed by G.I. Taylor. Taylor's result states that lighter structures<br />
acquire less momentum than heavier structures when exposed to the same blast. The<br />
reduction in transmitted impulse can be utilized by the light weight face sheets of<br />
sandwich panels. However, there are other studies that support that the impulsive<br />
loading of sandwich structures leads to an underestimation of the transmitted impulse<br />
and overestimation of the benefits offered by these materials (Desphande et al. and<br />
Rabczuk et al. [26]). Studies from J. Main and G. Gazonas [27] focus on increasing the<br />
mass fraction of the front face of the sandwich materials. Even though this strategy<br />
increases the impulse required for the complete crushing of the core material, it also<br />
undesirably increases the back face accelerations.<br />
Zhuang et al. [28] studied scattering effects of stress waves in layered composite<br />
materials. Periodically layered composites were subject to blast waves. The results<br />
showed that due to interface/microstructure scattering the layered composites exhibit a<br />
larger shock viscosity and shock wave propagation is much slower than in either of its<br />
stand-alone components.<br />
A study by Pfannes et al. [29] examined the use of tapered granular chains order in<br />
to absorb the energy from impulse loading. The study considers a linear alignment of<br />
spheres that are barely in contact and where the grains progressively shrink in radius.<br />
Under these circumstances wave propagation behavior changes dramatically. By<br />
applying the impulse loading to the largest sphere at the end of the chain, given<br />
momentum conservation, the smallest sphere at the other end of the chain will obtain<br />
higher velocity but lower kinetic energy. Therefore, due to conservation of momentum<br />
and geometric nonlinearity the energy of the incoming wave breaks up into smaller<br />
"energy bundles".<br />
Other studies focus on the development of systems that confine the blast or erect a<br />
barrier in front of the shock wave. D. Schwer and K. Kailasanath [30], use barriers-<br />
shields of water mist order in to attenuate incoming blast waves. Sub 50 micron water
droplets were shown to mitigate the shock front through momentum extraction rather<br />
than vaporization. The study also concludes that droplet size plays a secondary role to<br />
mitigation effects compared to mass loading. The total amount of water between the<br />
explosives and the observer was proven to be the most significant factor. Gel'fand et al.<br />
[31] have taken another approach. They have studied the confinement of the explosives<br />
in liquid filled elastic shells. This approach leads to an increase of the compressibility of<br />
the medium which transfers the energy of the explosion products to the air and<br />
contributes to a significant decrease in air blast amplitude at a reduced distance. The<br />
main parameter to take into consideration, study concludes, the is the ratio of the mass<br />
of the fluid to the mass of the explosive rather than density and viscosity of the liquid.
3 Fundamentals of Blast Wave Mechanics<br />
The understanding of blast wave propagation through different media is of utmost<br />
importance in both numerical and experimental aspects of this research effort. The<br />
propagation of a blast wave through media with different acoustic impedances will<br />
result in a proportion of the incoming energy being reflected at the material interfaces,<br />
potentially absorbed by the materials in the form of residual stresses or temperature<br />
increase, while only the remaining proportion will be transmitted. This is the key<br />
feature in most blast mitigation strategies.<br />
3.1 Blast Wavefront Profile and Parameters<br />
Basic concepts regarding blast waves, such as formation techniques, blast profiles,<br />
scaling and physical parameters will be presented in this paragraph.<br />
3.1.1 Introduction to Explosive Driven Blast Waves<br />
The main focus of this research project is the mitigation of explosive driven blast<br />
waves. The term blast wave refers to the pressure wave of finite amplitude which is<br />
generated by a rapid release of energy. Even though explosive driven blast waves can<br />
be generated by a number of sources, as nuclear such explosions or the muzzle blast<br />
from a gun, this research effort will primarily concentrate on waves created by the<br />
chemical reaction of explosive materials.<br />
When an explosive is undergoing decomposition by burning, the reaction is<br />
proceeding at or just above surface the of the solid material layer by layer as each is
ought to the ignition temperature of the material. This is achieved by the transfer of<br />
heat into the solid material form the reaction zone. The result of this accelerating flame<br />
front could be a burning velocity in excess of the speed of sound in the material and the<br />
development of detonation [7]. Regardless of the source of the initial finite pressure<br />
disturbance, the properties of air as a compressible gas will cause the front of this<br />
disturbance to steepen as it passes through the air until is exhibits nearly discontinuous<br />
increase in pressure, density and temperature [32]. The resulting shock front moves<br />
with supersonic velocity relative to the air medium in front of it. The air particles are<br />
also accelerated by the passage of the shock front, producing a net particle velocity in<br />
the travel direction of the front [32].<br />
These characteristics of blast waves differ substantially form acoustic waves, which<br />
involve only infinitesimal pressure changes, produce no change particle in velocity,<br />
move subsonically and therefore do not build up into a shock front. Acoustic waves can<br />
be handled up to some adequate extent with linear theory, while blast waves cannot<br />
[32].<br />
3.1.2 Blast Wave Profiles<br />
This paragraph introduces the reader to typical blast wave profiles and characteristic<br />
quantities that are conventionally used in order to model and define shock. For this<br />
purpose, let us consider the ideal blast wave formed in air by an explosion. It is<br />
assumed that the explosion occurred in a still, homogenous atmosphere and that the<br />
source is spherically symmetric so that the characteristics of the blast wave are only<br />
functions of the distance from the center of the source r and time t. By taking into<br />
account these assumptions the profile of an ideal blast wave is shown in Figure 3.1-1.<br />
After the arrival of the shock front at time ta, the pressure rises abruptly,<br />
discontinuously in an ideal wave to a peak value of P,+ + po, where po is the ambient<br />
pressure. The pressure then decays to ambient pressure after a period of T+ followed by
an underpressure of absolute magnitude po - P,-. Finally, a total after time of ta+T++T- it<br />
returns to ambient pressure. The quantity Ps+ is usually termed overpressure. peak Two<br />
major phases in the pressure - time history are evident. The portion of the time history<br />
with positive overpressure is named positive of phase, duration T+, while the portion<br />
below ambient pressure is the negative with phase amplitude P,- and duration T-. At<br />
this point, it should be noted that in accordance with the majority of literature on the<br />
issue of blast wave mechanics, any quantity that is denoted with a plus sign superscript<br />
will refer to the positive phase while a minus sign will refer to the negative phase.<br />
UJ<br />
Cx<br />
0<br />
0 ta t++t++T<br />
TIME<br />
Figure 3.1-1: Ideal blast wave [35]<br />
0ta+a++taT+T<br />
Positive and negative impulses are define by:<br />
is * = (p (t) -p,, )dt<br />
is= J(Po - P(t))dt<br />
ta+T'<br />
POSITIVE PHASE<br />
PHS<br />
Equation 3.1-1
To describe completely the characteristics of the pressure-time history of the ideal<br />
blast wave, one should specify its form as a function of time. A number of different<br />
authors have recommended or used functional forms by empirical fitting to measured<br />
or theoretically predicted time histories. Primary emphasis has been given to fitting the<br />
positive phase of the blast because of the significantly higher achieved peak pressure as<br />
compared to the negative phase.<br />
The simplest of these functions involves only two parameters, P,+ and T' and<br />
assumes a linear decay of pressure (Flynn 1950) [32]:<br />
pAt) = p" + P+ 1 - t), 0 < t T+ Equation 3.1-2<br />
where t is now the time after the shock arrival. In fitting this form to data, the true value<br />
of the peak overpressure P,* is usually preserved and the positive phase duration T* is<br />
adjusted to maintain true positive impulse I*. One could also adjust the duration to<br />
match the initial decay rate with experiment; however, this would underestimate the<br />
positive impulse. This form, admittedly oversimplified, is often adequate for response<br />
calculations.<br />
Ethridge (1965) has shown that the following form will accurately fit many gage<br />
records over most of the positive phase (where t is time measured after arrival time):<br />
p(t) = p0 + P *e~" Equation 3.1-3<br />
With this form one can match the amplitude P,* and the initial decay rate with<br />
experimental results or the amplitude and positive impulse.<br />
The following proposed functional forms include more parameters thus allowing<br />
more flexibility in matching blast wave parameters. One of the most commonly used<br />
expressions is a three parameter function termed the Friedlander equation [32, 33]:
p(t) = p0 + P+ 1 - j+ e-btT+<br />
The additional parameter b, allows freedom in matching any three of the four blast<br />
characteristics P*, I+ , T* and initial decay rate d dt ,=<br />
Ethridge proposed a four parameter in equation order to capture the observed<br />
decrease of rate of exponential decay over time.<br />
p(t)= p, + P" * 1 e-b(Ift/ T- T' Equation 3.1-5<br />
Where b and f are parameters determined from experimental data fitting.<br />
Finally, one of the most complex formulas proposed to capture the positive-phase<br />
history has been proposed by Bode (1956) and involves five parameters:<br />
p(t) = p0 + P - -j [ae-IT + a -f'' Equation 3.1-6<br />
Where a and P are parameters determined from experimental data fitting.<br />
However, as previously mentioned, these developed formulas are only able to<br />
capture the positive phase of the blast wave. The characteristics of the negative phase of<br />
the pressure-time have history been almost totally ignored, since most investigators<br />
often considered them to be relatively unimportant compared to the positive phase or<br />
due to experienced difficulties in accurately measuring and computing its<br />
characteristics [32]. Bode (1955) proposed the following formula for the modeling of the<br />
negative phase:<br />
E quation 3.1-4
p(t)= p, -P~(t / T-)(1-t T-j)e 4 t T Equation 3.1-7<br />
In this formula the time is measured from the start of the negative phase ta+T+.<br />
As previously mentioned, in its passage through the air, the blast front increases not<br />
only the pressure but also the density, the temperature and it accelerates the air<br />
particles to produce a particle velocity u in the direction of the travel. J. Dewey (1964)<br />
has proposed an empirical equation to fit time histories of particle velocity for blast<br />
waves generated by TNT explosions. This equation involves four parameters [33]:<br />
u(t) = u,(1- pt)e~ + a ln(1+ pit) Equation 3.1-8<br />
where u,: peak particle velocity immediately behind shock front<br />
a and P: parameters to be determined through experimental fitting<br />
The ideal blast wave of Figure 3.1-1 exhibits only one shock, the primary shock.<br />
However, for any finite explosion source, the ideal blast wave can also exhibit<br />
numerous repeated shocks of small amplitude at time instances after ta. Theses shocks<br />
are created by the successive implosion of rarefaction waves from the contact surface<br />
between explosion products and air. Secondary and tertiary shocks of this nature, also<br />
called "pete" and "repete", have been observed and can be seen in the following Figure<br />
3.1-2. These waves have little effect on the characteristics of the positive phase of the<br />
blast wave with the exception of the positive duration T+, except if a secondary wave<br />
happens to arrive just before the initial decay reaches ambient pressure. On the other<br />
hand, repeated shocks can strongly affect the negative phase, abruptly terminating it or<br />
sharply reducing the negative impulse I or amplitude P, [32].
SECONDARY SHOCKS<br />
TERTIARY<br />
SHOCK<br />
Figure 3.1-2: Recorded pressure time histories of actual blast waves [32]<br />
Quite often, the characteristics of air blast waves are more complicated and more<br />
difficult to analyze than the features previously mentioned. If the blast source is of low<br />
specific energy content, as such relatively a low-pressure mass of expanding gas, then<br />
the finite pressure pulse generated in the surrounding air may progress some distance<br />
before "shocking up" [32]. If the blast source is a cased explosive charge, recorded time<br />
histories of pressure may have large amounts of disturbances and pressure fluctuations<br />
superimposed on the primary pressure variation of the blast wave. These disturbances<br />
are the ballistic shocks generated by fragments of the casing moving at supersonic<br />
speed through the air. The fragment velocity decay rate is slower than that of the blast<br />
front, therefore they outrun the shock front for some time and produce disturbances<br />
before the blast wave arrival. However, the long in run the blast front catches up with<br />
the fragments are which decelerated due to drag forces [32]. This effect is illustrated in<br />
the following 3.1-3.<br />
Figure
R -30 ft<br />
R -38 ft<br />
L MILLISECOND TIME MARKS<br />
FRAGMENT R -52ft REFLECTION FROM<br />
SHOCKPRIMARY TARGET<br />
PATTERNS<br />
3.2 Air Blast Theory<br />
Figure 3.1-3: Pressure time curves produced from a cased charge [35]<br />
In this paragraph, the equations governing the transmission of blast waves through<br />
air are presented. As mentioned earlier, acoustic theory is inadequate to describe air<br />
blasts. Shock wave fronts are considered as a discontinuity in pressure (Figure 3.1-1),<br />
density and temperature and travel with supersonic velocities relative to the air in front<br />
of them.<br />
In order to derive the basic equations that describe propagation of a normal shock<br />
wave, firstly formulated by Hugoniot (1887), the equations of mass, momentum and<br />
energy conservation in their integral form will be employed [34]:<br />
d fPdV + -P ndS = 0<br />
V d S<br />
Equation 3.2-1<br />
df fpiidV +Jfpii(2ii fi)dS=-fpidS Equation 3.2-2<br />
dV S S
p e+- dV +Jp e+ ii -nidS =- pii -idS<br />
dt V 2 ) s( 2)<br />
Equation 3.2-3<br />
where a volume V with surface S is assumed to be fixed in space, and ,i is the normal<br />
vector on a portion dS of the surface S<br />
The above governing equations that no body assume forces are acting on the fluid<br />
particles and no heat transfer or radiation is taking place. These assumptions are valid<br />
since none of these effects are known to play a crucial role in blast wave propagation<br />
[32].<br />
We will consider a normal shock as the one shown in Figure 3.2-1. The shock is<br />
propagating (left illustration) with a velocity of Us into a uniform stream with fluid<br />
particle velocity ul, while the particle velocity behind it is u2. A more convenient way to<br />
handle this phenomenon is to consider the right image of Figure 3.2-1, where a<br />
reference moving frame with Us velocity is considered. Consequently, the velocities in<br />
front and behind the shock front are now U1=u1+Us and U2=u2+Us respectively.<br />
u10<br />
Us<br />
(A)<br />
Moving Shock<br />
U2<br />
Figure 3.2-1: Moving and stationary shock wave [26]<br />
U 1=u 1 + Us U 2=u 2 + Us<br />
(B)<br />
Stationary Shock
By applying the equations of mass, momentum and energy conservation in integral<br />
form to a control volume that includes the shock discontinuity we derive the following<br />
equations [26, 32]:<br />
UIp = U 2P 2<br />
p + p1U2 = p 2 +)p2U<br />
e, +P + U 1 2 = e2 + + U<br />
p, 2 p 2 2<br />
Equation 3.2-4<br />
Equation 3.2-5<br />
Equation 3.2-6<br />
where subscripts 1 and 2 denote the flow quantities in front and behind the shock front<br />
respectively.<br />
The equation of state for ideal gas will be used in order to close the system of equations:<br />
where T: absolute temperature<br />
R: gas constant [J Kg-1 K-1]<br />
p = pRT Equation 3.2-7<br />
Additionally, the internal energy is related to the temperature through the specific heat<br />
for constant volume parameter Cv.<br />
e = CVT Equation 3.2-8<br />
The following Equation 3.2-9 derived from thermodynamics is applicable for a<br />
calorically and thermally perfect gas [34]<br />
RI/C, =7y-l<br />
Equation 3.2-9
where y: ratio of specific heats air, (for the value y = 1.4 can be used for the range of<br />
temperatures of interest)<br />
By using Equations 3.2-7, and 3.2-8 3.2-9, the following equation is derived, which is<br />
used as the equation of state for ideal gas instead of Equation 3.2-7 thus closing the<br />
system of equations:<br />
e = -P I -> e - P<br />
p RIC, -1 p<br />
By introducing the Mach number [34]:<br />
U<br />
M =- Equa tion 3.2-11<br />
a<br />
where a is the speed of sound in ideal gas given by<br />
a 2 __<br />
ap<br />
_ yRT = y -<br />
Equation 3.2-10<br />
Equation 3.2-12<br />
The energy equation (Equation 3.2-6) can be written in terms of the Mach number as<br />
a, 21+ LM a2 1+ 21MM 2 Equation 3.2-13<br />
After some algebraic manipulations, the following set of equations with the ratios of the<br />
physical parameters that are of interest to us are calculated:
T 2 e 2 =[+ 2y (M2 _1 2+(y-1)M1<br />
T, e, _ +1 1 (y+1)M<br />
- U (y +1)M<br />
p1 U 2 2+( y-)M 2<br />
- =1+ 27 (M 21)<br />
p y+1<br />
Equation 3.2-14<br />
Equation 3.2-15<br />
Equation 3.2-16<br />
These equations are called shock jump or Rankine - Hugoniot relationships of the flow<br />
quantities across a normal shock wave [26]. However, it is usually useful to express<br />
these equations in terms of the peak overpressure ps=p2-p1 eliminating the Mach<br />
number Mi. Therefore, the speed of the shock front Us in still air where ui=O is<br />
U, =am =2sp + y<br />
While the particle velocity us behind the shock front is<br />
us =-u - 2 = PS I I<br />
p1 P y +1 p,<br />
2 p1<br />
Finally the jump relationship for the density is given by<br />
P 2 2y +(Y +1)p, / p,<br />
p 2/ +y( -lp, / p,<br />
Equation 3.2-17<br />
Equation 3.2-18<br />
Equation 3.2-19<br />
This equation implies that the density ratio across a shock wave travelling in an<br />
ideal gas is finite regardless of the shock strength. Even for the strongest shock, the<br />
maximum value of the density ratio is max(p2/p1) = 6. This result is another feature of<br />
the hypersonic Mach number independence principal [34] which refers to certain
V-<br />
aspects of the flow that are independent of the Mach number Mi when this is<br />
sufficiently high. Specifically, the hypersonic Mach number independence states that as<br />
the freestream Mach number approaches infinity, the pressure ratio (Equation 3.2-16)<br />
4<br />
itself becomes infinitely large. However, the pressure coefficient C, _,, > and<br />
y+1<br />
the density ratio maintain a constant value at values of Mach number [34].<br />
The three previous equations are plotted in the following two figures in order to<br />
graphically illustrate their trends. The shock wave is advancing through air at T1=200C<br />
with a density of p1=1. 2 0 4 kg/m 3 , p1=1.01325 105 Pa and y=1.4. Shock U, and particle<br />
velocity us are plotted in Figure 3.2-2 and the density ratio is plotted in Figure 3.2-3.<br />
I I I 1 || I I I I I I I I I I1I 1 I - -<br />
I I I 11111 I I I I I lii t 1111Shock V60ty,~<br />
I 1 I - T - I r .<br />
I I 1 J I I L I<br />
I 1 - -J1<br />
I I I I114 I 1<br />
I I I I I II I<br />
I I i i I I 111 141i I I | 11111<br />
I I I I I I I I I I I I I I I I<br />
I I i I I l ii ii I | 111 1i1 I I I 111111 I I l<br />
I - -T-4-14-I -I -4 -1-l~- T-4-l-----I- - -I~ 4l -T -- ~- -1 T T 1 1I I ~<br />
1I I 111111 I I I 11i i11 4 I I 1111111 ii I i/j i<br />
I I I<br />
I I I 11 1 1 1 1 1 1 i i I I I I I i i1 I I I i I i 1<br />
- -l 4 -1 I- - L - r- AJ+L l - -- -- - - l I - -4 -M - - - -r 4 T +j- T l - - | -i- i -r L-LL1 rF -1- -- -. -I -T - + -t -4 -F L LL<br />
I I I - 1 T I T r: - - - - - T T 1 - T T ll<br />
1 I I I I I I 1 I I I 1111 I I I I 11 i I I i | 1 1 1<br />
S iiiI I III I 11 41 I I 11 1 I I I 11 I i I | .411 A<br />
I Ii I I i 11||1 I I I 1 1 1 I I 111 I I I )1<br />
II I I I 11111 I I I I I<br />
I I I 114111I I I I 1 i11 i Ii I I I | |1111 I I I 111iIli1<br />
I ______ I I I 1 I1I41 I I I I 111111 i I I II I I 111 I 11 I I I I I I 1/11 I i I I _<br />
I I I I11 i 11 4 ) I I111141 i I I I I| 11 11 4i I 11111<br />
I I I 1 1 I I I I 111111 || I I 1 I1111 ,I i 1 I1 |<br />
I I 1 11 | 11 i I I I I11141 I I I 111111I i i I I 1 11<br />
I _ 1_ _1 1 1 1 1|_ _ _ _i 1 I _ I i i I__1_ _I I _ I _ 1 11_ _ J _ l _I' I I |_ 1 _1 _<br />
I I FI I ii i I l 1 F 1TFI - - - - -i FFTi Fl 7'1 T I IFiFi<br />
1 1 1 1 1 1 1 I 1 I I 1 111 I Ii I I i I , I f I I I i<br />
I I I i 1 1 i 1 I I I 1 1I1 1I 1 i I I I I I i , I I I 1 1<br />
I I 111111 I I 11 I 11 I . . I i I I. I I j I I 11111i<br />
I I I 1 11I || I I i I 11 1 I| | l I IllI ll I I I 1 11I i<br />
l I i I I1 1 I I i I i ii i I . i 11 1 1 I i1 I<br />
I I 1 1 1 I I I i 1 111 i iI I i l.1 1 I I 11 1<br />
I I I 1111iI I1 I I I I I 1 I 1 4 I_--' I I 1,1'l 11 I I I I 1 11<br />
I IlI~ llI II 1I1I1I1<br />
I I I 11 i I111 I I .I.. i . i11 .I ' I I 11111 I iI 11 1<br />
02 10' 10, 10<br />
Figure 3.2-2: Shock and particle velocity versus ps/pi pressure ratio<br />
'A
5.5<br />
4.5<br />
4<br />
35<br />
3<br />
I I -I I J I _L1 1 L I- - -II -i- J I _ I II i -i I | _<br />
- - - -<br />
L-ILI<br />
i~~~~ T i T i 1<br />
I I I1111 i1 I I I i i i i<br />
I ITI11 1I 1111 i I I I I I I 11I Ii ti I l | 1<br />
I I | |Ii l I I I I1 1 | |1<br />
- -t -- -H- S I -L I<br />
1 1 1 111 1 1l 1 1<br />
I I I Iliii | I I 11 1 1<br />
1 1 1 I T |1 I I I1 T 1 T I|<br />
III111 1 I I I I | I<br />
i i<br />
i | l Ii I 1 I 1 II1I1<br />
I I I Ii I | i 1 ~ I I I I - ii<br />
| I | L I LLi- I _ I I L I<br />
I 1 1111 1 I1 | |ii<br />
1 I I 111I 1 i |I<br />
ii J-<br />
I I I I I I I ill<br />
I I I I I . I I 1<br />
| I I 111 I I I 1 11I<br />
7 |i<br />
.A AL-LILi I I -I- L LI L<br />
I r |I1i t i | I<br />
2.5 -- -t - - IIII I 1 - 1 - - -tI- I I I11I I 111I<br />
2<br />
- - ---- -<br />
I I | | 11<br />
I I I I11 1<br />
I I I |1111 I<br />
- t -i<br />
I<br />
I<br />
1<br />
I |11 |1 l11<br />
I I 11111I I<br />
I 1| 1 1 I ---<br />
II<br />
lii<br />
T I<br />
Ii l lii IIi I<br />
i Iiii 1<br />
V -iI I I<br />
Ii i Iii<br />
I i I<br />
iI<br />
T T<br />
iIi<br />
F FI<br />
i ili<br />
i L-iI<br />
1.5<br />
3.3 Blast Scaling<br />
Figure 3.2-3: Density ratio versus ps/pi pressure ratio<br />
I i I I i I I IIi<br />
Experimental studies of blast wave phenomenology are often quite difficult and<br />
expensive, particularly when conducted on a large scale. Therefore, many researchers<br />
have attempted to generate model and scaling laws in order to widen the applicability<br />
of their experiments. The goal is to simulate large scale experiments with accurately<br />
controlled small scale laboratory experiments by appropriately adjusting the distance<br />
between the shock source and target or the energy released during the explosion.<br />
The most common of scaling form is the Hopkinson or "cube-root" scaling,<br />
formulated by Hopkinson 1915. Quoting in Baker [32] this rule states that "self similar<br />
blast waves are produced at identical scaled distances when two explosive charges of<br />
similar geometry and the same explosive, but of different size are detonated in the same
atmosphere". We will frequently be using the following dimensional scaled distance<br />
parameter [7, 32]:<br />
where R: distance from center of explosive<br />
R R<br />
Z = or Z = Equation 3.3-1<br />
w"13<br />
E"13<br />
W: charge mass expressed in kilograms of TNT<br />
E: energy of explosive (proportional to W)<br />
During blast scale operations the actual mass of the charge is converted into a TNT<br />
equivalent mass. The simplest way of achieving this is to multiply the mass of explosive<br />
by a conversion factor based on the ratio of the explosives specific energy over that of<br />
TNT. Conversion factors for a range of explosives are shown in the following Table<br />
3.3-1 [7, 35]. Another form to determine the equivalent TNT mass (Wmrr) is through the<br />
detonation velocity D [m/s] of the used explosive and the following formula [36],<br />
where STNT is the conversion factor and Wexpisoive the mass of the used explosive:<br />
WTNT =STNT eWxplosive = D- Wexv Equation 3.3-2<br />
48.3
Explosive Mass Specific energy TNT Equivalent<br />
Qx(kJ/kg) (Q./QTNr)<br />
Amatol 80/20 (80% ammonium nitrate 2650 0.586<br />
20% TNT)<br />
Compound B (60% RDX, 40% TNT) 5190 1.148<br />
RDX (Cyclonite) 5360 1.185<br />
HMX 5680 1.256<br />
Lead azide 1540 0.340<br />
Mercury fulminate 1790 0.395<br />
Nitroglycerin (liquid) 6700 1.481<br />
PETN 5800 1.282<br />
Pentolite 50/50 (50% PETN 50% TNT) 5110 1.129<br />
Tetryl 4520 1.000<br />
TNT 4520 1.000<br />
Torpex (42% RDX, 40% TNT, 18% 7540 1.667<br />
Aluminium)<br />
Blasting gelatin (91% nitroglycerin, 4520 1.000<br />
7.9% nitrocellulose, 0.9% antacid,<br />
0.2% water)<br />
600% Nitroglycerin dynamite 2710 0.600<br />
Table 3.3-1: Mass specific energy and TNT conversion factors for various explosives [7]<br />
The implications of Hopkinson scaling are clearly represented in Figure 3.3-1. An<br />
observer located at a distance R form the center of an explosive source of characteristic<br />
dimension will be subjected to a blast wave of amplitude P, duration T and a<br />
characteristic time history. The positive impulse is I, while the time of arrival is ta. The<br />
Hopkinson scaling law states that the observer at a distance KR from the center of a<br />
similar explosive of dimension Kd detonated in the same atmosphere will feel a blast<br />
wave of similar form, same amplitude P, duration KT and impulse KI. All characteristic<br />
times, such as the arrival time, are scaled by the same factor K.
-I<br />
R -'<br />
KR<br />
Ta<br />
Figure 3.3-1: Hopkinson blast scaling law [32]<br />
By applying such a scaling, all pressures and velocities (shock front U and particle u<br />
velocity) remain unchanged at homologous times. Ranges at which a given<br />
overpressure is produced can be calculated using the following formula, proof of which<br />
can be obtained through Baker [7, 32].<br />
RI _ Equation 3.3-3<br />
R2 (W2<br />
The first scaling law for air blasts produced from point source explosions was<br />
proposed by Sir Geoffrey Taylor [37, 38]. Taylor theoretically examined the similarity<br />
laws governing the propagation of high magnitude shock waves in air, namely the<br />
detonation of atomic bombs, Equations 3.3-4 and 3.3-5. Von Neumann extended the<br />
Taylor's scaling laws and found the exact similarity solution to the point source<br />
explosion problem suggested by Equations 3.3-4 and 3.3-5 [39, 26].
where y: ratio of specific heat for air<br />
R = CR (Y) t2E1/5 Equation 3.3-4<br />
p, )<br />
E<br />
p, = C () - -- Equation 3.3-5<br />
CR0') and C, (y): constants depending only on the properties of the medium<br />
R: distance between source of explosion and wave front<br />
t: time from explosion<br />
E: energy released during explosion<br />
Sachs (1944) proposed a more general blast scaling model in an attempt to account<br />
for the effects of altitude or other changes on ambient conditions on air blast waves.<br />
Sach's scaling law states that dimensionless groups can be formed that involve<br />
pressure, time, impulse and certain parameters for the ambient air and that these<br />
groups are unique functions of a dimensionless distance parameter. Specifically, the<br />
following groups are stated to be unique functions of (R = Rp)'' 3 /F") [7, 32]<br />
P - p - I -a O t -a Op O /<br />
P = -, = El" 3 P 3 ' El'<br />
Kinney and Graham [36] have proposed another scaling rule based on the previous<br />
scaling rules of Hopkinson and Sachs. Two explosions can be expected to give identical<br />
blast waves at distances which are proportional to the cube root of the respected energy<br />
release. That is, to produce a given blast at twice the distance requires eight times the<br />
explosive energy release. However, the nature of the medium also must be considered.<br />
The density of the atmosphere may be taken as a measure of the mass of air through
which the explosive blast has propagated. Therefore, the atmospheric transmission<br />
factors for distance fd and time ft are introduced as:<br />
fd 1/3 C 1/3<br />
where p: atmospheric density<br />
.r)1/3<br />
.3 112 T 1/3 1/6 Equation 3.3-6<br />
pt-e- T P (T<br />
PO T" P T<br />
po: density of a reference atmosphere<br />
P: atmospheric pressure (absolute)<br />
Po: pressure for the reference atmosphere (absolute)<br />
T: atmospheric temperature<br />
To: temperature at a reference atmosphere<br />
Using the atmospheric transmission factor for distance the scaled distance is measured<br />
by:<br />
A similar formula with Equation 3.3-1<br />
The peak overpressure is then calculated by:<br />
Equation 3.3-7<br />
P<br />
P, = overpressure _ratio x atmospheric _ pressure = - P<br />
P<br />
where the overpressure ratio is given as a function of the<br />
empirical formula [36]:<br />
Z= fd -R<br />
w 1'3<br />
Equation 3.3-8<br />
scaled distance by an
PS<br />
a<br />
808 1+<br />
4.5)<br />
Z 2Z<br />
1+ - 1+ 2Z Z3 1<br />
0.048 031.35<br />
2<br />
Equation 3.3-9<br />
Finally, the positive pulse duration scales according to the following formula [36]:<br />
tdsae = t X-Lt<br />
d,scaled d,actual x - 3 Equation 3.3-10<br />
3.4 Blast Wave Interactions<br />
When waves blast encounter a solid surface an object or of different density than<br />
that through which the is propagating, wave they will reflect from it and depending on<br />
its size and geometry diffract through it. During the reflection whole surface the be will<br />
instantly subject to the reflected overpressure. This paragraph will summarize the main<br />
results from studies investigating the interactions of shock waves with solid structures.<br />
3.4.1 Air Blast Impact on Fixed, Rigid Boundaries<br />
The simplest case the is reflection of a planar wave when impinging on an infinitely<br />
large rigid wall at angle zero of incidence. In this case, the incident blast wavefront,<br />
travelling at velocity Us through the ambient air, undergoes reflection when the<br />
forward molecules comprising the blast wave are brought to a standstill and further<br />
compressed inducing a reflected overpressure on the wall of higher magnitude than the<br />
incident wave [7, 36]. The reflected peak overpressure pr for zero incidence can be
expressed as a function of the peak overpressure of the incoming wave, ps and the<br />
dynamic pressure qs by the following:<br />
where<br />
Pr = 2p, +(y+1I)q,<br />
q 3 21'<br />
1 2<br />
Equation 3.4-1<br />
Equation 3.4-2<br />
Is the dynamic pressure with ps and us, the air density and the particle velocity<br />
behind the wavefront respectively. It can be shown that the reflected coefficient CR,<br />
defined as the ratio of pr to ps, takes the following form for air [7]:<br />
CR ME, = 2 7 po + 4ps<br />
P,<br />
7 p, + ps<br />
Equation 3.4-3<br />
Inspection of this equation, based on the Rankine-Hugoniot relationships, indicates<br />
that an upper and lower limit exist for the reflection coefficient CR. When the<br />
overpressure of the incoming wave is of very large magnitude such that p/po >> 1 the<br />
reflection coefficient takes a limiting value of CR= 8 . In the opposite case, when the<br />
incoming wave is very weak ps/po
3.4.2 Fluid-Structure Interaction the Acoustic in Range<br />
The previous analysis considers the reflection of planar waves from rigid walls<br />
while accounting for gas nonlinear compressibility. Taylor's analysis, on the hand, other<br />
focuses on the coupled fluid and structure dynamics in the acoustic range neglecting<br />
the gas nonlinear compressibility. Taylor considers the one dimensional interaction of a<br />
linear wave of form p(t) = p,e~'"' (where ti is the decay period) with a plate of density<br />
pp and thickness hp. Taylor introduces the following nondimensional term P., which<br />
captures the relative duration of the incident and blast the FSI wave [40].<br />
and<br />
t.<br />
to<br />
. ph<br />
p0 a0<br />
Equation 3.4-4<br />
Equation 3.4-5<br />
where to* represents the characteristic time of the FSI and a, the sound speed.<br />
Physically, P. may also be interpreted as the relative inertia of the volume of<br />
compressed gas phf = pa, t, and the plate pph,, therefore:<br />
=<br />
a ,t',<br />
Pp h,<br />
Equation 3.4-6<br />
Finally, the transferred impulse per unit area of the plate Ip is given by the following<br />
ratio in respect to the impulse per unit area of the incoming blast Ii:<br />
I A_<br />
- = 2p3-<br />
I.<br />
Equation 3.4-7
The subsequent motion of the plate is characterized by the decrease of the pressure<br />
acting on it, pp. At some point due to the motion of the plate, the pp on the plate drops<br />
below ambient pressure. The role of the FSI is clearly illustrated by the parameter Po in<br />
Equation 3.4-7. For relatively heavy plates, Po3 takes a small value and the impulse<br />
experienced by the plate is twice the incoming, as would be the case for a linear wave<br />
reflecting off a rigid wall discussed earlier in this paragraph. As the plate becomes<br />
lighter, the plate accelerates faster due to the pressure load and the reflected pressure<br />
decreases. In the limiting case where pto-+oo, the reflected impulse goes to zero.<br />
3.4.3 Fluid-Structure Interaction with Nonlinear Gas Compressibility<br />
Kambouchev et al. [40] determined an expression that takes into account both<br />
nonlinear compressibility and FSI. The derived formula captures Taylor's results for<br />
extremely light and heavy plates and proposes a formula for finite mass plates. The<br />
ratio of experienced plate Ip to incoming wave impulse per unit area Ii is given by:<br />
I CfR '+A A<br />
- y ( R Rs<br />
Equation 3.4-8<br />
where the coefficients in the previous equation are calculated by the following<br />
fR=(6p'±7<br />
YR =8-42 * In 1+ P1<br />
Ps ( 7 P,,<br />
(6+CR)P' +7<br />
P11<br />
P11 P' +7 (1+6CR )Ps + CR Ps +7]<br />
(KPI, ) P11 J[ KPO)<br />
Equation 3.4-9<br />
Equation 3.4-10
ps =<br />
p, = tipA Us Equation 3.4-11<br />
7 p +6p Equation 3.4-12<br />
07p., + p,<br />
The derivation of the following equations can be found in [40] with numerical<br />
results validating their reasonable agreement with experimental data.<br />
3.4.4 Non Zero Incident Wave Reflection<br />
To this point, the analysis has focused normal on reflection with zero incidence<br />
angle. When the incidence ai between angle the shock and the boundary lies between 00<br />
and 900, two types of reflection can occur; regular or Mach reflection. For a given value<br />
of reflected pressure pr, there is a critical value of the incidence aicrit, such angle that<br />
when the incidence angle is smaller than the critical value ai < aicrit normal reflection<br />
occurs [7, 41]. Ordinarily, angle of the reflection ar during normal reflection is not equal<br />
to the incidence angle [36].<br />
Mach reflection when occurs the incidence angle of the shock is greater than the<br />
critical incidence angle ai > aicrit. Mach reflection is a complex process and is also<br />
referred to as a 'spurt'-type effect where the incident skims wave off the reflecting<br />
surface rather than bouncing as in the case normal of reflection. The result of Mach<br />
reflection, illustrated in Figure 3.4-1, is that the reflected wave catches up and fuses with<br />
the incident wave at some point above the reflecting to produce surface a third<br />
wavefront called the Mach stem. The point of coalescence of the three waves is termed<br />
the triple point. In the region behind the Mach stem and reflected wave a slipstream<br />
region exists, where different densities and particle velocities exist even though the
pressure is the same. The formation of the Mach stem is of importance when a<br />
conventional or nuclear device detonates at some height above ground the [7, 36, 41].<br />
Height<br />
P on ground<br />
(c)<br />
Regular<br />
reflection<br />
R I<br />
M<br />
Triple point<br />
Mach<br />
reflection<br />
Figure 3.4-1: a) Mach stem triple point formation; b) Mach stem and triple point development in respect<br />
to height of burst explosion; c) Pressure on ground vs. range [7]<br />
Path<br />
triple<br />
point<br />
Range
3.5 Constitutive Model of Materials under Shock Loading<br />
This chapter is devoted to the description of the constitutive used models to model<br />
materials under shock loading. Namely, the linear Hugoniot model and the Mie<br />
Grineisen Equation of State are presented.<br />
3.5.1 Linear Hugoniot Model<br />
The response of many solids and fluids under shock loading is well described by the<br />
linear Hugoniot empirical relation between shock Us and particle velocity UP [42].<br />
u,= C 0 +sU, Equation 3.5-1<br />
The constants C. and s are determined through experiments and the values of these<br />
parameters have been documented for a large range of materials.<br />
Through the application of conservation of mass and momentum a control in<br />
volume at the shock front and the use of Equation 3.5-1 the pressure can be calculated<br />
through the following formula as a function of the shock and particle velocity and the<br />
reference density of the material po.<br />
P 0 C 2 ( - F" ) Equation 3.5-2<br />
[1-s(1-F,)] 2<br />
where F is the deformation immediately gradient behind the shock front and given by<br />
the following equation in one dimensional shock wave propagation, u+ and p+ with the<br />
material velocity and density behind the shock front [42].
p v U<br />
. U U,<br />
Equation 3.5-3<br />
By substituting the two previous equations, the pressure is governed by:<br />
PH = p 0UU,<br />
Equation 3.5-4<br />
Equation 3.5-2 is also referred as the "Shock Hugoniot" and relates any final state of<br />
density to its corresponding pressure. A qualitative Hugoniot curve is depicted in the<br />
following diagram. The shock wave does not cause the material to move along the<br />
Hugoniot curve. Instead, the shock solution causes the material to jump from the point<br />
on the curve corresponding to the initial state to the final shocked state along a line in<br />
the P-p diagram called the Rayleigh line [42, 43].<br />
P<br />
(P ,V)<br />
(P;,v+)<br />
Figure 3.5-1: The Hugoniot curve (- -) and the Rayleigh line (...)
3.5.2 Mie Grineisen Equation of State<br />
The Mie Gruneisen of Equation State (EOS) is a constitutive model that relates the<br />
pressure internal and energy E of material a in reference to the final state of the<br />
Hugoniot (pH,EH) [42].<br />
P, = PH + pF(E - EH )<br />
Equation 3.5-5<br />
where F is the Grtineisen parameter obtained by the following expression where Fo and<br />
po is the Gruneisen coefficient and density respectively at the initial state:<br />
F=2F+0.5s( - F)<br />
The Hugoniot energy is given by:<br />
p<br />
1-_S2 (1- F)2 P<br />
E<br />
PH ( - F)<br />
EH=2po<br />
Equation 3.5-7<br />
Equation 3.5-6<br />
By combining Equation 3.5-5, 3.5-6 and 3.5-7, the final form of the Mie Grtineisen<br />
equation is:<br />
Pe =pL1 - "P+HF 1 p E Eui Equation 3.5 3.5-8
4 Materials - Material Testing and Modeling<br />
During the conception but also utilization phase of this research program, there<br />
have always been two elements associated with the design and effectiveness of the<br />
proposed new helmet liner approach. The combination of materials used in order to<br />
enhance blast wave attenuation and the internal geometry of the helmet liner. Focusing<br />
on the former of the two parameters, it is reasonable to say that a significant component<br />
of this research effort has been to determine the mechanical and blast attenuation<br />
properties of various materials that will be used in the construction, testing and<br />
modeling of our helmet liner. Materials include both the filler materials and the exterior<br />
foam for the testing samples.<br />
In this chapter, the mechanical properties of the materials that have been used in<br />
both numerical and experimental aspects will be described and presented. In the case of<br />
the DERTEX foam that was used, the material testing procedures and analysis that were<br />
conducted in order to determine the necessary properties will be presented in detail.<br />
4.1 Dertex VN 600 Foam<br />
The foam used during the blast experiments and later modeled in ABAQUS is the<br />
VN 600 foam acquired from DERTEX Corporation. This specific foam was selected<br />
because of its good energy absorbing characteristics that were determined during drop<br />
test experiments on flat foam samples as compared to other conventional foam types<br />
such as Expanded Polystyrene (EPS) and Polyurethane (PU) [5]. There was a significant<br />
reduction in measured peak accelerations and forces on head forms that were dropped<br />
on VN 600 foam compared to EPS and PU helmet liners.
The VN 600 is a closed cell foam based on a vinyl nitrile polymer (as given by the<br />
manufacturer). The material properties of the VN 600 foam that were provided to us by<br />
DERTEX Corporation are shown in the following table (Table 4.1-1).<br />
Polymer Vinyl Nitrile<br />
H~adnes<br />
(SHORE 00) 55-75<br />
(ASKER C) 35-55<br />
Density 0.095-0.12 g/cm 3<br />
Tensile Strength 10 kg/cm 2<br />
140 PSI<br />
Tear Strength 3.0 kg/cm<br />
Elongation 150% (MIN.)<br />
Comp. Deflection<br />
50% 19PSI (MIN.)<br />
25% 8.5 PSI (MIN.)<br />
Table 4.1-1: VN 600 foam properties<br />
However, these materials properties were not sufficient to model the dynamic and<br />
nonlinear behavior of the VN 600 foam in ABAQUS.
4.1.1 Modeling of VN 600 foam through Stress-Strain Curves<br />
The VN 600 foam was initially described and modeled using stress-strain curves. In<br />
order to obtain these curves, uniaxial and hydrostatic compression tests were conducted<br />
in the Materials and Soils Lab at MIT respectively. In this paragraph the experimental<br />
procedure, data analysis and scaling process that were followed in order to obtain these<br />
curves are presented.<br />
Uniaxial Testing of VN 600 Foam<br />
Since the dominant deformation mode of the phenomenon at hand is compression,<br />
foam samples were subjected solely to experimental uniaxial compression loads. The<br />
uniaxial compression tests were undertaken at the Materials Lab at MIT under the<br />
guidance of Prof. Lorna Gibson.<br />
The tested foam specimens were of cross section A = 15cm 2 and height H = 2.54 cm.<br />
Four compression tests were executed at strain rates of 3.28 10-2, 6.56 10-2, 1.312 10- 1 and<br />
3.28 10-1 1/s. The testing of various applied strain rates is necessary due to the fact that<br />
foam is a material with mechanical properties highly strain rate dependant. At very<br />
high strain rates, dynamic effects drive the compression strength upwards. Three<br />
features of dynamic crushing influence the overall force - displacement response and<br />
hence the stress-strain curves [44].<br />
1. Localisation. The concentration of deformation, at a given instant, into a thin layer<br />
or band, often adjacent to the loading face.<br />
2. Micro-Inertia. Inertia associated with rotation and lateral motion of cell walls<br />
when they buckle. This tends to increase the crushing stress, the stress at which<br />
failure occurs under compression loading.
3. Densification. This causes the stress to rise steeply when cell walls come into<br />
contact, leading to "shock enhancement" at very high strain rates, due to cell<br />
collapse.<br />
Based on the vertical velocity of the top moving plate of the Instron machine, the<br />
strain rate can be calculated using Equation 4.1-1, where E is the engineering strain<br />
(ratio of displacement over initial length of specimen).<br />
AL . 1 dH I<br />
e= -- >6= - = - -<br />
LO LO dt LO<br />
where E: engineering strain<br />
LO: initial height of specimen<br />
H: vertical displacement of moving plate<br />
Equation 4.1-1<br />
The following table (Table 4.1-2) summarizes the important characteristics of the<br />
uniaxial tests that were completed, and Figure 4.1-1 shows the stress-strain curves of the<br />
uniaxial tests.<br />
3.28 10-2<br />
2 100 6.56 10-2<br />
3 200 1.31210-1<br />
4 500 3.28 10-1<br />
Table 4.1-2: Uniaxial compression tests for VN 600 foam<br />
imr_-
700000<br />
600000<br />
400000<br />
10 0 00<br />
Uniaxial Compression Stress - Strain<br />
200 10 m-k<br />
0<br />
0 0.1 0.2 0.3 0.A 0.5 0.6 0.7 0.8 0.9<br />
Strain<br />
Figure 4.1-1: Experimental uniaxial compression curves for stress-strain VN 600 foam<br />
A number of qualitative characteristics of the VN 600 foam can distinguished<br />
be<br />
from Figure 4.1-1. It is evident that strain rate has a significant influence on the stress<br />
characteristics. Even though the achievable strain rates in the lab were extremely small<br />
compared to the strain rates observed in blast attenuation problems, even where the<br />
highest obtained strain rate is approximately four orders of magnitude smaller, an<br />
observable increase in stress values is evident.<br />
Based on the experimental curves and the fact that there seemed to be no evident<br />
post loading permanent deformation of the foam samples, the behavior of the material<br />
seems to be of nonlinear hyperelastic nature. Stress-strain curves of foam materials that<br />
exhibit hyperelastic behavior tend to have three distinguishable stages [44, 45, 46]:
1. A linear elastic region for small strains e < 0.1 due to cell wall bending,<br />
2. A region of almost constant or slightly increasing stress, deformation plateau,<br />
caused by the elastic buckling of the columns or plates that make up the cell<br />
walls or edges. In the case of closed cell foams, the enclosed gas pressure and<br />
membrane stretching increase the level and slope of the plateau.<br />
3. Finally, a region of densification occurs, where the cell walls crush together,<br />
resulting in a rapid increase of compressive stress. Ultimate compressive<br />
nominal strains of 0.7 to 0.9 are typical.<br />
The experimental curves demonstrate a linear elastic region for small strains e 0.06.<br />
A least squares fit of a linear function results in a line with a slope of approximately 1.11<br />
106 Pa and 1.78 106 Pa for the 50 mm/min and 500 mm/min test cases respectively. The<br />
following Table 4.1-3 shows the Young's Modulus E and the collapse strength Gei of the<br />
foam samples based on the compression tests.<br />
Table 4.1-3: Mechanical properties of VN 600 foam under uniaxial compression
--<br />
Hydrostatic Compression Testing of VN 600 Foam<br />
In addition to the uniaxial testing, the conduct of hydrostatic testing was also<br />
necessary to determine the material characteristics of the DERTEX foam. Data from this<br />
round of testing are used by ABAQUS to determine the Poisson's ratio and calculate the<br />
compressibility of the used foam. The hydrostatic tests were undertaken at the Soils Lab<br />
at MIT under the guidance of Dr. Jack Germaine, who implemented the required<br />
experimental apparatus.<br />
The experimental setup consists of two basic components: a) The pressure chamber<br />
where the foam specimens were placed. This is steel a cylindrical compartment with<br />
removable tops on each end. These end caps are screwed on the cylindrical<br />
compartment, while with the help of two 0 rings the compartment remains airtight, b)<br />
A metallic cylindrical compartment with a piston at the bottom end. This piston is<br />
driven by a motor and gradually decreases the volume inside the cavity, thus applying<br />
pressure to the fluid. The pressure exerted on the foam specimen is the hydrostatic<br />
pressure of the fluid and the decrease in the specimen volume is equal to the additional<br />
fluid entering the pressure chamber. Compressibility of the water was not taken into<br />
account since the maximum obtained pressure was approximately 1 MPa and the Bulk<br />
Modulus for water is approximately 2.2 GPa. The following Figure 4.1-2 illustrates the<br />
experimental setup employed for the hydrostatic testing.<br />
Figure 4.1-2: Pressure chamber and foam specimen (left picture) compartment with piston (right picture)
A pressure load cell, used to measure the applied pressure of the fluid, was<br />
mounted on the top of the compartment with the piston while an LVDT was used to<br />
measure the displacement of the piston. The measured displacement of the piston in<br />
combination with the knowledge of the sampling frequency of the data acquisition<br />
system (2 Hz), allows the calculation of the piston velocity. Ultimately, it is possible to<br />
determine the volumetric strain rate the samples were subject to by using Equation<br />
4.1-2.<br />
AV . 1 VdV xR,,,2 dHt Rpist 1<br />
-= =>_ = - - - -foam), Equation 4.1-2<br />
V. V, dt V, dt Rfoan fHan<br />
where e : volumetric strain<br />
V: initial volume of specimen<br />
Rpist: radius of mechanical piston<br />
Rfoa: radius of foam specimen<br />
Hpist: displacement of piston<br />
Hfoam: height of foam sample<br />
The foam specimens that were tested had a diameter of Dfoam= 3 . 4 3 cm and height of<br />
Hfoa=2.54 cm while the piston had a diameter of Dpist=1.905 cm. Four hydrostatic tests<br />
were conducted for various strain rates. Table In 4.1-4 a description of the four tests is<br />
provided and Figure 4.1-3 contains the pressure-volumetric strain curves that were<br />
obtained from the hydrostatic tests.<br />
1.313 102 2.9U7 1U-i<br />
2 2.68210-2 5.939 10-3<br />
3 4.41910-2 9.785 10-3<br />
4 6.071 10-2 1.344 10-2<br />
Table 4.1-4: Hydrostatic tests for VN 600 foam
1400000<br />
1200000<br />
-4000000<br />
800000<br />
800000<br />
-400000-<br />
Hydrostatic Test Presure - Strain<br />
-0.1 G 0.1 0.2 0.3 0.4 0.5 0.6 0.7 0.8 0.9<br />
200000<br />
Volumetric Strain<br />
Figure 4.1-3: Experimental hydrostatic compression pressure- volumetric strain curves for VN 600 foam<br />
-4-test_1<br />
-k-test 2<br />
-h-test3<br />
+test4<br />
The pressure-volumetric strain curves that are illustrated in Figure 4.1-3 are<br />
qualitatively similar to the curves obtained form the uniaxial compression tests Figure<br />
4.1-1. For small strain values an initial linear elastic region is measured, which is<br />
followed by a region of almost constant pressure for increasing values of strain and<br />
finally a densification region, with a steep increase of pressure values. In the following<br />
table the bulk modulus K and the collapse pressure pei for the linear elastic region is<br />
calculated (Table 4.1-5).
49.2<br />
2 1.076 64.8<br />
3 1.243 74.5<br />
4 1.271 76.5<br />
Table 4.1-5: Mechanical properties of VN 600 foam under hydrostatic compression<br />
Scaling of Mechanical Properties of VN 600 Foam<br />
As previously mentioned, the strain rates at which the foam samples were subject to<br />
during the mechanical testing procedures are extremely low compared to experienced<br />
strain rates during blast wave loading. In order to obtain the material properties under<br />
high strain rate loading one would have to use a specialized experimental apparatus<br />
such as a split Hopkinson bar. By subjecting the specimen to an incoming stress wave<br />
and measuring reflected and transmitted waves, mechanical the properties at high<br />
strain rates can be accurately measured.<br />
However, such a device was not available at this point of the project. Therefore,<br />
based the on experimental stress-strain curves derived under low strain rates and<br />
applying appropriate scaling the rules, approximate high strain rate response of the VN<br />
600 foam for both uniaxial and hydrostatic compression was estimated. Motivated by a<br />
number of literature references, a formula (Equation 4.1-3) first suggested by Nagy to<br />
predict the stress as a function of strain and strain based rate on a reference stress value<br />
was employed [46, 47]
a-(e)= o -a Equation n 4.1-3<br />
.<br />
where n(s) = a + bE, power coefficient for rate dependency.<br />
(oo,Eo) : reference data<br />
i,: strain rate of reference data<br />
The reference data (oo,co) is usually taken at quasi-static strain rates. In our case, for<br />
both uniaxial and hydrostatic tests, the reference data correspond to the stress-strain<br />
curve the at lowest strain rate. In the equation above, the coefficients a and b are<br />
material coefficients that have to be determined through experimental stress-strain<br />
curves and the use of Equation 4.1-3. The process undertaken for the calculation of the<br />
two coefficients a and b is presented in Appendix A. The resulting n(E) for both loading<br />
conditions is presented in the following Table 4.1-6.<br />
Table 4.1-6: Rate sensitivity power coefficient n(E) of VN 600 foam for uniaxial and hydrostatic loading<br />
After calculating the n(s) the existing low strain rate curves can be scaled to higher<br />
strain rate loading more typical of incoming blast loading. The following two figures<br />
include two experimental curves (lowest highest and strain rate data) and scaled curves<br />
for strain rates of 10, 100, 1000 and 1500 1/s for both uniaxial 4.1-4 Figure and<br />
hydrostatic loading Figure 4.1-5.
X 10<br />
50 mmlmin experimental<br />
500 mm/min experimental<br />
- 10 1s scaled<br />
100 i/s scaled<br />
1000 1/s scaled<br />
1500 1/s scaled<br />
/ -..............<br />
--<br />
-<br />
...... -...- ..... --<br />
- |~ I<br />
- - - ~ ~<br />
I I<br />
I I<br />
I I<br />
4,<br />
I .4.'<br />
4 ,,<br />
------- 4<br />
4 4/<br />
0 0.1 0.2 0.3 0.4 05 0,6 0.7 0.8<br />
Figure 4.14: Experimental and scaled curves for uniaxial compression<br />
X 106<br />
3 0 1 I 4 I<br />
0.003 1/s experimental<br />
- 0.013 1/s eopedmrental I44<br />
10 ils scaled<br />
100 1/s scaled<br />
.5 - 1000 scaled 11 1 1 T ~ - - - - --<br />
1500 1Us scaled<br />
2 - - - - -t - ------ - - - - -<br />
- - - --<br />
-- -- -' - - - - -<br />
.5 - - I - - - - -- - - - -- - - -<br />
1--~- -- 4 -- 4- - -4 - --<br />
I302 03 0 5 04 4. 0.8 0<br />
. .4- ... ... ..<br />
~<br />
Fiur 4,-5 Exeimna an 4cldcre o yrsaiopeso<br />
45 -4- -4 -4.- - -4- - - -<br />
... . . ..<br />
0 01 0.2 0.3 0.4 05 0.5 0.7 0.8 0.9<br />
Figure 4.1-5: Experimental and scaled curves for hydrostatic compression<br />
/<br />
/<br />
/<br />
.~~
After obtaining the scaled (o,E) and (p,E) curves the next step would be to calculate<br />
typical material properties at these higher strain rates such as the Young's Modulus (E),<br />
Bulk Modulus (K) and calculate the Poisson's ratio (v). It was assumed that the VN600<br />
foam was an isotropic material, an assumption that ABAQUS also uses in order to<br />
model foams with hyperelastic behavior under the HYPERFOAM material option that<br />
is planned to be used. By assuming isotropic behavior and having calculated E and K<br />
from the linear elastic regions of the stress-strain curves, the Poisson's ratio v can be<br />
calculated through the following Equation 4.14<br />
V = 3K - E Equation 4.1-4<br />
6K<br />
In the following Table 4.1-7 the E, K and v properties of the scaled VN 600 curves<br />
for strain rates of 10, 100, 1000 and 1500 1/s are presented. In order to compare these<br />
values of the Poisson's ratio with one that is calculated from experimental data, the E<br />
value of the lowest strain rate uniaxial test (3.28 10-2 1/s) and the K of the highest strain<br />
rate hydrostatic test (1.344 10-2 1/s) are used. The strain rates of these two tests are not<br />
exactly the same; however they are very similar and such small magnitude differences<br />
of the strain rate do not produce noticeable differences as illustrated by the stress-strain<br />
curves presented in the previous page and the calculated material properties based on<br />
the experimental data.<br />
Strain Rate [1/s] Type E (MPa) K (MPa) N<br />
3.28 10-2 Experimental 1.11 1.27 0.354<br />
10 Scaled 2.53 3.42 0.376<br />
100 Scaled 3.54 5.10 0.384<br />
1000 Scaled 4.94 7.62 0.392<br />
1500 Scaled 5.24 8.18 0.393<br />
Table 4.1-7: Material properties of scaled curves for VN 600 foam
Typical values of the Poisson's ratio for closed cell foams are around v =0.33, hence<br />
the foam that is being used has a v value similar to the values documented in literature<br />
[44]. The v value increases with increasing strain rates implying that the foam is<br />
becoming more incompressible at higher strain rates.<br />
4.1.2 Modeling of VN 600 foam through Mie - Grineisen Equation of State<br />
The previous paragraph described the procedure followed for obtaining the<br />
experimentally derived stress-strain curves. This paragraph is devoted to modeling the<br />
hydrostatic behavior of the VN 600 foam through the use of the linear Hugoniot model<br />
in combination with the Mie Gruneisen EOS, both described analytically in Chapter 3.5.<br />
The linear Hugoniot shock model is an empirical relation between shock velocity Us<br />
[m/ s] and particle velocity Up [m/s] as was mentioned in Chapter 3.5:<br />
U, = C +sU, Equation 4.1-5<br />
where Co [m/s] and s are constants determined through experiments.<br />
At this point experiments have not been conducted to measure the two constants of<br />
interest. However, C. for many materials has a similar to value the bulk sound velocity<br />
Cb [42]. The bulk sound velocity is a property that can be computed through the<br />
experimentally obtained stress-strain curves through the following formula:<br />
Cb= =<br />
Equation 4.1-6<br />
E
By substituting the experimentally determined value for the bulk modulus at quasi<br />
static loading and the initial density, the bulk sound velocity for the VN 600 foam has a<br />
value of Cb=108.44 rn/s.<br />
In order to obtain a value for the slope s of Equation 4.1-5, estimation was made<br />
based on publicized data regarding polyurethane foam. Polyurethane foam of low<br />
density was the basis for the estimation due to well established publicized data and<br />
primarily due to the fact that flexible PU foam has been traditionally used in protective<br />
gear and packaging. Polystyrene was not considered for the basis of this estimation due<br />
to its crushable and brittle nature. The slope s was determined after finding a specific<br />
PU foam of comparable C value to the respective value for the VN 600 foam that was<br />
previously calculated [48].<br />
Based on data publicized by Mader C. and Carter W., shock wave propagation in PU<br />
foam of density po=500 kg/m 3 is described by Us =150 +1.5 Up while for PU foam of<br />
density po= 3 2 0 kg/m 3 it is described by Us =100 +1.32 Up [48]. Therefore, based on these<br />
values the slope of the equation relating shock to particle velocity was estimated to have<br />
the value of s=0.35 and the linear shock Hugoniot equation for the VN 600 foam takes<br />
the form Us=108.44 +1.35Up.<br />
As previously mentioned, the linear Hugoniot model is used in combination with<br />
the Mie Grineisen EOS through the following equation [45, 49, 42]:<br />
where po: reference density<br />
1-p/ po<br />
F: Grtineisen parameter<br />
P = P."C_ -_ 1 + 17pe Equation 4.1-7<br />
(1-s )2 2)<br />
e: internal energy per unit mass
The only parameter that has not been determined in Equation 4.1-7 is the Grineisen<br />
parameter IF. No information has been found for this parameter which requires a<br />
demanding experimental procedure to determine, therefore a value of zero has been<br />
used in the simulations. The implication of using a zero value is that the response of the<br />
foam plate is considered to be isothermal and no increase of temperature in the foam<br />
will be observed. The following table contains the parameters used for the VN 600 foam<br />
modeling.<br />
108 108.44 1.35 0<br />
Table 4.1-8: Mie-Gruneisen parameters for VN 600 foam<br />
In addition to the hydrostatic behavior of the VN 600 foam, it is necessary to model<br />
the response of the material under shear. Therefore, the shear modulus G [MPa] is<br />
calculated and introduced into ABAQUS through the following formula:<br />
E<br />
G = E<br />
2(1 +v)<br />
Equation 4.1-8<br />
Using the experimental values found in Table 4.1-7 the shear modulus that was finally<br />
used is G=0.405 MPa.<br />
4.2 Expanded Polystyrene Foam<br />
Expanded Polystyrene Foam (EPS) is a foam type that is traditionally used in sport<br />
helmet applications due to its good energy absorbing characteristics, low weight and
cost. Therefore, it seemed logical to use this type of foam in our initial numerical<br />
modeling. The procedure described in references [50, 51, 52] was used in order to obtain<br />
the necessary stress-strain curves to input in ABAQUS.<br />
The EPS foam behavior is very different from the behavior of the VN 600 DERTEX<br />
foam described in the previous paragraph. The VN 600 foam illustrates a nonlinear<br />
hyperelastic behavior while the EPS foam exhibits an almost plastic behavior that is<br />
modeled using the CRUSHABLE FOAM model of ABAQUS. The CRUSHABLE FOAM<br />
model is for isotropic materials which harden as the volume changes [45]. The yield<br />
surface which describes the stress states that cause yielding has:<br />
p - - 2 +(a a 2 = a 2 Equation 4.2-1<br />
2 b)<br />
where oe: Von Mises equivalent stress<br />
p = - : hydrostatic stress<br />
3<br />
pc : strength of material in hydrostatic compression<br />
pt: strength of material in hydrostatic tension<br />
a, b: half axes of yield surface ellipse<br />
The section of the yield surface in the poe plane is an ellipse, with half axes a and b<br />
in the p and ae axes respectively. The ellipse intercepts the p axis at -pt and Pco,<br />
respectively, the initial yield pressures in hydrostatic tension and compression. When<br />
the foam volume reduces, it hardens, and the ellipse increases in size while maintaining<br />
the same axial ratio; the p axis intercept at -pt remains fixed, while that at the right<br />
moves to pc [45].<br />
The parameters used in ABAQUS are oco/pco and pt/pco, where oco is the initial yield<br />
stress in uniaxial compression. In addition to the previous ratios, tabular hardening<br />
data for oc vs. true compressive plastic strain is required. Using impact uniaxial
compression tests the value of oco/pco was measured at oco/pco = 1.933. The value of this<br />
ratio is considered to be independent of strain rate, since the values of oc and Pco<br />
change by only a small percentage while subjecting the EPS to quasi static or impact<br />
loading, a strain rate increase of four orders of magnitude [51]. On the other hand, pt is<br />
extremely difficult to measure, therefore the ABAQUS manual suggests using<br />
pt/pco=0.05. However, in order to achieve stable modeling the value pt/pco=1 was used.<br />
The validity of using this value for pt/pco is proven by the results reached in references<br />
[50, 51, 52], therefore it was decided to use the same value for the material response<br />
simulations during this research effort.<br />
The uniaxial compressive stress oc versus engineering strain e curve for the<br />
hardening phase of the material behavior was fit with the gas pressure hardening<br />
equation Equation 4.2-2<br />
Poe<br />
UC = cO + " R Equation 4.2-2<br />
1-s-R<br />
where R: relative density of foam (ratio of foam density over polymer density, with<br />
Ppolystyrene = 1050 kg/m 3 )<br />
po: effective absolute gas pressure in undeformed foam cells<br />
In addition to the CRUSHABLE FOAM model of ABAQUS, the use of the LINEAR<br />
ELASTIC model was employed to model the initial behavior prior to reaching the<br />
strength of the material. All the necessary material properties used for both elastic and<br />
plastic regions (hardening) of the material behavior are presented in the following Table<br />
4.2-1 for three density values of the EPS.
0.29 0.15<br />
55 20 0.1 0.6 0.20<br />
85 40 0.1 1.1 0.27<br />
Table 4.2-1: Material properties of EPS foam [50, 51, 52]<br />
The following Figure 4.2-1 contains the hardening c, vs. plastic true strain epi data<br />
for the three foam densities of the EPS foam. The data corresponding to the more dense<br />
EPS was used in order to have a similar density with the VN 600 Dertex foam.<br />
2500000<br />
2000000<br />
1500000<br />
1000000<br />
500000<br />
-m -m -~~~~ U-~ in - U--<br />
Hardening Data<br />
- -<br />
0 0.1 0.2 0.3 0.4 0.5 0.6<br />
true strain E<br />
Figure 4.2-1: Hardening data oc vs. true strain for EPS foam<br />
-i-<br />
-e p=35<br />
-- p=5 5<br />
p=85
4.3 Filler Materials<br />
The filler materials that were used during the experimental leg of the project in<br />
order to test their attenuation effectiveness were selected to cover a broad range of<br />
density, characteristic acoustic impedance Zo, particle size and viscosity. The materials<br />
that were tested are cabosil, glass shot, aerogel, volcanic tuff, expanded. spray foam,<br />
water and glycerin and their material properties are shown in Table 4.3-1.<br />
Viscosity was hypothesized to have an effect on the attenuation capabilities of the<br />
filler materials through viscous dissipation. Therefore, glycerin and water were tested<br />
as candidate materials; with the dynamic viscosity of glycerin being approximately four<br />
orders of magnitude larger than the viscosity of water. Furthermore, it was anticipated<br />
that fluid materials might also enhance the spatial distribution of the effects of the<br />
incoming wave.<br />
Particle size was another parameter that was taken into account. Aerogel, cabosil<br />
and glass shot powder filler materials were used. Aerogel is primarily used for thermal<br />
insulation and is mainly comprised of approximately 95-99% air with the remaining<br />
percentage being silicon dioxide [53]. Cabosil, on the other hand, is a fluid thickening<br />
agent and is used in the food industry due to its inert nature. It contains approximately<br />
94% air while the remaining consists of silicon dioxide [54]. Finally, glass shot is a<br />
material comprised of 250-420pm size particles. Powdered non homogeneous materials<br />
containing fine particles and a high percentage of air provide a large number of<br />
interfaces with impedance mismatches leading to possible enhanced attenuation<br />
capabilities.<br />
Density was a parameter that varied between all tested materials. Low density<br />
materials include cabosil and aerogel, mid density include expanded foam, water and<br />
glycerin while high density materials are the glass shot and volcanic tuff. Density, along<br />
with the Young's modulus E, plays a significant role in wave transmission since it<br />
influences the speed of sound in a material and ultimately its characteristic acoustic<br />
impedance. Large impedance values and specifically large impedance mismatches
would lead to an increase of the reflected component of the wave, while large values of<br />
the speed of sound would ultimately increase the propagation speed of the propagated<br />
wave through the material.<br />
The volcanic tuff that was used has been claimed to offer significant blast<br />
attenuation capabilities, a feature demonstrated during volcanic rock blasting for the<br />
construction of roads other and infrastructure in the southwest states of the United<br />
States. The rocks were broken into small segments of less than inch size before placed<br />
in the test samples [21].<br />
Water 1000 1500 1500 8.9410-4<br />
Glycerin 1260 - 1900 2400 1.5<br />
Aerogel 5-200 1000-5000 70-1300 10 -<br />
Cabosil 35-60 0.2-0.3 100-1500 5-100<br />
Glass Shot 2456-2486 250-420 3700-5300 10000<br />
Expanded 1060 - - -<br />
Foam<br />
Volcanic 1300 -<br />
Tuff<br />
Table 4.3-1: Properties of filler materials [21, 53, 54]
4.4 Plexiglas PMMA<br />
Plexiglas PMMA sheets used were in order to sandwich the test samples and place<br />
them on the test stand during the experimental phase (see Chapter 5.1 Testing<br />
Apparatus). In order to model the PMMA in the numerical simulations, the Mie-<br />
Grineisen equation of state used was as described in Chapters 3.5 and 4.1.2 in addition<br />
to a shear modulus G for shear behavior modeling. The bulk sound velocity Cb, the<br />
material constant s, the Grtneisen parameter and the shear modulus G that were used<br />
are contained in the following table [55, 56].<br />
4.5 Water<br />
p, [kg/m] Ct, [rn/s] S TO G [GPa]<br />
1180 2260 1.82 0.75 1.148<br />
Table 4.4-1: PMMA material parameters<br />
As previously mentioned, the liner Hugoniot model and the Mie-Grineisen EOS<br />
may also describe the hydrodynamic behavior of fluid materials. Water, used in the<br />
numerical investigation of the response of samples under shock loading, is modeled by<br />
the Hugoniot/Mie-Grineisen through the parameters shown in Table 4.5-1 [57].<br />
Furthermore, in order to model the shear response of the fluid the dynamic viscosity P<br />
at T=200C was used [58], while the specific heat Cp is defined for the thermal response<br />
[58].<br />
po [kg/m 3 ] Cb [m/s] s FO p4 [Ns/m 2 ] Cp [J/Kg K]<br />
1000 1490 1.92 0.1 0.001002 4186<br />
Table 4.5-1: Water material parameters
4.6 Air<br />
The air surrounding the solid samples in the simulations of Chapter 7: Numerical<br />
Simulation of Material Response under Shock Loading is modeled using the Ideal Gas<br />
EOS Equation 4.6-1 [45]<br />
where pa: the ambient pressure<br />
R: gas constant<br />
p: density<br />
Ta: ambient temperature<br />
p + Pa = pR(T - Ta) Equation 4.6-1<br />
The parameters of the above equation are given in the following Table 4.6-1.<br />
Additionally, the dynamic viscosity and specific heat at constant volume Cv of air at<br />
T=200C were employed to model the shear and thermal behavior [58].<br />
L ...<br />
1.208 287.04 1.8210-5 718.16 1.01325105 -273<br />
Table 4.6-1: Air Material parameters
5 Experimental Blast Mitigation Study<br />
This chapter provides a description of the experimental approach that was followed<br />
in order to evaluate the blast attenuation capabilities of the helmet liner design. The<br />
chapter covers the topics of the testing apparatus and instrumentation that was used,<br />
the experimental procedure and finally presents the results that were obtained. As<br />
previously mentioned, the experimental leg of the project was undertaken at Purdue<br />
<strong>University</strong>, under the supervision and guidance of Prof. Son and with the assistance of<br />
Matthew Alley.<br />
5.1 Testing Apparatus<br />
The testing apparatus consists of a test stand; an open frame structure that is<br />
constructed from 1 inch angle aluminum beams. This test stand is then mounted on a<br />
sturdy optical table, which consists of a top surface with a 1 inch grid pattern of screw<br />
holes across the surface. In order to properly secure the test samples, a sample holder<br />
was constructed and mounted on the test stand, such that the test samples are held at a<br />
vertical stance with the front face perpendicular to the blast axis. The samples are fully<br />
constrained on all four sides with the use of rigid angle aluminum supports and placed<br />
at a distance of 12 inches from the mouth of the shock tube.<br />
A number of initial tests were conducted with the apparatus in the status that was<br />
previously mentioned. However, a number of measurement problems became apparent<br />
after careful examination of the obtained results. Based on comparisons between the<br />
images obtained with the shock visualization technique that was used (described<br />
shortly) and the measured value of the transmitted waves, it became evident that the
measured pressure contained contributions not only from the transmitted wave but also<br />
from the incoming wave. The initial incoming wave would converge from sides the of<br />
the test sample and due to its higher speed would affect the measurements of the<br />
transmitted wave.<br />
Adjustment of the apparatus was therefore required in order to eliminate the<br />
influence of the incoming wave in the transmitted pressure wave measurements. In<br />
order to isolate the transmitted wave, a Plexiglas chamber was manufactured and<br />
attached to the test stand behind the test sample. The chamber constructed was from<br />
inch thick Plexiglas panels of 16 in x 7.5 in dimensions. The rear end of the chamber was<br />
not closed in order to place the pressure transducer. Additionally, two Plexiglas 10 in x<br />
10 in x 0.125 in plates were placed such as to sandwich the test sample between them.<br />
The previously mentioned chamber was attached to the rear Plexiglas plate with the use<br />
of epoxy. The reader can consult Figures 5.1-1 and 5.1-2 for an illustration of the final<br />
form of the testing apparatus.<br />
Figure 5.1-1: Experimental apparatus in its final form. Front view
Figure 5.1-2: Experimental apparatus in its final form. Side view<br />
The incoming shock wave was produced by the detonation of small charges of<br />
pentaerythritol tetranitrate (PETN) plastic sheet explosive that were rolled into small<br />
spherical charges. The amount that was used was determined after specifying the<br />
overpressure range of interest for the experiments. The incoming blast wave was<br />
directed toward the test stand and sample through an explosive driven shock tube,<br />
which is depicted in Figure 5.1-3. The shock tube consists of two chambers, a 12 inch<br />
detonator and a 36 inch High Explosive (HE) chamber. The purpose of the detonation<br />
chamber is to prevent any fragmentation of the detonating mechanism in the produced<br />
shock wave, since the focus of this study is not on fragmentation protection. On the<br />
other hand, the length of the HE chamber assists in the separation of the shock wave<br />
from the chemical byproducts of the detonation process due to the higher (supersonic)<br />
velocity of the shock front compared to the velocity (subsonic) of the detonation
products. Additionally, the HE chamber minimizes reflections of the shock front and<br />
turbulence [21].<br />
Figure 5.1-3: Explosive driven shock tube [21]
5.2 Test Samples<br />
Blast tests were conducted on two groups of samples. The first group consists of<br />
solid DERTEX VN600 foam plate samples of dimensions 10 in x 10 in x 1 in with a<br />
corresponding volume of 100 in3. The solid foam samples are regarded as the control<br />
samples, since no alterations to their geometry and no inclusion of any filler materials<br />
has been made. The second group of test samples maintains the same external overall<br />
dimensions (10 in x 10 in x 1 in) and foam material as the control group. However, their<br />
internal foam core was removed such that a single cavity of dimensions 10 in x 8 in x 0.5<br />
in and corresponding volume of 40 ins was present in their interior. The following<br />
Figure 5.2-1 shows a drawing of the test sample with its internal cavity.<br />
Figure 5.2-1: Illustration of single cavity test samples<br />
The filler materials that are described in Chapter 4 are inserted in the single cavity of<br />
the test samples and placed for testing. The measured transmitted pressure profiles are<br />
then compared to the pressure profiles of the control-benchmark sample group. The<br />
procedure of containing the filler material in the cavity presented some difficulties in<br />
the case of fluid fillers such as water and glycerin. It was required that the filler material
not be constrained in the cavity during the shock impact and propagation, such as to<br />
take full advantage of any possible viscous attenuating mechanisms. However, the fluid<br />
fillers would have to be contained until the instance of the impingement of the shock<br />
wave. We determined that by using aluminum foil to cover the open of the ends cavity,<br />
adequate strength was provided to confine the fluid inside the sample prior to the<br />
shock arrival, however not enough to withstand the experienced peak pressure which<br />
would instantly rupture it, allowing uninhibited the follow of the filler material.<br />
5.3 Instrumentation<br />
In order to test effectiveness the and attenuation capabilities of the proposed liner<br />
design, the pressure profile of the transmitted wave at a certain standoff distance from<br />
the back surface of the test sample was measured. This distance was kept constant for<br />
all tests. The measurement location was specified 16 inches at away from the center of<br />
the shock tube mouth. Taking account into the thickness of the sample and the two<br />
Plexiglas the sheets, pressure measurements were taken 2.75 inches behind the back<br />
surface of the test samples. The use of one pressure gage located at the center of the<br />
sample at the and pre described distance was considered to be adequate to measure the<br />
transmitted wave. The center location of the pressure transducer was selected so that it<br />
was positioned along the axis of the blast wave. Furthermore, due to the geometry of<br />
the used samples, either solid foam or samples including filler materials, it is desirable<br />
to measure the transmitted wave that propagates through all material interfaces.<br />
In order to obtain visual on data the shock wave propagation shadowgraph imaging<br />
was employed. Schlieren and shadowgraph photography<br />
are similar methods of
imaging that reveal localized changes of refractive index' found in transparent media,<br />
including glass, liquids and gases. These gradients may be static, such as irregularities<br />
seen in glass, or dynamic, such as those induced by pressure, density, composition or<br />
temperature gradients in fluids. Both methods use optical systems that show localized<br />
displacements of light rays against a uniform background illumination gradient, which<br />
is projected onto a viewing screen or camera focal plane. Shadowgraphy is the simplest<br />
method of visualizing refractive indexes, requiring only a point light source and a<br />
screen to project the subject's shadow. The viewing screen will be illuminated<br />
uniformly by the direct rays of the light source. However, local changes in the refractive<br />
index deflect the rays of the light source resulting in a decrease of illumination at the<br />
point on the screen from which those rays have been displaced, and an increase of<br />
illumination at the location on the screen where those rays eventually strike [59,60]. A<br />
high speed camera was used to record the blast phenomenon at a typical frame rate of<br />
approximately 36,000 fps. The high intensity light beam was produced by a source that<br />
was placed at a 900 angle with respect to the camera and was later converged through a<br />
focusing lens. The light beam would then be reflected of a 450 mirror placed on the front<br />
of the camera and projected across a reflective screen. The shadowgraph setup can be<br />
seen in Figure 5.3-1 [21].<br />
The refractive index of a medium is a measure of how much the speed of light (or other waves such as<br />
sound waves) is reduced while propagating through the medium compared to the speed in vacuum [61).
PhantIOM Mgjh<br />
speed cara<br />
lrnAnned target<br />
ocusing lens shadowgraph<br />
screen<br />
Explosive ddven<br />
shocki tube<br />
DAQ and signal<br />
condtoners<br />
computer E<br />
PETN<br />
Detonator<br />
Figure 5.3-1: Shadowgraph and experimental setup [21]<br />
Fidng<br />
device<br />
The free field pressure was measured with a pencil probe placed at a standoff<br />
distance of 16 inches from the mouth of the shock tube; the same distance at which the<br />
pressure gage placed behind the sample was located. The axis of the pencil probe was<br />
placed in a manner that was normal to the surface of the shock wave. There was no<br />
obstruction between the free field pressure gage and the mouth of the shock tube,<br />
therefore the pressure profile that was measured represents the pressure of the shock<br />
wave that would be measured at the location of the main pressure location were there<br />
an absence of the test sample.<br />
The raw data measurements obtained by the pressure transducers were fed to a data<br />
acquisition unit and a number of oscilloscopes. Noise filtering and reduction<br />
procedures were also performed on the data in order to obtain better results. For further<br />
information and a detailed description of the data acquisition and filtering techniques<br />
used and the hardware employed, the reader may consult the MSc thesis of Matthew<br />
Alley [21].
5.4 Incoming Blast Wave Parameters<br />
The determination of the incoming blast wave parameters is of utmost importance to<br />
both experimental and numerical aspects of the project. Measuring the shock wave<br />
parameters allows the repeatability of the experiments, such that all test samples are<br />
subjected to the same loading conditions. Numerically, it is important to know the<br />
parameters of the representative incoming wave as to simulate the same loading<br />
conditions in the numerical simulations.<br />
Three gram charges of PETN plastic sheet explosives were used in the experiments<br />
that follow with a TNT equivalent mass of 2.87 grams, releasing an explosive yield of<br />
13.24 KJ. In order to achieve the desirable peak overpressure it was imperative to<br />
determine the correct standoff distance; the distance between the front face of the<br />
sample and the mouth of the shock tube. By conducting a number of test blasts with no<br />
target placed on the test stand, the profile and blast parameters of the incoming wave<br />
were measured. Table 5.4-1 contains the blast parameters of the incoming wave at<br />
standoff distances of 8, 12, 16 and 17 inches, while Figure 5.4-1 depicts the measured<br />
pressure profile.<br />
1U.68 U.zi 108.10<br />
12 5.00 0.39 0.81 24.82<br />
16 5.19 0.57 1.13 15.01<br />
17 5.18 0.63 1.17 13.98<br />
Table 5.4-1: Measured blast parameters for incoming wave [21]
As mentioned in previous paragraphs of this chapter, the selected standoff distance<br />
for the tests was 12 inches. For repeatability purposes twelve more test blasts were<br />
undertaken at the 12 inch standoff distance order in to measure the blast parameters<br />
and check their consistency. The measured parameters from these twelve tests showed<br />
standard deviations of 10% for positive impulse, less than 5% for arrival time and<br />
approximately 15% for peak pressure. Although the deviation for the peak pressure is<br />
not insignificant, it should be noted that for small, laboratory scaled experiments these<br />
deviation percentages suggest acceptable overall repeatability especially when<br />
considering all three parameters simultaneously [21, 62].<br />
-'12 nfch f r-field<br />
__ ____ ____ " ree-i<br />
17 e Id<br />
2 2.5 3<br />
Time from trigger (ms)<br />
Figure 5.4-1: Profile of incoming blast wave [21]
5.5 Results<br />
The experimental evaluation of the attenuating capabilities of the test samples<br />
investigated two specific parameters of the problem at hand. The bulk of the<br />
experimental work concentrated on measuring the attenuation effectiveness of various<br />
test samples containing solid and fluid filler materials. Additionally, attention was<br />
focused on the effect the of blast intensity on the attenuation capabilities of a specific<br />
test sample configuration.<br />
5.5.1 Foam - Filler Material Attenuation Study<br />
The transmitted pressure profile corresponding to the solid foam is considered to be<br />
the benchmark case and the blast attenuating effectiveness of the solid or fluid filled test<br />
samples are compared against this benchmark case. It should be noted that all samples<br />
were subjected to approximately the same incoming shock wave. Even though the same<br />
amount of explosive PETN charge was used for all blasts, the resulting pressure wave<br />
may not have been exactly similar for all tests as mentioned in Chapter 5.4.<br />
Material filled test samples can grouped be into two basic categories; one consisting<br />
of samples filled with solid filler materials and the other consisting of fluid filler<br />
materials. In regard to the solid filler materials, two material groups can also be<br />
distinguished; materials with low (aerogel and cabosil) to mid range density<br />
(expanding spray foam) and materials with high density (volcanic tuff and glass shot).<br />
The reader is directed to Chapter 4.3 where the material properties of the examined<br />
materials are presented and a more detailed description of the materials is presented.<br />
Figure 5.5-1 includes the pressure response of the solid foam and low mid to density<br />
solid filler material samples. An interesting aspect of the first group of solid materials is<br />
the accompanied high porosity they exhibit in addition to the low density. All three
materials, especially the aerogel and cabosil, consist of a high volumetric percentage of<br />
air which reaches in the case of aerogel approximately to 99%. The presence of air in<br />
these filler materials a significant has effect on their attenuation behavior since the<br />
measured transmitted profiles resembled typical air blast profiles. The transmitted<br />
pressure profiles for test samples containing these filler materials include a negative<br />
phase very much similar to the profiles of the corresponding incoming wave (Figure<br />
5.5-1). This feature is not present in the profiles of the other solid and fluid filled<br />
samples. In general, the blast attenuation capabilities of these three materials are<br />
inferior to the other denser materials, both solid and fluid. The profiles for the aerogel<br />
and cabosil (lighter materials) exhibit positive small phase duration, comparable to the<br />
free field and solid foam measurements. The positive duration phase is feature a that is<br />
of interest to increase in order to increase the time scale the of transmitted wave.<br />
Specifically, the duration of the transmitted wave for the aerogel case is almost identical<br />
to the free field measurement while the duration for the cabosil sample filled is smaller.<br />
Both durations are shorter than the positive phase duration corresponding to the<br />
benchmark solid foam case. In regard to peak transmitted pressure, the aerogel filled<br />
sample exhibits a 6% increase compared to the benchmark case, while cabosil the<br />
demonstrates a 14% increase compared to the solid sample. foam The measured<br />
transmitted impulse of the aerogel and cabosil sample is 14% and 30% larger than the<br />
transmitted impulse of the benchmark case respectively. The expanded spray foam<br />
sample measurements demonstrate better attenuation characteristics than the low<br />
density filler materials, though clearly inferior to the higher density materials.<br />
Specifically, the transmitted impulse exhibits an increase of 25% compared to the<br />
control sample, while on the other hand, the recorded peak pressure shows a 7%<br />
decrease and positive duration is longer than the foam sample. Of interest is the fact<br />
that the transmitted wave for the expanded foam sample the has longest rise time (time<br />
required from wave arrival to peak pressure) of all tested samples. This parameter<br />
indicates an enhanced smoothening effect on the pressure gradient. The arrival time of<br />
the wave is almost same the for all three materials, a consequence of the strong presence
of air in all the three materials. The reader may consult Table 5.5-1 which contains all<br />
the measured parameters of the transmitted waves for all material configurations.<br />
C)<br />
0<br />
(A0<br />
2 L - L L -L ---<br />
-- Solid<br />
-Cabosil<br />
15 -Expanding Foam<br />
-Aerogel<br />
- 1<br />
C<br />
L- 05<br />
-&<br />
52 .<br />
Time from trigger (ms)<br />
Figure 5.5-1: Transmitted pressure profiles for the solid foam, aerogel, cabosil and expanding foam filled<br />
test samples<br />
It is also interesting to analyze the power spectral density (PSD) of the transmitted<br />
waves in the frequency domain. Comparisons are made to both the free field<br />
measurement and the transmitted wave of the benchmark case. As indicated in Figure<br />
5.5-2, the free field signal decays a steady to state magnitude at an approximate<br />
frequency of 100 KHz while the transmitted wave reaches a steady state at<br />
approximately 10 KHz. aerogel The and cabosil samples reach their steady state at a<br />
magnitude of approximately 10 KHz, while, on the other hand, the expanded foam<br />
sample displayed steady behavior approximately at 3 KHz. power The magnitude for<br />
all three materials exhibits higher values than the wave corresponding to the
enchmark case for frequencies below 1 KHz; however this trend is reversed for larger<br />
frequency values. Based on the power spectrum in the frequency domain it becomes<br />
evident that the expanded foam further illustrates its blast attenuation superiority<br />
compared to the low density materials.<br />
0<br />
-- 16" Free-Field<br />
- Solid<br />
- Cabosil<br />
-20 ---- Expanding Foam<br />
-- AerogeI<br />
-30 --- --<br />
N<br />
i -40 c-<br />
Q1)<br />
-50 -- - ---<br />
0-60 --- \-<br />
-00 2<br />
10 10~ 10<br />
Frequency (Hz)<br />
Figure 5.5-2: PSD graph for free-field, solid foam, aerogel, cabosil and expanding foam filled test samples<br />
The measured profiles of the samples containing high density solid materials, Figure<br />
5.5-3, demonstrate superior attenuation behavior compared to the previously analyzed<br />
low and mid density solid materials. The high density solid materials include the glass<br />
shot and volcanic tuff. Due to the lower level of porosity and ultimately the less<br />
significant presence of air, these materials act as a true layer of solid between the two<br />
foam layers. Peak transmitted pressure for both contained materials was smaller than
the benchmark case with a 45% and 35% reduction for the glass shot and tuff case<br />
respectively. Figure 5.5-3 indicates that the arrival time for the glass shot case is<br />
approximately 0.5 ms smaller than the tuff case, which notably is the longest for all<br />
examined materials. This measurement is consistent with the higher density of glass<br />
shot resulting in a higher sound velocity. In regard to the positive phase duration, the<br />
profile for the tuff displays a similar behavior to the benchmark case while the glass<br />
shot duration is significantly higher. This behavior is also present in the impulse<br />
measurements since tuff exhibits a slight 5% decrease over the solid foam whereas glass<br />
shot demonstrates a 22% decrease. Examination of the PSD graph of the high density<br />
materials (Figure 5.5-4) shows that their magnitude is lower than the magnitude of the<br />
benchmark case throughout the frequency domain until steady state. Both of the<br />
materials reach steady state at approximately 10 KHz, marginally earlier than the<br />
benchmark case. Comparing the two materials it is evident that the use of glass shot<br />
offers a higher level of attenuation since it displays better characteristics in all<br />
parameters that are of interest. However, it should be noted that the tuff outperforms<br />
the low density filler materials in almost all areas (except duration of positive phase<br />
compared to expanded foam).
0<br />
0.5<br />
1.<br />
-0.5<br />
11 , , : -__ , rII<br />
_ _ _ _<br />
-<br />
___._ I__ I_,_I_<br />
0 0-5 1 1.5 2 2.5<br />
Time from trigger (ms)<br />
Figure 5.5-3: Transmitted pressure profiles for the solid foam, volcanic tuff and glass shot filled foam<br />
samples<br />
0<br />
-10 - - - - -Solid<br />
-Tuff<br />
-- 16" Free-Field<br />
-20 - - - - - - - Glass Shot<br />
-30 - - ------<br />
N__<br />
S-40<br />
V<br />
-50 - - A--<br />
-60<br />
-80<br />
-90<br />
-,100 24 5<br />
102 10 10 10<br />
Frequency (Hz)<br />
Figure 5.5-4: PSD graph for free-field, solid foam, volcanic tuff and glass shot filled test samples<br />
100
The final category of examined materials includes the fluid fillers. Water and<br />
glycerin were tested in order to assess their attenuation capabilities. The pressure<br />
profiles for the fluid filled samples are shown in Figure 5.5-5. In general, their<br />
performance is quite similar to the high density materials and especially that of the<br />
glass shot. Specifically, the duration is longer than the solid foam benchmark case with<br />
the glycerin filler exhibiting slightly longer duration than the water but also slightly<br />
shorter than the glass shot. The transmitted waves for both fluid fillers require a longer<br />
time period to reach the measurement location than the benchmark case. The use of<br />
glycerin reduces the peak pressure by 48%, notably the largest decrease observed with<br />
all materials, while the reduction observed with water is approximately 34%. In regard<br />
to impulse, the use of water increases the transmitted impulse by 5.5%, while glycerin<br />
decreases the impulse by 5.5%. The PSD graph (Figure 5.5-6) indicates that the fluid<br />
materials reach steady state earlier in the frequency domain than any other material at<br />
approximately 1.3 KHz. Even though the differences observed between water and<br />
glycerin are not very significant the measured blast parameters may indicate that fluids<br />
with high viscosity may offer some advantages.<br />
101
CL<br />
(0)<br />
0.5<br />
0<br />
-0.5<br />
IN-A<br />
10 0 5 1.5 2 2.5<br />
Time from trigger (ms)<br />
Figure 5.5-5: Transmitted pressure profiles for the solid foam, water glycerin and filled foam samples<br />
0<br />
-16" Free-Field<br />
-10 - -- -- - Solid<br />
-Water<br />
-20 -- -Glycein -<br />
-30 - - -<br />
o -40 -<br />
-50N<br />
o-607 -<br />
0. 11I,41jMAI I I 6<br />
Figure 5.5-6: PSD graph for free-field,<br />
Frequency (Hz)<br />
foam, solid water and glycerin foam filled samples<br />
102
Pree-Pieict<br />
5.19 0.57 1.13 0.02<br />
Solid 0.36 0.74 1.27 0.10 0.86<br />
Cabosil 0.47 1.00 0.98 0.40 0.98<br />
Aerogel 0.41 0.81 1.14 0.55 0.91<br />
Expanded Foam 0.45 0.80 1.42 0.82 0.80<br />
Tuff 0.34 1.26 1.31 0.57 0.56<br />
Glass Shot 0.28 0.76 1.68 0.43 0.47<br />
Water 0.38 0.83 1.53 0.60 0.57<br />
Glycerin 0.34 0.86 1.58 0.43 0.45<br />
Table 5.5-1: Measured blast parameters for all test configurations [21]<br />
The following Figure 5.5-7 is combination a<br />
of four frames taken by the high speed<br />
camera deployed in order to capture the incoming, reflected and transmitted waves<br />
with the help of the shadowgraph imaging technique. The tested sample in the picture<br />
is that of the benchmark solid foam case. The incoming wave is captured in the first<br />
frame, while the second one captures the reflected component. The third frame is of<br />
interest as it clearly depicts the isolated transmitted wave inside the Plexiglas chamber.<br />
Components of the incoming wave that converge around the sides of the sample are<br />
clearly shown to move tangentially along the outer sides of the chamber. The last frame<br />
depicts the arrival of the detonation products at the site of the test sample.<br />
103
Figure 5.5-7: Shadowgraph images during blast of solid foam [21]<br />
5.5.2 Attenuation - Blast Intensity Study<br />
The previous experiments involved foam samples a number containing of filler<br />
materials which were subjected to a single blast intensity level. In an effort to examine<br />
the attenuation capabilities of a sample varying at blast intensities, a single sample<br />
configuration was chosen and tested at two additional blast levels. The sample<br />
104
configuration that was selected for this parametric study contains aerogel as the filler<br />
material. The aerogel filler material used was to due its better distinguishable pressure<br />
profile characteristics compared to the remaining materials candidate as indicated by<br />
previous pressure measurements.<br />
In order to modify the blast intensity, the sample was placed closer the to mouth of<br />
the shock tube. Subsequently, one sample was tested at a standoff distance of 8 inches<br />
with a corresponding location measurement (taking into account sample depth) of 12<br />
inches from the mouth of the shock tube. The other sample was tested at a standoff<br />
distance of 4 inches, hence a measurement location of 8 inches [21]. Obviously, by<br />
decreasing the standoff distance the magnitude of the shock wave is increased without<br />
any need to increase the mass of the used PETN charges. Both measurement locations<br />
are at distances at which the free field pressure of the incoming blast wave has been<br />
measured, as shown in Figure 5.4-1. Attenuation effectiveness is assessed by comparing<br />
blast parameters corresponding to the measurement location to the free field location of<br />
equal distance. For instance, when evaluating the case where the sample has been<br />
placed at a standoff distance of 8 inches the from shock tube, the wave profiles obtained<br />
from the 12 inch measurement location are compared to the 12 inch free field location.<br />
The reader is directed to Figure 5.5-8 where the appropriate comparisons are noted.<br />
The measured profiles pressure at these higher blast intensities exhibit similar<br />
characteristics to the profiles obtained at lower blast levels, maintaining air blast profile<br />
characteristics. This behavior is attributed to the high level of porosity in the aerogel as<br />
discussed in Chapter 5.5.1. Attenuation in terms of peak pressure seems to increase with<br />
the increase of load. The peak pressure attenuation is 94% for the 12 inch standoff<br />
distance case, 95% for 8 inch standoff while for the 4 inch standoff case the attenuation<br />
reaches 97.5%. On the other hand, if impulse measurements serve as an indication of<br />
attenuation the opposite trend is observed; attenuation effectiveness decreases with the<br />
increase of loading. Specifically, for the 12 inch standoff, attenuation of 92% in terms of<br />
positive impulse is recorded, 90.5% for 8 inch standoff and finally 88% for 4 inches. An<br />
interesting feature of this parametric study is the enhancement of the temporal<br />
105
distribution of the transmitted wave compared to the free field measurement with<br />
increasing blast intensity. The duration of the positive phase compared to the respective<br />
free field measurements is 0.9% larger for the 12 inch standoff case, 15% larger for 8<br />
inches and 163% larger for the highest blast magnitude. Finally, observation of Figure<br />
5.5-8 indicates that that the positive phase of the transmitted waves is strongly<br />
influenced by the magnitude of the blast wave, the while negative phase seems to be<br />
more independent. The measured blast parameters for the blast magnitude parametric<br />
study are presented in Table 5.5-2.<br />
-0~<br />
*0<br />
4<br />
Compare to<br />
I unmitigated blast<br />
of~100 psig<br />
-AerogeM-12inch<br />
-Aerogel-inch<br />
-Aeroge-4inch<br />
Compare to<br />
unmitigated blast<br />
of~-25 psig<br />
Compare to<br />
unmitigated blast<br />
of~-15 psig<br />
0.5 1 1.5 2 2.5 3<br />
Time from trigger (ms)<br />
Figure 5.5-8: Blast profiles for blast intensity parametric study at 12 inch, 8 inch and 4 inch standoff<br />
distance [21]<br />
106
16 " Free - Field 5.19 0.57 1.13 0.02 15<br />
12" Aerogel 0.41 0.81 1.14 0.55 0.91<br />
12 " Free - Field 5.00 0.39 0.81 0.02 24.82<br />
8" Aerogel 0.47 0.67 0.93 0.86 1.25<br />
8 " Free - Field 10.68 0.21 0.43 0.04 108.1<br />
4' Aerogel 1.26 0.51 1.13 0.87 2.72<br />
Table 5.5-2: Blast parameters for blast intensity parametric study at 12 inch, 8 inch and 4 inch standoff<br />
distance [21]<br />
107
108
6 Numerical Simulation of Material Response under<br />
Impulse Loading<br />
The simulations described and presented in this chapter study the response of foam<br />
samples subjected to impulse loading. The samples that are tested under these loading<br />
conditions include specimens which contain both single and dual cavities in addition to<br />
solid foam specimens. The simulations conducted serve a as a preliminary investigation<br />
of the possible attenuation effects due to the presence of filler materials inside a<br />
specimen compared to the response of solid a foam sample plate.<br />
In all following simulations the samples are subjected to a pressure pulse on a<br />
portion of their surface top while their response on the bottom surface is measured. The<br />
modeling is based on the use of a Lagrangian mesh to model the foam samples while<br />
specific cavity modeling techniques in ABAQUS 6.7 are employed to describe the<br />
behavior of the internal cavities.<br />
6.1 Simulation and Specimen Description<br />
The flat plate specimens that were modeled were of 10 in x 10 in x 1 in external<br />
dimensions with a partitioned circular loading surface on the top surface of 2.75 inches<br />
radius. The loading was applied to a portion of the top surface corresponding to<br />
approximately 24% of the top surface area, simulating a spatially localized impulse<br />
rather than a true shock loading where the shock would engulf the whole plate. The<br />
application of such a loading condition provides a local high pressure magnitude area,<br />
allowing the clearer identification of the effects of the filler materials on the attenuation<br />
109
and spatial distribution of the resulting stress waves inside the material. The solid foam<br />
specimen with the loading surface is depicted in the following Figure 6.1-1.<br />
Figure 6.1-1: Foam specimen<br />
In addition to the solid foam specimen, two other configurations were tested; a<br />
single (Figure 6.1-2) and a dual cavity configuration (Figure 6.1-3). Both configurations<br />
maintain the same external dimensions and loading surface of the solid foam specimen.<br />
The single cavity configuration has a foam core of 10 in x 8 in x 0.5 in dimensions<br />
removed from the center of a solid foam specimen whereas the dual cavity<br />
configuration has two foam cores of 10 in x 3.25 in x 0.5 in dimensions removed. In both<br />
cases the formed cavities span from one end of the sample to the other, while 1 inch<br />
internal foam supports are maintained on two sides of both cavity configuration<br />
specimens.<br />
110
Figure 6.1-2: Single cavity configuration<br />
Figure 6.1-3: Dual cavity configuration<br />
In the case of both single and dual cavity configuration models it is necessary to<br />
predict the mechanical response of the fluid filled structure. A primary difficulty in<br />
such an application is the coupling between the deformation of the structure and the<br />
pressure exerted by the contained fluid on the structure. For this reason, in order to<br />
111<br />
Mmmbw
model the response of the cavity configurations the "fluid-filled cavity" technique of<br />
ABAQUS 6.7 has been employed. This technique assumes that the whole cavity is filled<br />
with fluid of the same properties and state; that is, effects such as sloshing cannot be<br />
modeled. Furthermore, another limitation of this model is that it considers constant<br />
pressure throughout the whole cavity; hence, pressure gradient movement cannot be<br />
modeled. The employed technique requires that the whole cavity be defined by an<br />
element based surface with normals pointing to its interior. The underlying elements<br />
can be either solid, in regions where the cavity is inside a solid domain, or surface<br />
elements that model holes in the structure where solid elements are absent [45]. For<br />
instance, in the case of the single cavity configuration, the faces of the solid elements<br />
that surround the cavity and are part of the foam region can be used in order to define<br />
the surface of the cavity that is inside the foam specimen. However, the cavity is open<br />
on two sides since it spans the whole length of the specimen. For this reason, two<br />
supplementary surface regions, named "fictitious walls" according to the ABAQUS<br />
manual, have been employed to completely define the cavity and are placed at the two<br />
free ends of the opening. They are modeled using surface elements of almost zero<br />
density and thickness in order not to affect the structural response of the model [63].<br />
One of these surface regions is illustrated in the following Figure 6.1-4 and corresponds<br />
to the grey region. It should be noted that in the case of the dual cavity configuration<br />
four surface regions have been used in accordance with the previously described<br />
procedure.<br />
Fluid exchange between the filler materials inside the cavity and the environment is<br />
modeled through the use of appropriate fluid exchange models in ABAQUS [45]. The<br />
previously mentioned "fictitious walls" act solely as a numerical defining boundary for<br />
the cavities. By defining these walls as fluid exchange surfaces and by defining the<br />
effective surface of the fluid exchange mechanism equal to the surface of the "fictitious<br />
walls", fluid can be displaced unhindered from the interior of the cavities under the<br />
effect of the loading [45, 63].<br />
112
Figure 6.1-4: Surface element region used to define fluid cavity<br />
The loading conditions correspond to a pressure pulse of 1 ms duration applied to<br />
the circular loading surface. Three loading magnitudes were investigated; 1 atm, 2 atm<br />
and 3 atm. In regard to the applied boundary conditions, all translational degrees of<br />
freedom were constrained on the nodes of the bottom surface.<br />
EPS foam of density p=85 kg/m 3 was used to model the solid regions. The<br />
CRUSHABLE FOAM material option was used to describe the behavior of the EPS with<br />
the material properties and stress-strain curves described in Chapter 4. 3D linear solid<br />
continuum elements with enhanced hourglass control were used to discretize the solid<br />
regions of the samples while linear surface elements with almost zero thickness were<br />
used to discretize the "fictitious walls". The edge size of the elements for all three<br />
sample configurations range from 2mm to 3.2mm thus generating approximately 70,000<br />
elements for the solid foam configuration, 51,000 elements for the single cavity<br />
configuration and 54,000 for the dual configuration. The following Figure 6.1-5 depicts<br />
the mesh used for a dual cavity configuration simulation.<br />
113
Figure 6.1-5: Mesh dual for cavity configuration<br />
Due to the dynamic nature of the phenomenon under study, the ABAQUS / Explicit<br />
procedure was used. This algorithm integrates through time by using many small time<br />
increments. However, this process is conditionally stable and depends on the use of a<br />
time increment which is smaller than a critical value. An approximation of this stability<br />
limit is often written as the smallest transit time of a dilatational wave across any of the<br />
elements in the mesh [45]:<br />
----------<br />
At ~m Equation 6.1-1<br />
where Lmin: is the smallest element dimension in the mesh<br />
Cd: dilatational wave speed<br />
Cd<br />
114
The dilatational wave speed is given as a function of the effective Lame constants 2,<br />
P and the material density p as [45]:<br />
Cd = +24 Equation 6.1-2<br />
p<br />
However, during the material response under impulsive loading it was necessary to<br />
reduce the default calculated time stability limit to 10% of its initial value since the<br />
calculated velocities inside solid elements obtained supersonic values.<br />
6.2 Impulse Loading Simulation Results<br />
This chapter is devoted to the results obtained from the impulse loading simulations<br />
and focuses on two primary topics. The pressure history of selected elements on the<br />
bottom surface of the samples is considered to reflect the attenuation capabilities of the<br />
tested configurations. Therefore, the first paragraph focuses on analyzing the profiles of<br />
the investigated configurations at specific points and the identification of areas of high<br />
stress concentration while applying a loading of 2 atm magnitude. The second topic<br />
investigates the consistency of the previously observed behavioral trends at alternate<br />
loading levels.<br />
6.2.1 Pressure Response at 2 atm Loading Conditions<br />
The pressure profiles of the elements on the bottom surface of the specimens are<br />
considered in order to determine the effectiveness of the specimens against the applied<br />
115
loading. The solid sample and both cavity configurations are geometrically symmetric<br />
in the x and y axes, therefore a number of key elements were probed in order to track<br />
their pressure response. The following figure depicts all the elements on the bottom<br />
surface of the dual cavity configuration, while the eight highlighted elements (A, B, C,<br />
D, G, H, J and L) are the individuals that were probed. The black circle in the figure<br />
corresponds to the loading surface on the top surface of the samples; the two black lines<br />
along the sample signify one of the two cavities inside the dual cavity configuration<br />
while the red lines indicate the cavity inside the single cavity samples. The majority of<br />
the probed elements were selected as projections of significant points inside the cavities<br />
on the bottom surface of the sample. In the case of the single cavity configuration all<br />
elements correspond to projections of points inside the cavity, however in the case of<br />
the dual cavity configuration a number of these elements do not have a layer of filler<br />
material above them.<br />
1.625'<br />
2.4375'<br />
3.25'<br />
Figure 6.2-1: Probed elements of bottom surface<br />
116
Air at Pal= atm and Ta = 200C ambient conditions and water were used as filler<br />
materials for the single and dual cavity configuration models. Therefore, for each<br />
applied loading magnitude five simulations were undertaken; a solid foam case, two<br />
single and two dual cavity configurations using the two filler materials. The pressure<br />
profiles for each one of the eight highlighted elements of interest will be compared for<br />
the five simulations. The initial loading magnitude was set to 2 atm.<br />
The following Figure 6.2-2 refers to the pressure profiles of element A; the center<br />
element of the back surface. The figure indicates a resemblance between the profiles of<br />
the solid and both air and water filled dual cavity samples. This behavior is to be<br />
anticipated since for all three configurations there are no material interfaces along the<br />
thickness of the plate at that point. The pressure levels for the two dual cavity<br />
configurations are elevated compared to the solid foam sample. The peak pressure for<br />
the two dual configurations is approximately 0.25 MPa compared to 0.16 MPa for the<br />
solid specimen. The main difference between these three profiles is the evident plastic<br />
deformation that the dual cavity samples experience, illustrated by the residual stresses<br />
after the loading application. The residual stresses maintain a magnitude of<br />
approximately 0.06 MPa 1ms after ceasing the loading. In regards to the performance of<br />
the single cavity configurations, the peak pressure levels are significantly higher for<br />
both air and water fillers compared to the other three samples. The single cavity<br />
configurations illustrate high positive (approximately 0.4 MPa) and negative pressure<br />
values (less than -0.45 MPa) with residual stress levels at approximately -0.2 MPa.<br />
117
[xl.E6]<br />
0.4<br />
00<br />
-0.44<br />
0.0 1.0 2.0 3.0 4. 5.0 6.0 [x1 E-3}<br />
Time [s]<br />
Figure 6.2-2: Pressure profiles at element A of bottom surface at 2atm loading<br />
press A Air dual 2atm<br />
- - press A Air single 2atm<br />
press A H20 dual 2atm<br />
-- --- - press A H20 single 2atm<br />
--- press A solid 2atm<br />
The location of elements D and G is geometrically similar to element A since there<br />
are no material interfaces along the thickness of the plate at their coordinates in the case<br />
of the solid and dual cavity samples. Accordingly, at element D the pressure profiles of<br />
the dual cavity configurations are similar to the solid foam, Figure 6.2-3. The peak<br />
pressure for both air and water filled dual cavity samples are marginally higher than<br />
the measured response of the foam at approximately 0.1 MPa; however, their profiles<br />
do not seem to include as many oscillations as that of the foam case. Additionally, solid<br />
foam and dual cavity cases do not illustrate the development of any significant residual<br />
stresses after the loading has stopped which indicates the absence of plastic<br />
deformation. The response, however of both single cavity configurations, includes large<br />
amplitude oscillations. This behavior may be due to the large surface area of the<br />
internal cavity or may indicate the absence of sufficient restoring force in the numerical<br />
model. The water filled single cavity case illustrates the highest peak pressure value at<br />
118
0.325 MPa approximately, while the air filled single cavity exhibits a similar behavior<br />
with 0.2 MPa peak pressure.<br />
[x1.E6]<br />
0.30<br />
1.0 2.0 3.0 4.0 5.0 6.0 [x1.E-]<br />
Time [s]<br />
Figure 6.2-3: Pressure profiles at element D of bottom surface at 2atm loading<br />
press D Air dual 2atm<br />
press Air single D 2atm<br />
- - -- -<br />
press D H20 dual 2atm<br />
press D H20 single 2atm<br />
- press D solid 2atm<br />
Element G lies outside the projection of the circular loading surface on the bottom<br />
surface, thus the measured pressure profiles are anticipated to be of lower magnitude.<br />
The peak pressure values for the foam and water dual cavity samples do not exceed<br />
0.04 MPa while the response for the air dual cavity is marginally higher than 0.04 MPa.<br />
During the first millisecond of the simulation, the pressure response of the cavity<br />
models follow the pressure levels of the foam. However, after the loading stops, the<br />
single cavity samples and especially the water filled record the smallest pressure, as<br />
opposed to the dual cavity configurations which maintain higher pressure values than<br />
the foam case throughout the remaining simulation.<br />
119
[xl.E6]<br />
0.04<br />
O'- 002<br />
0.00 KA J I<br />
-0.041<br />
0.0 1.0 2.0 3.0 4.0 5.0 6.0 [x1.E-3]<br />
Time [s]<br />
press G Air dual 2atm<br />
- press G Air single 2atm<br />
press G H20 dual 2atm<br />
- - - - - press G H20 single 2atm<br />
- - press G solid 2atm<br />
Figure 6.2-4: Pressure profiles at element G of bottom surface at 2atm loading<br />
Elements B, C and H constitute the next group of elements of interest due to their<br />
similar geometric position in regard to the dual cavity configuration (Figure 6.2-1). The<br />
profiles at element B are depicted in Figure 6.2-5. The profiles of all four cavity models<br />
are significantly different than the control, solid foam case. All four cavity models<br />
exhibit a 3.5 times greater peak pressure than the foam model at a peak of<br />
approximately 0.35 MPa. It is evident that the profiles of the single cavity cases illustrate<br />
large numerical oscillations, while the profiles of the dual cavity models exhibit<br />
significant damping effects leading them to equilibrium.<br />
120
[x1 E6]<br />
0.35-<br />
0.30-<br />
0.254<br />
0.20<br />
0.15<br />
0.10<br />
-0.05<br />
-0.05~<br />
- i-<br />
0.0 1.0 2.0 3.0 4.0 5.0 6.0 [x13-3]<br />
Time [s]<br />
Figure 6.2-5: Pressure profiles at element B of bottom surface at 2atm loading<br />
.'~<br />
- ----<br />
----press<br />
B Air dual 2atm<br />
press B Air single 2atm<br />
press B H20 dual 2atm<br />
press B H20 single 2atm<br />
press solid B 2atm<br />
The two following figures correspond to elements C Figure 6.2-6 and H Figure 6.2-7<br />
both positioned outside the area of influence of the loading surface. The measured<br />
profiles of all four cavity models exhibit consistently lower pressure values than the<br />
foam control sample at both measuring locations. The dual cavity samples seem to not<br />
only develop smaller pressure values compared to their single cavity counterparts with<br />
the same filler material but to also demonstrate a smoother behavior. The water filled<br />
dual cavity model demonstrates significantly lower pressure values than the remaining<br />
samples at both C and H location; the peak pressure value at location C is<br />
approximately 3.5 KPa while at H less than 2 KPa. At both measuring locations the air<br />
filled samples consistently exhibit oscillatory behavior especially after the applied<br />
loading has ceased (1ms). In general, the profiles corresponding to element H exhibit<br />
smaller pressure magnitudes than the respective curves at element C. This is chiefly<br />
evident in the solid foam and water filled model profiles. This behavior is due to the<br />
larger distance of element H from the loading surface.
[x1.E3]<br />
40.1-<br />
30.-<br />
10.<br />
20.<br />
-20. -<br />
-30. L<br />
[x1.E3]<br />
0.0 .L.V 4x<br />
6.0 [x1.E-3]<br />
Time [s]<br />
15,<br />
10.<br />
5,<br />
10.<br />
-5.<br />
-10.<br />
-15.<br />
Figure 6.2-6: Pressure profiles at element C of bottom surface at 2atm loading<br />
-. V2 .6.V D.V<br />
Time [s]<br />
Figure 6.2-7: Pressure profiles at element H of bottom surface at 2atm loading<br />
122<br />
press C Air dual 2atm<br />
- - - press C Air single 2atm<br />
_ _ press C H20 dual 2atm<br />
- - - - - press C H2O single 2atm<br />
press C solid 2atm<br />
6.0 [x1.E-3]<br />
press H Air dual 2atm<br />
press H Air single 2atm<br />
press H H20 dual 2atm<br />
press H H20 single 2atm<br />
--- press H solid 2atm
The calculated profiles J (Figure at 6.2-8) and L elements (Figure 6.2-9) exhibit a<br />
similar behavior to the profiles at elements C and H since they are also outside the<br />
applied loading region. The water filled dual cavity model displays superior behavior<br />
with pressure peaks of well under 5 KPa and the absence of oscillations after the<br />
applied loading.<br />
[X1.E3]<br />
40.-<br />
30.<br />
230.<br />
00 10 2.0 30 40 50 60 [x13-3]<br />
Time [s]<br />
Figure 6.2-8: Pressure profiles at element J of bottom surface at 2atm loading<br />
123<br />
press.] Air dual 2atm<br />
----- press.] Air single 2atm<br />
press.J H20 dual 2atm<br />
- - - - press J H20 single 2atm<br />
- - press J solid 2atm
[xl.E3]<br />
20<br />
-20-<br />
0. 10 20 3!0 4.0 5!0 6.0 [x1.E-3]<br />
Time [s]<br />
Figure 6.2-9: Pressure profiles at element L of bottom surface at 2atm<br />
press L Air dual 2atm<br />
press L Air single 2atm<br />
press L H20 dual 2atm<br />
- - - -- press L H2 single 2atm<br />
_. press L solid 2atm<br />
The pressure profiles at specific locations of interest are useful in following the<br />
detailed response of these elements throughout time. However, this approach is limited<br />
to tracking a small number of elements. In order to determine which elements of the<br />
bottom surface are subjected to the largest pressure throughout values the whole<br />
simulation duration and to investigate the spatial distribution of the incoming energy,<br />
the following quantity was calculated for each element of the bottom surface:<br />
Ibs () = f jp(it)|dt Equation 6.2-1<br />
where p(2, t) : pressure-time profile for each element<br />
Equation 6.2-1 is similar to the definition of impulse in given Chapter 3.1. The<br />
difference lies in the integration of the absolute pressure values through out time. The<br />
absolute pressure values have been used as an indication of the stress levels that the<br />
124
elements have experienced; the use of the absolute value ensures that a high positive<br />
pressure level is not neutralized by a low negative value. The calculated I, (i) of each<br />
element of the bottom surface is not an accurate measurement of the transmitted<br />
impulse through the plate since the previous pressure profiles have indicated that a<br />
number of elements retain residual stresses through out the duration of the simulation.<br />
Therefore, the following plots should solely be taken into account in order to<br />
qualitatively identify high stress concentration areas. The five graphs that follow depict<br />
the elements of the bottom surface of each sample and are colored in accordance to their<br />
Ib, (i) value. Furthermore, the red circle on the graphs corresponds to the projection of<br />
the loading surface on the bottom surface while the color bar on the right is common for<br />
all graphs and its highest value was determined from the highest calculated value<br />
Ib., (i) of all simulations.<br />
D.05 0.1 0.15 0.2<br />
Figure 6.2-10: Integrated absolute pressure values for bottom surface of solid EPS foam at 2 atm loading<br />
conditions<br />
125
0.1 -<br />
0 -<br />
-0.05-<br />
3.05 0-<br />
1.05<br />
-0.1-<br />
I I I I<br />
-0.15 -0,1 -0.05 0 0.05 0.1 0.15<br />
Figure 6.2-11: Integrated absolute pressure values for bottom surface of air filled dual cavity<br />
configuration at 2 atm loading conditions<br />
-010<br />
Figure 6.2-12: Integrated absolute pressure values for bottom surface of water filled dual cavity<br />
configuration at 2 atm. loading conditions<br />
126<br />
16<br />
11C
0.05<br />
0<br />
-0.05<br />
-0.1<br />
005 -<br />
-Gas F<br />
-.15 -0.1 -0.05 0 0.05 0.1 0.15<br />
Figure 6.2-13: Integrated absolute pressure values for bottom surface of air filled single cavity<br />
configuration at 2 atm loading conditions<br />
-0 15 -0.1 -0,05 0 005 0.1 015<br />
Figure 6.2-14: Integrated absolute pressure values for bottom surface of water filled single cavity<br />
configuration at 2 atm loading conditions<br />
127
Observation of Figure 6.2-10 corresponding to the solid EPS foam case, reveals low<br />
levels and homogeneous spatial distribution of the accumulated stress throughout the<br />
entire bottom surface during the entire simulation. Careful inspection of the graph<br />
indicates that the regions of highest stress concentration span radialy from center the of<br />
the plate to the four corners and reach a maximum of approximately I, (i) = 170 Pa s.<br />
The following two figures, Figures 6.2-11 and 6.2-12, refer to the air and water filled<br />
dual cavity models respectively. Both cases exhibit a similar behavior with the regions<br />
of high stress concentration being located primarily inside the projected loading surface<br />
taking the form of two ellipsoids parallel to the cavity direction. It is interesting to note<br />
that the foam regions beneath the internal foam sample supports are subject to higher<br />
pressure levels than the regions beneath the fluid cavities. The maximum value of the<br />
absolute pressure impulse reaches I,,b (i) = 815 Pa s for the air filled dual cavity and<br />
Iabs(i) = 878 Pa s for the water filled. Figures 6.2-13 and 6.2-14 refer to the air and water<br />
filled single cavity samples. The region inside the boundary of the projected loading<br />
surface and the elements in the center of the cavity develop the highest accumulated<br />
stress levels in both cases. The stress levels are higher in the air filled case with a<br />
maximum calculated 'abs(.() =1663 Pa s as opposed to a high value of Iabs (') 1373 Pa s<br />
for the water filled.<br />
6.2.2 Pressure response at Alternate Loading Conditions<br />
Paragraph 6.2.1 focused on the pressure behavior of the foam samples subjected to a<br />
pulse of 2 atm magnitude. In order to investigate whether the observed trends are also<br />
identifiable in alternate loading levels, the five configurations were subject to impulse<br />
loading of 1 atm and 3 atm.<br />
The following Figures 6.2-15 and 6.2-16 correspond to the pressure profiles at<br />
element A of all five configurations for both 1 atm and 3 atm loading conditions<br />
128
espectively. Comparison with the profiles at the same location subject to 2 atm loading,<br />
Figure 6.2-2, indicates that the profiles of the dual cavity cases continue to closely follow<br />
that of the foam sample during the first millisecond of the simulation. The higher the<br />
loading magnitude the higher the experienced stress levels in the dual cavity cases,<br />
while under increased loading levels the retained residual stress levels increase their<br />
magnitude from approximately 22 KPa for 1 atm loading to over 100 KPa for 3 atm. The<br />
response of the single cavity configurations seems to maintain the large amplitude<br />
oscillations. The peak pressure values appear to be consistent between loadings, while<br />
the residual stress levels increase in absolute magnitude from 1 atm to 2 atm. This trend<br />
is, however, reversed during the high loading scenario, where the magnitude of<br />
residual stress for both air and filled single cavity samples is less than that of the<br />
previous scenarios. This might indicate a different pattern in plastic deformation on the<br />
bottom surface due to the increase of loading. The behavioral patterns that are observed<br />
at point A under increased loading conditions are also exhibited in the pressure profiles<br />
at element D, which are placed in Appendix B.<br />
[xl.E6]<br />
0.4 -<br />
0.2<br />
-02-- -0.4<br />
~it'<br />
0....1...2...3...4.0.5.0.6...[x..E,3]<br />
t<br />
- - - - s<br />
-atm pres A soli<br />
-------- - - - prs -t A Ai sig-<br />
-0.4....<br />
0.0 1.0 2.0 3.0 4.0 5.0 6.0 [Xl.E-3]<br />
Time [s] _______________<br />
Figure 6.2-15: Pressure profiles at element A of bottom surface at latm loading<br />
129<br />
- press A Air dual 1 atm<br />
---- press A Air single Ilatmn<br />
- press A H20 dual Ilatmn<br />
---- press A H20 single Ilatin<br />
- press A solid 1latmn
[xl.E6]<br />
0.40 -<br />
0.20 ~;<br />
0.00<br />
-0.20-<br />
0.0 1.0 2.0 3.0 4.0 5.0 6.0 [xl.E-3]<br />
Time [s]<br />
-- press A Air dual 3atm<br />
- - - - - press A Air single 3atm<br />
press A H20 dual 3atm<br />
- - - - - press A H20 single 3atm<br />
- press A solid 3atm<br />
Figure 6.2-16: Pressure profiles at element A of bottom surface at 3atm loading<br />
Figures 6.2-17, 6.2-5 and 6.2-18 show the pressure profiles at location B under 1 atm,<br />
2 atm and 3 atm loading respectively. In all loading scenarios the peak pressure values<br />
are significantly higher than the solid foam values and increase with the application of<br />
higher pressure magnitudes. The magnitude of the residual stresses increase with the<br />
increase of loading for the dual cavity samples ranging from almost zero to - 0.1 MPa.<br />
In regards to the single cavity configurations, behavior similar to the one exhibited at<br />
location A is observed, where the residual stress level increases from 1 atm to 2 atm<br />
loading scenario while decrease they from 2 atm to 3 atm.<br />
130
[x1.E6]<br />
0.25<br />
0.20<br />
0.15<br />
0.10<br />
0.05<br />
0.00<br />
[x1E6]<br />
0.40<br />
0.30<br />
0.20<br />
0.10<br />
0.00<br />
-0.10<br />
0.0<br />
Time [s]<br />
[x1.E-3]<br />
press S Air dual latm<br />
- - - - press 8 Air single Iatm<br />
press B H20 dual Iatn<br />
- - - - press 8 H20 single latm<br />
press B solid latm<br />
Figure 6.2-17: Pressure profiles at element B of bottom surface at latm loading<br />
.0<br />
Time [s]<br />
[x1.E-3]<br />
press B Air dual 3atm<br />
- - - - - press 8 Air single 3atm<br />
press B H20 dual 3atm<br />
- - - - - press S H20 single 3atm<br />
press a solid atm<br />
Figure 6.2-18: Pressure profiles at element B of bottom surface at 3atm loading<br />
131
The profiles at locations C, H, J and L demonstrate similar trends and will be<br />
investigated through the profiles at location C. All these locations are outside the<br />
projected loading surface on the bottom surface and the profiles of all cavity models<br />
display lower pressure levels than the solid foam case. The water filled dual cavity<br />
sample consistently demonstrates the lowest pressure values which do not exceed 4<br />
KPa in any case. The single cavity configurations also exhibit lower pressure values<br />
than the control solid foam through out the loading regime. The reader may consult the<br />
Appendix B for the pressure history at plots the remaining locations.<br />
[x1.E3<br />
20.<br />
15.<br />
10.<br />
5.<br />
Q 0.<br />
-5.<br />
-10.<br />
-15.<br />
0.O0 3.0<br />
Time [s]<br />
6.0<br />
press C A ir dual latm<br />
- - - - press C Air<br />
single 1atm<br />
press C H 20 dual latm<br />
- - - - press C H 20 single latm<br />
- --.. press C s olid latm<br />
Figure 6.2-19: Pressure profiles at element C of bottom surface at latm loading<br />
132<br />
[x1.E-3]
[xl.E3]<br />
60<br />
-44<br />
-20.<br />
0press<br />
-~1 A4444<br />
CT solid4Satm<br />
pres C ir ual3at<br />
-20ess C H20 dual 3atm<br />
0.0 1.0 2.0 3.0 4.0 5.0 16.0 (xl.E-3]<br />
'4 .4 -~'44'4- -4 --4 - 4 pr ss C H2O ingl Sat<br />
Time [s] _____________<br />
- press C Air dual 3atn<br />
----- press C Air single 3atm<br />
- press C H20 dual 3atm<br />
----- press C H20 single 3atm<br />
- press C solid 3atrn<br />
Figure 6.2-20: Pressure profiles at element C of bottom surface at 3atm loading<br />
Increase of the applied loading does not only affect the absolute values of the<br />
accumulated pressure on the elements of the bottom surface but also the extent of the<br />
high stress concentration regions significantly. To illustrate this trend, the accumulated<br />
pressure contour plots corresponding to the water filled dual cavity configurations are<br />
presented for all three loading scenarios in Figure 6.2-21. The largest increase in<br />
pressure values and spatial distribution is concentrated inside the projected loading<br />
surface. On the other hand, the pressure levels at the elements underneath the internal<br />
foam supports of the sample seem constant. The trends identified in regard to the dual<br />
water filled sample are in compliance with the behavior of the remaining four tested<br />
configurations which are presented in the Appendix B.<br />
133
0.1-<br />
0,<br />
-0050-<br />
-01 -<br />
-016 -01 -0,05 1 0.05 tm 01<br />
0.10 0.1 00 0 005 0.1 015<br />
-01<br />
-0.1 -<br />
3 atm<br />
0.ao-010:-0.1--000 :: in<br />
-0.1<br />
-0.06<br />
-0.1<br />
1360<br />
-0.061190<br />
Figure 6.2-21: Integrated absolute pressure values for bottom surface of water filled dual cavity<br />
configuration<br />
134<br />
00<br />
0,05 0 0.15
6.3 Conclusions<br />
This chapter was devoted to the numerical simulation of impulse loading on flat<br />
foam samples with internal single and dual cavity configurations. The filler materials<br />
that were used were air and water, while three magnitudes of pressure loading were<br />
applied; 1 atm, 2 atm and 3 atm. Based on the results of all three loading scenarios, in<br />
general, the pressure profiles of the bottom surface elements of the water filled dual<br />
cavity configuration exhibit smaller magnitudes than the profiles of the other<br />
configurations. Elements outside the projection of the loading surface on the bottom<br />
surface experience significantly lower pressure values compared to solid foam samples.<br />
This response supports the idea that the use of filler materials inside internal cavities<br />
increases the attenuation of stress waves outside the immediate localized region of<br />
loading. This is also illustrated by calculating the integral of the absolute pressure<br />
through time for each element, where the high stress concentration levels are located<br />
primarily inside the projected loading surface. Additional high stress concentration<br />
areas are located near the foam supports inside the cavity models. Pressure<br />
measurements in most of the selected locations indicate that the response of the air<br />
filled cavities include large amplitude oscillations, an indication perhaps of small<br />
restoring and damping forces with the use of a low density filler material. Finally, the<br />
increase of loading from 1 atm to 2 atm provokes an increase in peak pressure values in<br />
all simulated configurations. However, this pattern was not consistently repeated in the<br />
3 atm loading case, where the magnitude of the peak pressure and residual stresses<br />
observed in many locations decreased.<br />
135
136
7 Numerical Simulation of Material Response under<br />
Shock Loading<br />
This chapter is devoted to the numerical modeling of the shock response in the foam<br />
samples tested experimentally. For this purpose, unlike the previous chapter where<br />
only the foam specimens were modeled and subjected to mechanical loading, both solid<br />
specimens and a portion of the surrounding air have been modeled and subjected to an<br />
incoming blast wave.<br />
The modeling of both solid and fluid domains requires the use of a coupled<br />
Eulerian-Lagrangian computational domain available in ABAQUS 6.9. The Lagrangian<br />
mesh is assigned to the solid geometry while the Eulerian mesh is primarily assigned to<br />
the surrounding air and to the fluid filler materials of the internal sample cavity.<br />
This chapter contains not only results from the response of the foam samples under<br />
shock loading but also essential initial diagnostic information concerning the validation<br />
of shock wave propagation through the air domain.<br />
7.1 Coupled Eulerian-Lagrangian Implementation in ABAQUS<br />
The use of coupled Eulerian-Lagrangian analysis is primarily used in the shock<br />
loading simulations of this chapter. Therefore, it is useful to explain the details of its<br />
implementation in ABAQUS in order to provide insight in its capabilities and<br />
functionality.<br />
In a traditional Lagrangian analysis nodes are fixed within the material, and<br />
elements deform as the material deforms. Lagrangian elements are always 100% full of<br />
a single material, so the material boundary coincides with an element boundary. On the<br />
137
other hand, in an Eulerian analysis nodes are fixed in space and material flows through<br />
elements that do not deform. Eulerian elements may not always be 100% full of<br />
material; many of them may be completely or partially filled with void. All Eulerian<br />
elements are initially filled with void. Initial conditions may be used to fill Eulerian<br />
elements with one or more materials the beginning at of the simulation. The Eulerian<br />
material boundary is computed during each time increment and generally does not<br />
correspond to an element boundary. By default, the Eulerian material can flow freely<br />
into and out of the Eulerian domain through mesh boundaries. If velocity is directed<br />
outward at a mesh boundary, either by prescribed conditions or naturally as a result of<br />
dynamic equilibrium, material flow may out of the Eulerian domain and is lost from the<br />
simulation with a corresponding decrease in mass and energy. On the other hand, if<br />
velocity is pointed inward the domain, inflow of material will occur. When materials<br />
flow into an element through a boundary face, the material content and the state of each<br />
inflowing material are equal to that which presently exists within the element [45].<br />
The Eulerian implementation in ABAQUS/Explicit is based on the volume-of-fluid<br />
method. In this method, material is tracked as flows it through the mesh by computing<br />
its Eulerian fraction volume (EVF) within each element. By definition, if a material<br />
completely fills an element, its EVF is one; if no material is present in an element then<br />
its EVF zero. is Eulerian elements may simultaneously contain more than one material.<br />
If the sum of all material fractions is less than one, the remainder of the element is filled<br />
with void, which has neither mass nor strength. The Eulerian time incrementation<br />
algorithm is based on an operator split of the governing equations, in resulting a<br />
traditional Lagrangian followed phase by an Eulerian phase. During the Lagrangian<br />
phase of the time increment nodes are assumed to be temporarily fixed within the<br />
material and the elements deform with the material. During the subsequent Eulerian<br />
phase deformation is suspended, elements with significant deformation are<br />
automatically remeshed and the corresponding material flow between neighboring<br />
elements is computed [45].<br />
138
The Eulerian-Lagrangian contact formulation is based on an enhanced immersed<br />
boundary method. In this method the Lagrangian structure occupies void regions inside<br />
the Eulerian mesh. The contact algorithm automatically computes and tracks the<br />
interface between the Lagrangian structure and the Eulerian materials. During the<br />
analysis the Lagrangian body pushes material out of the Eulerian elements that it passes<br />
through, and they become filled with void. Similarly, Eulerian material flowing toward<br />
the Lagrangian body is prevented from entering the underlying Eulerian elements. This<br />
formulation ensures that two materials never occupy the same physical space [45].<br />
7.2 Numerical Simulation of Shock Wave Propagation and<br />
Reflection<br />
The validation of numerical simulation shock wave propagation through air was<br />
considered to be of utmost importance. By comparing the numerically derived shock<br />
velocity and density ratio across the shock with the theoretical values, correct shock<br />
wave propagation in ABAQUS could be determined.<br />
To this end, an Eulerian air domain of 5m x 5m x 200m dimensions was created and<br />
meshed using 40 cubic Eulerian linear solid continuum elements of 5m edge length. The<br />
application of the desired loading was uniformly applied on the top face of the Eulerian<br />
domain while the amplitude was constant for the whole duration of the simulation.<br />
Since the concept of the proposed helmet liner design is based largely on employing<br />
FSI interactions to its advantage, an additional possible test using this configuration is<br />
the calculation of the reflection coefficient experienced after the reflection of the shock<br />
wave off a rigid surface. order In to calculate this coefficient, symmetry conditions at<br />
the bottom surface of the numerical domain are applied in order to simulate a rigid non<br />
moving surface with perfect reflection. The meshed computational domain employed<br />
139
for this study is depicted in the following Figure 7.2-1. The figure illustrates the<br />
pressure values during a time increment in which the incoming wave has not yet<br />
reached the bottom reflective surface.<br />
Figure 7.2-1: Air pressure values in computational grid<br />
Symmetry conditions were imposed on the side surfaces as to approximate an<br />
infinite air domain. In respect to the loading conditions that were applied on the top<br />
loading surface of the domain (Figure 7.2-1), two loading scenarios were examined. The<br />
first shock wave magnitude was set to 0.17 MPa, analogous to the experimental loading<br />
observed during the shock tube experiments and a second magnitude to 1.00 MPa<br />
(approximately six times the magnitude of the experimental loading). The duration of<br />
the simulation was determined at 1 s and 0.65 s for the low and high value loading<br />
140<br />
MW
scenarios respectively, adequate for the incoming wave to reflect off the bottom surface<br />
and propagate toward the top surface again.<br />
The two following figures illustrate the pressure profiles at four points (elemental<br />
integration points) inside the air domain at a distance of 2.5m, 112.5m, 117.5m and<br />
197.5m from the loading surface for both loading scenarios.<br />
Ix1. El j<br />
DIO<br />
DAD<br />
D.ZD<br />
D.D<br />
DiD D. D.SD D.SD IDD<br />
Time [s]<br />
Figure 7.2-2: Pressure profiles at 0.17 MPa loading<br />
141<br />
-- pressure 2.5 m<br />
-- pressure 112.5 m<br />
- pressure 117.5 m<br />
- pressure 197.5 m
[x1.E6J<br />
DAD DZD D.3D D. D D D "<br />
Time [s]<br />
Figure 7.2-3: Pressure profiles at 1 MPa loading<br />
pressure 2.5m<br />
pressure 112.5m<br />
-- pressure 11 7.5m<br />
pressure 197.5m<br />
The trend of the pressure profiles that are illustrated above, also observed in the<br />
density profiles that will be shortly presented, is due to the specific symmetry condition<br />
that has been applied on the lower surface of the domain (Figure 7.2-1). The initial jump<br />
in pressure is due to the incoming wave, while the second jump is due to the<br />
propagation of the reflected wave. One of the most interesting features of the two<br />
previous figures are the evident oscillations present at the moment that the incoming<br />
and reflected wave by pass the points of interest. The nature of these oscillations is<br />
numerical, as a result of the employed discretization scheme [64]. The artificial viscosity<br />
is however the subject of the next paragraph of this chapter and a parametric study is<br />
conducted in order to determine the most suitable values these for parameters. The<br />
values for the artificial viscosity that are used in this present test are in accordance with<br />
the optimum values derived from the numerical viscosity diagnostic tests.<br />
142
The density jump across the shock wave is another interesting feature to measure in<br />
order to validate proper shock wave propagation. The density ratio across the shock is<br />
inversely analogous to the ratio of the relative particle velocity across the shock<br />
according to Equation 3.2-15. Therefore, the compliance between theoretical and<br />
numerical values of the kinematic particle velocity can be measured through the density<br />
jump. The two following figures illustrate the air density at the same points of interest.<br />
LO<br />
Time [s]<br />
Figure 7.2-4: Density profiles at 0.17 MPa loading<br />
143<br />
density 2.5 m<br />
- density 112.5 m<br />
-- dersity 117.5 m<br />
-- density 197.5 m
a/7<br />
B DBDD Z MD DA D Dii Di<br />
Time [s]<br />
Figure 7.2-5: Density profiles at 1 MPa loading<br />
density 2.5m<br />
- density 112.5m<br />
density1175rn<br />
density 197.5m<br />
The two figures that follow (Figures 7.2-6 and 7.2-7) illustrate the particle velocity<br />
behind the shock wave. The material particles in the air domain, with the exception of<br />
those that are on the bottom reflective surface, accelerate to a constant velocity in the<br />
aftermath of the incoming shock wave. They maintain this velocity to the point when<br />
the reflected wave passes by them again, after which they obtain almost zero velocity<br />
again. This behavior can be proven based on theoretical calculations. The velocity<br />
measurements are taken at discrete nodes, as opposed to elemental integration points of<br />
the four earlier graphs, at a distance of 5m, 115m, 120m and 200m from the loading<br />
surface.<br />
144
IxI.E]]<br />
D.10<br />
DOS<br />
8 -OD<br />
[x1.E3J<br />
Time [s]<br />
Figure 7.2-6: Particle velocity profiles at 0.17 MPa loading<br />
T ime [s]<br />
Figure 7.2-7: Particle velocity profiles at 1 MPa loading<br />
145<br />
--- velocity5m<br />
velocityll5m<br />
- velocityl20m<br />
- velocity200m<br />
- velocity 5m<br />
velocity115m<br />
velocity120m<br />
- velocity 200m
IncomingQ Shock Wave Parameters<br />
The numerically obtained shock and particle velocity and density ratio across the<br />
shock are compared with the theoretical values that are calculated by use of equations<br />
(Equation 3.2-17, 3.2-18 and 3.2-19). The validation is conducted on both incoming and<br />
reflected waves. The primary difference between the calculation for incoming and<br />
reflective wave lies on the fact that the incoming wave is travelling in still air, while this<br />
is not the case for the reflective wave. The case of the incoming wave will be the first to<br />
be examined.<br />
Shock Velocity,<br />
Us [m/s]<br />
537.82 531.72 -1.13 1055.7 1102.29 4.41<br />
Particle 265.62 267.9 0.85 786.75 840.5 6.81<br />
Velocity, up<br />
[m/s]<br />
Density Ratio, 1.98 1.99 0.51 3.93 4.00 1.78<br />
P2/p1<br />
Table 7.2-1: Numerical and theoretical values of shock wave propagation parameters for incoming wave<br />
The data from Table 7.2-1 suggests that the numerical values for the shock-particle<br />
velocity and the density jump across the shock are reasonably consistent with the<br />
respective theoretical values for both loading scenarios. However, judging by the<br />
computed values one can observe that the consistency is more accurate for the low<br />
loading scenario which is closer to the experimental loading values. The error in shock<br />
velocity between theoretical and numerical values is approximately 1.13% for the 0.17<br />
MPa loading, while the error increases to 4.41% when the magnitude of the incoming<br />
146
wave is 1 MPa. This trend is maintained when looking at the density jump. The error<br />
increases from 0.51% to 1.78% for the low and high loading respectively. The largest<br />
inconsistency is present in the particle velocity, which is very accurate for the low<br />
loading but increases to 6.8% in the 1 MPa case. Since the applied loading in all<br />
subsequent analyses follow this experimental loading, according to this parametric<br />
study the error in shock wave propagation should be minimal.<br />
Shock Wave Reflection<br />
Before calculating the propagation of parameters the reflected wave it would be<br />
useful to examine reflection the of the incoming shock wave off the bottom reflective<br />
surface of the domain. As was previously mentioned, the application of symmetry<br />
conditions on this surface ensures requirement. this Theoretical relations have been<br />
developed to calculate the reflection coefficient in the case of a rigid wall taking into<br />
account the nonlinear compressibility of air (Equation 3.4-3). The numerical for values<br />
the reflection coefficient can be calculated by examining Figures 7.2-2 and 7.2-3. The<br />
following Table 7.2-2 contains both numerical and theoretical values.<br />
Loading 0.17 Ma 1.00 MPa<br />
Theoretical Numerical % Error Theoretical Numerical % Error<br />
Reflection 3.17 3.19 0.63 5.53 5.82 5.24<br />
Coefficient, CR<br />
Table 7.2-2: Numerical and theoretical values of reflection coefficient CR<br />
The same consistent trend between numerical and theoretical values is evident in<br />
regard to the reflection coefficient as with the shock parameters of the incoming wave.<br />
147
There is a good agreement between theory and simulation in the case the of low level<br />
loading since the error is negligible. However, the offset increases to approximately 5%<br />
in the high loading case.<br />
For the calculation of the theoretical values of the propagation parameters one<br />
should take into consideration that the reflected wave is not propagating in still air but<br />
in air with a non zero particle velocity that was calculated in the section regarding the<br />
incoming wave propagation. Therefore, the Rankine-Hugoniot equations in their<br />
general form will used be (Equation 3.2-15 and 3.2-16). The final results are presented in<br />
the following table.<br />
Shock Velocity,<br />
Us [m/s]<br />
324.47 326.26 0.55 427.59 418.41 -2.15<br />
Particle 1.55 0.5 -67.74 1.51 2.8 85.43<br />
Velocity, up<br />
[m/s] _<br />
Density Ratio, 1.81 1.80 -0.23 2.85 2.97 4.21<br />
p2/ P1<br />
Table 7.2-3: Numerical and theoretical values of shock wave propagation parameters for incoming wave<br />
The data from the table above provides ample evidence that there is good agreement<br />
between theory and numerical simulation even in the case of the reflected wave. The<br />
high values of relative error in the case the of particle velocity stem from the<br />
comparison of relatively low velocity values; however, even in this case, the agreement<br />
of absolute values is clear. Once again, the low loading case follows more closely the<br />
theoretical predictions. It is also noteworthy that the numerical results are in full<br />
148
compliance with theory in regard to the near zero particle velocity behind the reflected<br />
wave.<br />
The data analysis and simulations that were undertaken and presented in this<br />
paragraph have proven that ABAQUS is capable of properly handling shock wave<br />
propagation through air. The agreement with theoretically calculated propagation<br />
parameters is closer in the case of lower pressure magnitudes, in the regime that are of<br />
interest to us in this study, even though the compliance is acceptable even in the case of<br />
stronger shocks.<br />
7.3 Artificial Viscosity<br />
Artificial viscosity plays an important role in the simulations that have been<br />
conducted since the very nature of the phenomenon that is being simulated involves<br />
shock wave propagation and induced fluid structure interaction; both high speed<br />
dynamic and transient events. The selection of suitable coefficients for both linear and<br />
quadratic viscosity is important for the accurate response of the employed numerical<br />
model. Therefore, the purpose of this chapter is not only to provide the theoretical<br />
background of numerical viscosity and how ABAQUS implements this feature but to<br />
also present the reasoning behind the selection of the values of the coefficients that were<br />
selected.<br />
7.3.1 Artificial viscosity implementation in ABAQUS<br />
The concept of artificial (bulk) viscosity was originally proposed by Von Neumann<br />
and Richtmyer. Its goal is to spread the shock front over several elements in order to<br />
149
enable simulations of strong shocks of thickness smaller than the mesh size. The<br />
viscosity introduced in the calculations vanished when the mesh size decreases and<br />
conserves the fundamental features of the shock, such as the shock speed and jump<br />
conditions, while avoiding the high frequency spurious mode otherwise observed [43].<br />
ABAQUS/Explicit uses two forms of artificial viscosity; linear and quadratic. Linear<br />
viscosity is found in all elements and is introduced to damp "ringing" in the highest<br />
element frequency. This damping, sometimes referred to as truncation frequency<br />
damping, generates a bulk viscosity pressure, pbvl that is linear in volumetric strain rate<br />
[45]:<br />
where bi: linear bulk viscosity coefficient<br />
Pbl = b pc Le vol Equation 7.2-1<br />
Cd: dilatational wave speed in element<br />
Le: characteristic length of element<br />
,Vol: volumetric strain rate<br />
The second term of bulk viscosity is found only in solid continuum elements and is<br />
quadratic in the volumetric strain rate. It generates the following bulk viscosity<br />
pressure, pbv2 and is applied only if the volumetric strain rate is compressive [45]:<br />
Pbv2 = P(b 2 Le -. 1 )2 Equation 7.2-2<br />
where b2: quadratic bulk viscosity coefficient<br />
The quadratic bulk viscosity pressure will smear a shock front across several<br />
elements and is introduced to prevent elements from collapsing under extremely high<br />
velocity gradients. The quadratic bulk viscosity will prevent an element from collapsing<br />
to zero volume in one time increment when the initial velocity at the nodes of this<br />
150
element is equal to or greater than the dilatational wave speed of the material by<br />
introducing a resisting pressure [45].<br />
The bulk viscosity pressure is not included in the material point stresses because it is<br />
intended for numerical effects only; it is not part of the materials constitutive response<br />
and is based upon the dilatational mode of each element [45].<br />
7.3.2 Calibration of artificial viscosity<br />
The effects of linear and quadratic bulk viscosity will be studied in the Eulerian air<br />
domain that was presented in the previous section (7.1) of this chapter under the<br />
loading condition of 0.17 MPa. The use of such a constant loading scenario is not exactly<br />
representative of the problem of shock wave propagation due to the constant pressure<br />
application. However, it is beneficiary to the study of the effects of artificial viscosity<br />
because it isolates the applied pressure from numerical the artifacts that stem from the<br />
use of artificial viscosity. Furthermore, it should be noted that the size of the<br />
computational domain is significantly larger than the domain ultimately used in the<br />
material response simulations. However, the size of the domain allows for the detailed<br />
observation of the effects of the artificial viscosity which is the reason for this study.<br />
A number of simulations were undertaken varying the coefficients of both linear<br />
and quadratic bulk viscosity in order to determine the damping effects on the incoming<br />
and reflected pressure profiles. The default values for the linear and quadratic bulk<br />
viscosity parameters are b1=0.06 and b2=1.2 respectively. In addition to the use of the<br />
default values for the artificial viscosity coefficients, five subsequent test cases were<br />
simulated with the use of the following combination of coefficients, where (bi,b2): (0,0),<br />
(0,1.2), (0.06,1.2), (0.06,2.4), (0.2,0) and (0.2,1.2).<br />
The following Figures 7.2-1 and 7.2-2 illustrate the incoming and reflected waves in<br />
the Eulerian air domain at a distance of 52.5m from the loading surface for the<br />
151
examined artificial viscosity coefficients, while the next two Figures 7.2-1 and 7.2-2<br />
illustrate the pressure profiles at a distance of 122.5m.<br />
x1.EB]<br />
D.ZD<br />
B IS<br />
.10 -<br />
D.05s<br />
Time [s]<br />
pre 9s, 52.5 m 0 /0<br />
press 52.5m 0/L.2<br />
press 52.5m 0.06/L.2<br />
press 52.5mn 0.06/2.4<br />
- press 52.5m U0./<br />
prss 52.5m 0.2/L22<br />
Figure 7.3-1: Incoming wave pressure profiles at 52.5m distance for combinations of artificial viscosity<br />
coefficients (b1/b2)<br />
152
Time [s]<br />
Figure 7.3-2: Reflected wave pressure profiles at 52.5m distance for combinations of artificial viscosity<br />
coefficients (b 1/b 2)<br />
[D1ES]<br />
IMz<br />
Time [s]<br />
Figure 7.3-3: Incoming wave pressure profiles at 122.5m distance for combinations of artificial viscosity<br />
coefficients (b 1/b 2)<br />
153
Lx.E6j<br />
D. 7D<br />
Pre ss 122.5 m0./1 2<br />
DZD - press 15m .6/ 2<br />
press 122.5mrn 0 /0<br />
press 122.5 mn .2/1p2<br />
D D'65 D. 7D D.8s D.9D . DD<br />
Time [s]<br />
Figure 7.3-4: Reflected wave pressure profiles at 122.5m distance for combinations of artificial viscosity<br />
coefficients (b 1/b 2)<br />
A number of interesting conclusions can be obtained from the observation of the<br />
four previous graphs. It is reasonable for the curve (blue) corresponding to the greatest.<br />
value of quadratic bulk viscosity, b2, to have the smallest pressure gradient, since this<br />
behavior is dictated by the shock smearing function of this term. Therefore, not only<br />
will it have a longer rise time but the pressure will start increasing earlier. On the other<br />
hand, the pressure profiles of the cases with b 2=0 have the steepest gradient and<br />
smallest rise time. A noticeable feature found in all of the six curves is the existence of<br />
oscillations in the pressure response. Higher of values the linear viscous term, b1, tend<br />
to dampen these oscillations at a faster rate.<br />
The final selection of the coefficients that will be used in the material response<br />
simulations was based on the following requirements: a) maintenance of a steep<br />
pressure gradient, as a proper shock wave would, b) the introduction of sufficient
numerical viscosity in order to assist in the damping of any spurious oscillations of<br />
numerical nature and c) the restriction of any high magnitude pressure overshoots. In<br />
order to satisfy all these requirements the pair with (b1,b 2)=(0.2,1.2) (green curve) was<br />
finally selected and is used in the following simulations.<br />
7.4 Simulation Description<br />
The setup of the numerical simulation of the response of foam samples subjected to<br />
shock loading conditions is described in the following paragraph.<br />
Geometry and Boundary Conditions<br />
In accordance with the experimental investigation of the problem at hand, two foam<br />
configurations were tested; a solid foam specimen and a foam sample with an internal<br />
cavity. The external dimensions of both configurations were 10 in x 10 in x 1 in with a<br />
corresponding volume of 100 in 3 . An internal core of 8 in x 10 in x 0.5 in was removed<br />
from the center of the solid foam specimen in order to model the single cavity<br />
configuration. In compliance with the experimental setup, the foam samples were<br />
sandwiched between two Plexiglas sheets of 10 in x 10 in x 0.125 in dimension.<br />
However, due to the geometric symmetry, only a quarter of the foam samples and<br />
Plexiglas sheets were modeled. Therefore, the external dimensions of the combined<br />
foam-Plexiglas specimen samples were 5 in x 5 in x 1.25 in while the dimensions of the<br />
internal cavity of the quarter plate were 4 inch x 4 inch x 0.5 inch. The quarter solid<br />
foam sample and single cavity configuration specimen sandwiched between two<br />
Plexiglas sheets are depicted in the left and right pictures of Figure 7.3-1 respectively.<br />
155
Due to the restriction of the modeling to only a quarter plate, appropriate symmetry<br />
conditions have to be imposed on the sides of the solid domain. The vertical black<br />
dashed line (Figure 7.3-1) that is placed on the bottom left edge of the quarter solid<br />
domain, corresponds to the center of the whole plate. Additionally, as depicted on the<br />
top right corner of the pictures in Figure 7.3-1, symmetry conditions in the x-axis are<br />
imposed on the solid regions inside the green ellipse, while the solid regions inside the<br />
red ellipse are bound to symmetry conditions in the y-axis. During the blast mitigation<br />
experiments, described in Chapter 5, the foam samples were constrained on the test<br />
stand with the use of 1 inch thick angle beams. It is assumed that the use of these<br />
restraining elements is sufficient to hold the sample in place and not allow lateral<br />
movement. Therefore, on the regions of the top and bottom surface of the samples, for<br />
both solid foam and single cavity configuration, all translational degrees of freedom are<br />
constrained in the 1 inch wide regions painted in red in Figure 7.3-2.<br />
Figure 7.4-1: Views of quarter solid foam specimen (left) and quarter single cavity specimen (right), green<br />
ellipse X symmetry, red ellipse Y symmetry<br />
156
Figure 7.4-2: Regions of constrained translational degrees of freedom on top (left) and bottom surface<br />
(right) of solid foam specimen<br />
The Eulerian-fluid domain, depicted in Figure 7.3-3 and 7.3-4, employed to model<br />
the surrounding air but also the fluid filler material inside the cavity configuration<br />
sample is split in three basic sections A, B and C. The samples are placed initially inside<br />
section B of the Eulerian domain with a height of 31.75 mm (1.25 inches).<br />
Figure 7.4-3: Eulerian domain<br />
157
Section A spans 500 mm above the top surface of the solid sample with a cross<br />
section of 103.01 mm x 127 mm (4.05 in x 5 in). The external loading, simulating the<br />
incoming shock wave, is applied on the top surface of section A (the loading conditions<br />
will be further examined shortly). The cross section of section A of the Eulerian domain<br />
is smaller than the respective cross section of the foam specimens (5 in x 5 in). Hence,<br />
the long edge of the fluid domain spans along the whole side of the solid (in the y-axis),<br />
while the short edge (4.05 inches) in the x-axis spans for only 0.05 inches inside the 1<br />
inch foam region where the translational degrees of freedom are constrained, Figure<br />
7.3-5. The reasoning behind not expanding the fluid domain also in the x direction, so as<br />
to span the whole side of the solid sample similarly to the approach taken in the y<br />
direction, stems from the nature of the boundary conditions imposed on the top and<br />
bottom 1 inch bands of that solid region. By constraining the translational degrees of<br />
freedom on the top and bottom 1 inch regions, the foam material in between would not<br />
be able to move. However, this is not the case in the y direction where boundary the<br />
conditions are applied only on the bottom surface. The overlap of 0.05 inches between<br />
fluid and solid domains is necessary for the fluid-structure interaction extrapolation<br />
scheme used in the numerical model.<br />
158
Figure 7.4-4: 3D view of Eulerian domain<br />
Section C of the air domain has a square cross section with an edge of 95.25 mm<br />
(3.75 inches). This section simulates the Plexiglas chamber present behind the<br />
sandwiched foam samples during the experimental investigation.<br />
Figure 7.4-5: View of cavity configuration Eulerian inside domain<br />
159
Due to the geometric symmetry of the problem, only a quarter of the air on top and<br />
below the solid specimens has been modeled. The dashed black line in the left picture of<br />
Figure 7.3-6 represents the center axis the of full air domain. Accordingly, symmetry<br />
boundary conditions have been imposed on the two internal sides of the domain along<br />
the center axis. Similarly to the solid domain, symmetry in the x-axis has been imposed<br />
on the side engulfed by the green ellipsis of the left picture of Figure 7.3-6, while<br />
symmetry in the y-axis on the surface engulfed by the red ellipsis. In regards to the<br />
external surfaces of the domain (not bound by symmetry), zero displacement boundary<br />
conditions in the x-axis and y-axis have been imposed on the surfaces engulfed by the<br />
green and red dashed ellipsis respectively of the right picture of Figure 7.3-6. The<br />
reasoning behind imposing zero displacement boundary conditions from stems the fact<br />
that the top section of the air domain (Section A) should correspond to an infinite air<br />
region on of the top plate. Therefore, the displacement of the air elements should be<br />
continuous in the direction perpendicular to the shock wave propagation. In the case of<br />
Section C of the air domain, the application of such boundary conditions is a result of<br />
the presence of the Plexiglas chamber behind the specimens. It should be noted at this<br />
point, that the application of zero displacement boundary conditions twoon<br />
the<br />
mentioned surfaces leads to the development of a planar shock wave after the applied<br />
loading. This is a feature that should be taken into account comparing while<br />
numerical<br />
with experimental results since during the experiments the incoming wave shock<br />
maintained spherical geometry.<br />
160
,P% 91<br />
Figure 7.4-6: Boundary conditions imposed on internal (left) and external surfaces (right) of Eulerian<br />
domain, solid green ellipse X symmetry, solid red ellipse Y symmetry, dashed green ellipse zero X<br />
displacement, dashed red ellipse zero Y displacement<br />
In the case of the simulations with the single cavity configuration, in addition to the<br />
previously mentioned boundary conditions on the Eulerian and Lagrangian domains a<br />
further condition was applied. During the experimental investigations after the shock<br />
wave had hit the samples the filler materials were permanently displaced from the<br />
cavity. No water inflow is consequently allowed. The water was initially constrained in<br />
the cavity with the use of aluminum foil which burst under the influence of the shock<br />
wave, as described in detail in Chapter 5. Therefore, a boundary condition allowing<br />
only outflow of the material present inside the cavity was applied to the Eulerian<br />
surface that forms the external boundary of the cavity, Figure 7.3-7.<br />
161
Figure 7.4-7: External boundary of cavity<br />
As previously mentioned, an Eulerian mesh in ABAQUS allows by default material<br />
to flow in and out through its boundary elements freely. However, during the<br />
numerical investigation it was determined that, when applying the pressure profile of<br />
the shock wave very close to the Lagrangian domain, the interaction of the shock wave<br />
with boundaries of the fluid domain with no imposed boundary conditions resulted in<br />
the creation of numerical instabilities. Therefore, in order to avoid potential numerical<br />
artifacts stemming from the interaction of the reflected wave off the top solid surface<br />
with the top surface of the Eulerian domain, the length of section A was set to 500 mm.<br />
By setting such a distance there is adequate time for the whole incoming shock wave to<br />
interact with the samples before any instabilities affect the measurements.<br />
162
Mesh and Material Assignment<br />
The Plexiglas and foam regions of both the solid foam and single cavity<br />
configuration models were modeled using linear 3D solid continuum elements with<br />
enhanced hourglass control. For accurate shock propagation simulation at least three<br />
layers of elements are used to model finite regions in the solid domain; for instance<br />
three stacks of elements were used to discretize the thickness of the Plexiglas sheets. In<br />
regard to the artificial viscosity coefficients, the values (b1,b2)=(0.2,1.2) determined in<br />
Section 7.3 were used. Approximately 13,000 elements (depending on the simulation<br />
configuration, this number varies slightly) were used to discretize the Plexiglas and<br />
foam regions of both solid foam and single cavity configurations. The mesh of the<br />
Plexiglas and foam regions of the cavity configuration sample is shown in Figure 7.3-8.<br />
Figure 7.4-8: Single cavity configuration sample mesh<br />
The Eulerian domain is discretized using linear Eulerian 3D elements of the<br />
ABAQUS element library. A total number of approximately 350,000 elements<br />
163
(depending on the simulation configuration, this number varies slightly) were used to<br />
model the Eulerian domain, section of which is depicted in Figure 7.3-9.<br />
Figure 7.4-9: Eulerian domain mesh<br />
As mentioned in Chapter 7.1, materials in an Eulerian analysis are initially defined<br />
at the beginning of a simulation. The material boundaries are tracked automatically at<br />
each time increment. Specifically, for the current simulations, the flat plate samples are<br />
inserted into Eulerian the domain in section B (Figure 7.3-3). Air is assigned to all the<br />
elements of the Eulerian domain outside the solid domain, while elements of the<br />
Eulerian mesh that are occupied by the foam and Plexiglas regions are void of any<br />
Eulerian material. In the case of the single cavity configuration sample with water as<br />
filler material, water is assigned to the Eulerian elements that correspond to the internal<br />
cavity.<br />
In compliance with the experimental investigation, Dertex VN 600 foam was used to<br />
model the foam regions of the examined The samples. foam was modeled using the<br />
164
Hugoniot shock model in combination with the Mie-Grineisen EOS with the material<br />
parameters described in Chapter 4. The water inside the cavity region was also modeled<br />
using the Hugoniot/Mie-Graneisen EOS, while the surrounding air was described<br />
using the EOS for ideal gas. The parameters for the fluid materials are provided in<br />
Chapter 4.<br />
Loading Conditions<br />
The incoming shock wave is modeled by applying a decaying pressure profile on<br />
the top surface of the Eulerian domain, Figure 7.3-10, which propagates through section<br />
A of the Eulerian domain reaching the top surface of the sample. However, the exact<br />
experimentally measured loading profile could not be directly applied on the top<br />
surface of the Eulerian domain because of magnitude decay and temporal distribution it<br />
experiences while propagating through the top air region. Furthermore, the<br />
experimental loading cannot be applied directly on the solid surface since the sample<br />
does not experience the incoming pressure but the reflected pressure which was not<br />
experimentally measured.<br />
In order to create loading conditions similar to the experimentally measured<br />
profiles, the loading pressure profile on the loading surface was modified in such a way<br />
so as to produce a shock of the same magnitude and similar form to the experimental<br />
conditions at the distance where the sample is placed. Figure 7.3-11 contains the<br />
experimentally measured incoming pressure profile, the applied pressure profile on the<br />
top of the fluid domain during the numerical simulations and the profile of the<br />
incoming wave at a distance of 500 mm from the loading surface. Observation of Figure<br />
7.3-11 reveals that the applied loading profile has a higher peak pressure magnitude<br />
and shorter positive phase compared to the final shock wave. The features of the<br />
negative phase remain unaltered during the propagation of the wave. Comparison<br />
165
etween the experimentally and numerically experienced incoming shock reveal that<br />
the peak overpressure is similar in both cases 24.82 psi (171 KPa), as is the negative<br />
phase. On the other hand, the pressure gradient is slightly for steeper the experimental<br />
curve. Overall, both curves are similar enough to ensure appropriate an comparison<br />
between numerical and experimental loading.<br />
Figure 7.4-10: Surface of Eulerian domain where loading is applied<br />
166
500000<br />
400000<br />
300000<br />
200000<br />
100000<br />
0<br />
-100000<br />
Time [s]<br />
Figure 7.4-11: Experimental and numerical shock wave profiles<br />
7.5 Shock Loading Simulation Results<br />
- Experimental Incoming<br />
- Numerical Applied<br />
--- Numerical Incoming<br />
The simulation parameters mentioned in the previous paragraph are employed<br />
during the investigation of the shock response of two samples; a solid foam sample that<br />
acts as the control specimen and a single cavity specimen with water as the filler<br />
material. The transmitted wave was measured at a distance of 2.75 inches (69.8 mm)<br />
from the center of the back Plexiglas sheet during the experiments. In order to compare<br />
the experimentally measured pressure profile with the numerical results, the<br />
transmitted profile of the shock was measured at the integration point of element A of<br />
Figure 7.5-1 at a distance of 68 mm from the rear surface of the back Plexiglas sheet<br />
along the axis of symmetry, which passes through the center point of the solid<br />
specimen, and thus is not exactly in the center of the full setup (only one quarter is<br />
167
epresented). An identical location to the experimentally measured profiles could not be<br />
used to due the mesh topology.<br />
The objective is to develop a validated numerical model which will assist in the<br />
development and assessment of proposed liner samples. Therefore, it is imperative to<br />
compare the numerically calculated results with the experimentally measured pressure<br />
profiles at approximately 2.75 inches at point A in order to identify potential differences<br />
and limitations. Taking into account the profile parameters measured in Table 5.5-1, the<br />
arrival time of the transmitted wave ta, the peak transmitted pressure ps, rise time tr and<br />
duration of positive phase T of the numerically derived profiles should be calculated<br />
and compared with their experimental counterparts. All the experimental values of the<br />
transmitted wave parameters will be taken from Table 5.5-1 with the exception of the<br />
transmitted wave arrival time. The time reference for both simulations and experiments<br />
was changed so as to have t=O at the moment when the incoming wave reaches the top<br />
surface of the samples. This use of relative time frame is in accordance with the<br />
objectives of the project, since the propagation of the shock wave through the samples is<br />
of interest.<br />
Figure 7.5-1: Recorded transmitted wave locations<br />
168
The following Table 7.5-1 contains both experimentally measured and numerically<br />
calculated blast parameters of the transmitted wave for the solid foam case at point A,<br />
while Figure 7.5-2 depicts the pressure profiles referenced to a common t=0 when the<br />
wave reaches point A. The largest differences between numerical and experimental<br />
values regard the peak transmitted pressure and the positive phase duration. The<br />
numerically calculated ps is approximately 0.23 psi or 26% lower than the<br />
experimentally obtained value, while the T'is approximately 27% lower at 0.92 ms as<br />
opposed to the experimental 1.27 ms. In regard to the arrival time of the wave ta, there is<br />
perfect agreement between the two values. On the other hand, the rise time of the<br />
transmitted pressure in the simulations 0.25 ms, is larger than the value in the<br />
experiments 0.1 ms, indicating a numerical smoothening effect on the pressure gradient.<br />
As previously mentioned, even though fluid is freely allowed to move through the<br />
Eulerian domain, in practice, once the wave reaches the bottom boundary of the<br />
domain, numerical disturbances propagate back inside the domain. A close inspection<br />
of the transmitted wave propagation shows that these disturbances bounce off the<br />
bottom Eulerian boundary and after reaching measurement the location influence the<br />
pressure profile. This interference not affect does the numerically derived pressure<br />
profile until after approximately 1.1ms. Hence, the numerical pressure profile lying<br />
behind the vertical dashed line in Figure 7.5-2 is influenced by the propagating<br />
disturbances into numerical the domain and should not be taken into account. A<br />
possible solution to this problem is to increase the length of section C of the Eulerian<br />
domain such that reflected numerical artifacts do not interfere with the measurements.<br />
169
7000<br />
6000<br />
5000<br />
4000<br />
3000<br />
2000<br />
1000<br />
0<br />
-1000<br />
-2000<br />
Table 7.5-1: Solid foam experimental and numerical transmitted wave parameters<br />
Pressure-Time<br />
0.2 0.4 0.6 0.8 1 1.2 1.4 1.6<br />
Time [ms]<br />
- Experimental<br />
-Numerical<br />
Figure 7.5-2: Solid foam configuration experimental and numerical transmitted pressure profiles at point<br />
A<br />
170<br />
mw
The transmitted pressure parameters of the single cavity configuration case with<br />
water as filler material are examined in Table 7.5-2, while the experimental and<br />
numerical pressure profiles, shifted in time such that t=0 coincides with the moment the<br />
wave reaches point A, are depicted in Figure 7.5-3. The numerically derived p, is in<br />
close agreement with the experimental value with only a 0.02 psi pressure difference. In<br />
the case of the arrival time ta, it seems that the shock propagates faster through the<br />
material and reaches the measurement location 0.08 ms earlier than the experiments.<br />
The rise time during the simulation is also smaller than the experimental value further<br />
indicating that the numerical simulation overestimates the velocity of shock<br />
propagation. The transmitted overpressure profile during the numerical simulations<br />
does not drop to negative values as demonstrated by the experiments. Therefore, the<br />
calculation of Tis not feasible. Similarly to the solid foam simulation, numerical<br />
disturbances reflecting off the bottom surface of the Eulerian domain propagate toward<br />
the interior of the domain influencing the pressure measurements after approximately<br />
1.1ms. The transmitted wave profile to the right of the vertical dashed line in Figure<br />
7.5-3 is influenced by the reflection of numerical artifacts.<br />
experimental 0.57 0.44 U.6 1.b3<br />
numerical 0.55 0.36 0.31<br />
Table 7.5-2: Single cavity water experimental and numerical transmitted wave parameters<br />
171
5000<br />
4000<br />
3000-<br />
Pressure-Time<br />
- Experimental Water<br />
(U2000 -Numerical Water<br />
1000 -<br />
1000-<br />
-1000<br />
0<br />
1.2 0.4 0.6 0.8 1 .2 1 1.4 1.6 1.8<br />
Time [ms]<br />
Figure 7.5-3: Water filled single cavity configuration experimental and numerical transmitted pressure<br />
profiles at point A<br />
Inspection of the numerical and experimental transmitted wave parameters and<br />
profiles for both simulated cases has highlighted some differences between the two. In<br />
the case of the solid foam configuration the largest differences evident are for the wave<br />
rise time and the peak pressure. On the other hand, the water filled cavity simulation<br />
seems demonstrate to a slightly faster response compared to the experiments. The fact<br />
that the peak overpressure has been captured more accurately for the water filled case,<br />
where the percentage of foam material is less than the solid foam case, may indicate that<br />
a source of potential error stems from the parameters in the used Mie-Grtineisen EOS to<br />
model the Dertex foam. Experimental determination of more accurate parameters may<br />
eliminate this source of error. Furthermore, the discretization scheme and the artificial<br />
172
viscosity may have smoothened out extreme pressure gradients. It should also be taken<br />
into account that the exact laboratory conditions may not have been reproduced during<br />
the simulations. A number of assumptions and simplifications were made during the<br />
simulations, such as the assumption of a planar incoming wave and the firm<br />
containment of the solid samples by the 1 inch angle beams, that may introduce some<br />
discrepancies between numerical and experimental values. the On other hand, sources<br />
of error, noise and vibration present in experimental studies, especially small scale tests<br />
in confined spaces, are not present numerical in investigations while repeatability is<br />
also a concern in experimental studies. Concluding, albeit the previously mentioned<br />
sources of possible deviation between numerical and experimental results, there is a<br />
reasonably good agreement between the two.<br />
The purpose of the two previous tables and figures was to compare the experimental<br />
and numerical curves. After determining reasonable agreement between the two for<br />
both solid foam and water filled cavity specimen, additional features may be examined<br />
that could not be measured during the experiments.<br />
Chapter 3.4 was devoted to blast wave interactions and fluid-structure interactions.<br />
By measuring the pressure profile at the surface of the top Plexiglas sheet the reflection<br />
coefficient CR of the two numerically modeled cases can be calculated. The reflected<br />
pressure profiles on the top surface of the solid domain along the axis of symmetry for<br />
both simulations are depicted in Figure 7.5-4. The profiles seem similar for both cases<br />
reaching a peak pressure value of 507 KPa. Taking account into that the loading<br />
conditions for both simulations is approximately 171 KPa, the reflection coefficient is<br />
CR=2.97. Evaluation of the reflection coefficient using Equation 3.4-3, which assumes a<br />
rigid, fixed boundary ambient and pressure of po=101 KPa yields CR=3.17. The<br />
difference between the two values stems from the fact that the solid region the in<br />
numerical simulation is not a rigid boundary, while it highlights the positive influence<br />
of FSI and the movement of the plate in the reduction of the experienced plate pressure.<br />
173
[x1.E6]<br />
0.50<br />
0.40<br />
C 0.30 -<br />
0.20 --<br />
0.10 -<br />
0.00,<br />
0.0 0.5 1.0 1.5 2.0 2.5 [s.E-3]<br />
Time [s]<br />
Figure 7.5-4: Reflected wave profiles at top of Plexiglas sheet<br />
pressure top Plexiglas foam solid<br />
pressure top H20 Plexiglas<br />
The analyses of the transmitted and reflected wave at point A and the top surface of<br />
the solid domain respectively, focused on following the pressure profile at a specific<br />
location for the duration of the simulation. The following surface plots on the other<br />
hand, depict the pressure values at the integration point of all the elements at a distance<br />
of 68mm behind the rear Plexiglas sheet (same distance as point A) for one time instant.<br />
The objective of these surface plots is to provide insight into the spatial distribution of<br />
the transmitted pressure values at a specific distance from the tested samples. For each<br />
time instance, the transmitted pressure surface plot for the solid foam case is shown<br />
first, followed by another common plot containing the pressure surfaces of both solid<br />
foam and water filled cavity configuration. Surface plots for two time instances are<br />
plotted. The first set (Figures 7.5-5 and 7.5-6) corresponds to the time frame when the<br />
peak pressure is obtained at point A for both tested cases. It should be noted that the<br />
peak pressure at point A is not attained at the same instant time for both test cases.<br />
Specifically, the solid foam and water filled case reach pressure peak 0.60 ms and 0.67<br />
174
ms respectively after the incoming shock wave has reached the top surface of the solid<br />
domain. The second set of plots (Figures 7.5-7 and 7.5-8) corresponds to the time instant<br />
when the pressure profiles at point A reach 1500 Pa for the first time after attaining the<br />
peak pressure; 0.94 ms and 0.96 ms after the incoming shock has reached the top surface<br />
of the solid domain for the solid foam and water filler cavity case respectively.<br />
It should be noted that Figure 7.5-5 through Figure 7.5-8 show only the quarter plate<br />
as is the case with the numerical simulations. The dashed line in the four following<br />
figures indicates the center of the full plate and the location of point A. The X symmetry<br />
conditions mentioned in paragraph 7.4 are imposed on the edge of the domain with<br />
x=0, while the Y symmetry conditions are applied at y=O.<br />
.........<br />
.....<br />
Figure 7.5-5: Pressure at moment of attained peak transmitted pressure at point A for solid foam case<br />
175<br />
...........<br />
......<br />
.....
4400-<br />
A 40<br />
2800 --<br />
3200 - -..-.-<br />
2400<br />
2400<br />
4000. -..-.-. 300<br />
0 - 00<br />
Figure 7.5-6: Pressure at moment of attained peak transmitted pressure at point A for solid foam and<br />
water filled cavity case<br />
Figures 7.5-5 and 7.5-6 show that the maximum transmitted pressure for both<br />
simulated cases is attained at the center of the plate, at location A. The foam sample<br />
seems to exhibit a larger pressure gradient across the investigated surface, since the<br />
pressure ranges from approximately 4400 Pa to less than 2600 Pa, while the pressure<br />
range for the water case spans from approximately 3800 Pa to 3000 Pa. The foam case<br />
demonstrates significant lower pressure values than the water filled case near the<br />
y=0.09 m boundary. This boundary corresponds to the region of the solid domain<br />
where fluid is free to exit the foam sample. Therefore, this observation may suggest<br />
constraining the water inside the cavity rather than letting it flow freely to the<br />
environment.<br />
176
3000<br />
25M<br />
15M-<br />
10-0<br />
20040<br />
-0.1 -0.0 7<br />
-0 6 4050 05<br />
0 0.06 .07<br />
1400<br />
1 &G3 0.04M<br />
0 0<br />
-.10.01 0.2<br />
Figure 7.5-7: Pressure at moment of attained 1500 Pa pressure at point A for solid foam case<br />
300<br />
0 -0.09 .I<br />
OWDO<br />
......... .. ......................<br />
.............. . .. ... .......................... . ...... .. .<br />
'OM -0.02 .0.01 0 0<br />
xinm<br />
..............<br />
........... ........... .......................<br />
0.02<br />
0.04<br />
y m]<br />
0.06<br />
.................<br />
Figure 7.5-8: Pressure at moment of attained 1500 Pa pressure at point A for solid foam and water filled<br />
cavity case<br />
177<br />
0
Figures 7.5-7 and 7.5-9 show the pressure distribution of the transmitted wave 68<br />
mm behind the solid domain at the time instance when the pressure at point A is<br />
approximately 1500 Pa for both simulations. The maximum pressure values for both<br />
simulations, as opposed to the previous time instant, are not observed at point A. Once<br />
again, the foam simulation exhibits a larger pressure gradient across the examined<br />
surface than the water filled case, spanning from approximately 1300 Pa to 3400 Pa. The<br />
pressure values of the solid foam case are generally higher than the water filled case,<br />
except for a small region that lies along the x axis of the domain and 0 < y < 0.04 m.<br />
Common practice in studies undertaken in the field of blast mitigation is to evaluate<br />
the effectiveness of proposed structures against incoming shock waves by measuring<br />
the deflection of points along the axis of symmetry [24, 25, 57]. Therefore, valuable<br />
insight may be attained from plotting the vertical displacement of the top (P1) and<br />
bottom (P2) points of the foam material along the axis of symmetry shown in Figure<br />
7.5-9.<br />
Figure 7.5-9: P1 and P2 points located on top and bottom points of foam region along axis of symmetry<br />
178
Figure 7.5-10 shows vertical the displacement of points P1 and P2 for both solid<br />
foam and water filled cavity simulations. Observation of Figure 7.5-10 shows that the<br />
foam region in both cases undergoes an initial compression phase (the top point P1,<br />
experiences larger deflection than the bottom point P2) followed by an expansion phase.<br />
In the case of the solid foam, an additional compression-expansion phase follows the<br />
first one, a behavior that is not seen in the water filled cavity configuration. The solid<br />
foam sample experiences the largest maximum values of vertical displacement for both<br />
top 0.9 cm and bottom points 1.08 cm as opposed to 0.17 cm and 0.96 cm respectively<br />
for the water filled case, supporting the superior attenuation capabilities of the water<br />
filled cavity samples.<br />
0.010 -<br />
0.005 -....<br />
W 0.000<br />
-0.005 -<br />
0.0 0.5 10 1.5 2.0 2.5 [nLE-3]<br />
Time [s]<br />
- --- -<br />
- - -- -<br />
PI vertical displacement solid foam<br />
P2 vertical displacement solid foam<br />
P1 vertical displacement H20<br />
P2 vertical displacement H20<br />
Figure 7.5-10: Deflection of points P1 and P2 for solid foam and water filled cavity simulations<br />
179
7.6 Conclusions<br />
Chapter 7 concerns the response of materials under shock wave loading. The first<br />
introductory paragraph of this chapter describes in detail the implementation of<br />
coupled Eulerian-Lagrangian analysis in ABAQUS. The basic concepts and numerical<br />
utilization is described in order to provide the reader an understanding of its<br />
capabilities and functionality. Paragraph 7.2 examines shock wave propagation and<br />
reflection off a rigid boundary. By comparing numerical and theoretical values of the<br />
shock and particle velocities, density ratio across the shock and reflection coefficient,<br />
accurate modeling in ABAQUS has been validated for shock waves of magnitude up to<br />
1 MPa. Section 7.3 is devoted to the parametric study of the artificial viscosity<br />
coefficients. The core of the chapter focuses on recreating the experimental setup and<br />
conditions, described in Chapter 5, and testing two configurations; solid foam and<br />
water filled cavity samples. Due the to geometric symmetry of the samples, during the<br />
simulations only a quarter of the solid sample and air regions on top and the behind<br />
plates were modeled. Numerical investigation of the solid foam specimen subjected to<br />
the experimental loading conditions, indicates that the temporal parameters of the<br />
transmitted wave are better maintained during the solid foam simulation, while the<br />
peak pressure is underestimated by approximately 0.2 psi. In the case of the water<br />
simulation, the peak pressure is accurately determined, while on the other hand, the<br />
response of the simulation seems to be slightly faster than the experimental<br />
measurements. Possible sources of error between numerical and experimental<br />
investigations have been identified; however, the agreement between the two is<br />
reasonable for both simulations. Measurement of the reflected wave profile on the top<br />
surface of the solid domain of both simulations leads to a reflection coefficient of<br />
approximately CR=2.97. This value is smaller than the analytically calculated reflection<br />
coefficient off a rigid wall, indicating the positive impact of FSI in reducing the pressure<br />
experienced by the plate. The spatial distribution of the transmitted wave along a cross<br />
180
section of the air behind the solid domain at two time instances was also investigated.<br />
The findings support that the transmitted pressure in the case of the water filled sample<br />
is smoother and without large pressure gradients across the surface when compared to<br />
the solid foam case. This suggests a larger spatial distribution of the transmitted wave.<br />
Finally, the deflection values of both top and bottom foam region points are<br />
significantly smaller in the water filled samples than the solid foam.<br />
181
182
8 Final Conclusions<br />
The objective of this research project is the development of a new helmet liner<br />
aiming at the enhancement of the attenuation capabilities against incoming blast waves.<br />
The approach that is taken is to introduce solid and fluid filler materials inside internal<br />
channels of foam liners. Filler materials of various density and acoustic impedance,<br />
porosity percentage, particle size and viscosity were investigated in order to determine<br />
their effect on the attenuation of the incoming blast wave. The primary focus<br />
concentrates on the interaction of the incoming shock wave with the filler materials and<br />
how this affects the following features of the transmitted wave:<br />
* Peak overpressure<br />
* Spatial distribution<br />
" Temporal distribution<br />
Decrease of the peak transmitted pressure and increase of the spatial and temporal<br />
distribution of the transmitted wave compared to control - solid foam - samples are<br />
considered to provide enhancement of the attenuation capabilities. To this end,<br />
experimental and numerical approaches were employed in order to determine the<br />
effectiveness of the proposed liner.<br />
The following section summarizes the approach that was taken in order to model<br />
and test the new helmet liner and presents the final conclusions that result from this<br />
investigation.<br />
183
8.1 Summary and Conclusions<br />
The significance of blast induced trauma and the urgency for the development of<br />
technologies offering enhanced protection are presented in Chapters 1 and 2, where key<br />
statistics and potential injury mechanisms are described. A number of undertaken<br />
clinical trials suggest that coup-countrecoup injuries may be one of the predominant<br />
injury mechanisms in TBI, while body and especially cavities cranial may influence or<br />
enhance the adverse effects. exact The physical of causes TBI are yet to be identified;<br />
however, it is commonly acknowledged that even though the peak pressure of the<br />
incoming wave is of utmost importance it is not the sole cause. The combination of the<br />
negative phase of an incoming blast wave, that follows the positive, is the cause of<br />
intense shearing forces in brain tissue. Current and previous blast mitigation strategies<br />
are also presented in Chapter 2. The use of composite or sandwich materials are highly<br />
recommended for blast protection due to their high strength and low weight. Density,<br />
porosity, acoustic impedance, geometric parameters various and other factors are<br />
characteristics that are taken into account during blast mitigation strategies.<br />
Chapter 3 is devoted entirely to the description of the fundamentals of blast wave<br />
mechanics. Initially, a description of the characteristic parameters of a blast wave and<br />
their significance presented. are Increased attention has been directed to the Rankine-<br />
Hugoniot equations governing shock wave propagation to their due relevance to the<br />
current research project, while analytical or numerically derived expressions describing<br />
shock wave interactions with solid materials are explained in detail. Finally, a<br />
constitutive model of materials under shock loading using the combination of the<br />
empirical Hugoniot linear model and the Mie-Gruineisen EOS is presented.<br />
The material properties of the employed filler and foam materials in this study are<br />
described in detail in Chapter 4. Uniaxial and hydrostatic compression tests on the VN<br />
600 Dertex were foam undertaken at MIT labs order in to determine the necessary key<br />
mechanical properties of the foam for modeling purposes. Furthermore, appropriate<br />
184
scaling rules were employed in order to scale the measured stress-strain curves at low<br />
strain rates to higher levels relevant to blast applications.<br />
The experimental investigation of the attenuation of filler materials inside internal<br />
channels of foam samples is investigated in Chapter 5. Two configurations, a control<br />
solid foam sample and a sample with a single core removed, were tested under shock<br />
tube loading conditions where the magnitude of the incoming shock wave was<br />
measured to be approximately 25 psi (1.72 105 Pa). The experimental setup and the<br />
employed shadowgraph technique for the visualization of the incoming and<br />
transmitted waves are described in detail. The filler materials that were tested are<br />
categorized in three groups; low and mid density solid, high density solid and fluid<br />
materials. The highest levels of attenuation were observed for high density materials<br />
because of their higher acoustic impedance values leading to a greater impedance<br />
mismatch between material interfaces; subsequently resulting in higher magnitude<br />
reflected and lower magnitude transmitted waves. Specifically, samples with glass shot<br />
and glycerin as filler materials exhibited the best results with a reduction of 45% and<br />
47% in peak transmitted pressure and an increase of 32% and 24% in positive duration<br />
respectively as compared to the solid foam control sample. The response of the<br />
transmitted wave using porous, low density solid materials provided the smallest levels<br />
of attenuation, achieving higher peak pressure values than the control sample, while<br />
also retaining characteristic features of air blasts such as negative phases. Finally, the<br />
frequency decomposition of the transmitted waves show that the highest attenuation<br />
level in the frequency domain is also attained by the use of high density solid and fluid<br />
materials.<br />
The response of foam samples under impulse loading is described in Chapter 6.<br />
Three configurations in total were examined; a solid foam sample, a foam sample with<br />
one internal cavity and a sample with two cavities, while air and water were considered<br />
as filler materials. These specimens were subjected to pressure loading on a portion of<br />
the top surface, while the pressure response on the bottom surface was calculated.<br />
During all three loading scenarios, the dual cavity water filled sample demonstrated<br />
185
superior stress attenuation capabilities compared to the remaining specimens. Elements<br />
outside the projection of the loading surface on the bottom surface experience<br />
significantly lower pressure values compared to solid foam samples. This response<br />
supports the idea that the use of filler materials inside internal cavities increases the<br />
attenuation of stress waves outside the immediate localized region of loading. Finally,<br />
high stress concentration areas are located inside the projected loading surface on the<br />
bottom surface and the vicinity of the internal foam supports.<br />
The numerical study that simulates the flat plate experiments is described in<br />
Chapter 7. An initial study aiming at the validation of shock propagation through air<br />
and reflection off a rigid wall was undertaken. Numerically derived values of the shock<br />
and particle velocities, density ratio across the shock and reflection coefficient were<br />
compared with theoretically obtained values. Furthermore, a parametric study was<br />
undertaken to assess the influence of artificial viscosity on shock propagation. The main<br />
portion of the chapter focuses on the development and assessment of the numerical<br />
model simulating the shock tube experiments. A solid foam specimen and water filled<br />
single cavity configuration were modeled and subjected to the experimental loading<br />
conditions. Comparison between experimental and numerical values of the peak<br />
transmitted pressure, rise and arrival time of the transmitted wave profile and positive<br />
phase duration indicate reasonable agreement between the two. Specifically, the peak<br />
transmitted overpressure is better matched in the water filled sample since the<br />
difference between experimental and numerical results is only 0.02 psi, while the<br />
numerical simulation seems to underestimate the peak overpressure for the solid foam<br />
case by approximately 0.2 psi. On the other hand, the numerical model of the solid foam<br />
achieves better compliance with experimental values for all temporal parameters; rise<br />
and arrival time of the pressure profile and positive phase duration. The transmitted<br />
wave temporal parameters for the water filled case are in general lower than the<br />
experimental, indicating a quicker response of the simulation. The vertical displacement<br />
of both top and bottom points on the foam region along the sample's axis of symmetry<br />
is smaller in the water filled sample than the solid foam. The water filled sample also<br />
186
demonstrates a smoother spatial distribution of the transmitted wave, without high<br />
pressure gradients, when compared to the solid foam case. Finally, the calculated<br />
reflection coefficient is in both cases approximately 2.97.<br />
8.2 Recommendations for Future Work<br />
The problem of blast induced TBI, as demonstrated by the statistics and facts in<br />
Chapters 1 and 2, is a complex phenomenon involving a number of disciplinary areas<br />
that requires the advancement of research in this field. Accordingly, this study has<br />
investigated a potential mean to mitigate blast waves and offer additional protection to<br />
personnel. However, additional research is required to fully understand the causes and<br />
the nature of this injury and develop effective protective means.<br />
This research study has primarily been concerned with identifying the dominant<br />
energy attenuating mechanisms and subsequently finding filler materials with good<br />
mitigation capabilities. Therefore, both experimental and numerical efforts have<br />
focused on geometrically simple flat samples. However, during the last months of this<br />
thesis, the manufacturing of a curved 3D liner incorporating channels that would<br />
facilitate the filler materials has progressed. An exploded view of the proposed liner<br />
follows in Figure 8.2-1. It is important to determine the attenuation effectiveness of a<br />
curved liner under shock loading and identify whether the attenuation capabilities<br />
measured in flat samples are also observed in more complex geometries.<br />
187
Figure 8.2-1: Exploded view of proposed 3D helmet liner<br />
Future work should also include the experimental and numerical investigation of<br />
the coupled liner - helmet response to shock loading since this is the ultimate goal of<br />
the research project. Additional phenomena that may influence the response of the<br />
system may stem from the interaction of the liner and helmet.<br />
Furthermore, additional work should be focused on identifying even more efficient<br />
internal geometries that would increase the already attained attenuation levels.<br />
Multiple material interfaces along the wave propagation direction providing additional<br />
impedance mismatches is such an option. On the other hand, emphasis should also be<br />
placed in the materials aspect and new energy absorbing materials should be used or<br />
combinations of previously tested materials, such as glass shot placed inside a glycerin<br />
mixture.<br />
In regard to the numerical aspect, efforts should be directed at addressing the<br />
limitations encountered and identified during the simulations of the material response<br />
under shock loading, such that a more physically accurate model can be applied for<br />
future studies. Potential fields for additional work include the determination of more<br />
accurate Mie-Grineisen EOS parameters for the Dertex foam and the application of a<br />
188
spherical incoming wave. Furthermore, the capabilities of the presently developed<br />
shock model should be further explored. Insight into the mitigation capabilities of the<br />
investigated samples should be provided by calculating the percentage of the incoming<br />
energy that is absorbed by the solid and the boundary conditions and the percentage of<br />
energy that is transmitted.<br />
189
190
A. Appendix A - Scaling of Mechanical Properties of VN<br />
600 Foam<br />
The stress-strain curves of the VN 600 foam obtained through the uniaxial and<br />
hydrostatic tests correspond to low strain rates not representative of blast loading<br />
applications. In order to scale the measured curves to higher strain rates Equation A-1,<br />
first suggested by Nagy, is employed to predict the stress as a function of strain and<br />
strain rate [46, 47].<br />
as= Go (e){-- Equation A-1<br />
where n(s) = a + bE, power coefficient for rate dependency.<br />
(ooo): reference data<br />
1 : strain rate of reference data<br />
In order to obtain these material parameters Equation A-1 was manipulated by<br />
applying the logarithm to both parts. Hence,<br />
log j lrb<br />
log =n(s) log( -C- 'e = a + be -> Y = a + bs Equation A-2<br />
Therefore, by using Equation A-2 the material constants can be determined by fitting<br />
a linear function to the Y plots. To determine these constants, a 9th order polynomial<br />
was fit to the experimental data in order to smoothen out some experimental errors that<br />
191
were observed for small strains especially at the smallest strain rates. It is noted that in<br />
order to obtain the material constants for both hydrostatic and uniaxial compression the<br />
same procedure for both of them was followed. The two following figures show the<br />
fitted curves for the uniaxial Figure A-1 and hydrostatic Figure A-2 experimental data.<br />
The fits were extremely accurate for all cases with a minimum R 2 value of R 2 =0.999.<br />
X 105<br />
Ukll Stress- Strain Cunves<br />
stress 50 w. strain 50<br />
----- mm 50 rIi ItI1<br />
7 - stress 100 v. sstrain 100 - - - - - - - t - - --- - -t - - - - - - - - - - - - - - -<br />
100 mml Rt<br />
stress s. 200 strain 200<br />
6 - -<br />
-0mr~~l - -. -<br />
stress %. strain 500 500 1<br />
1 -- -500 mmin I<br />
51<br />
0 - -- - -H- - -- -- - - -- --- - -, - - - - - - -- - - - -- - T - - --~-T - - - - - T - - -~<br />
0 0.1 0.2 0.3 0.4 0.5 0.6 0.7<br />
Strain<br />
Figure A-1: 9th order polynomial fitted curves to uniaxial experimental data of VN 600 foam<br />
192
Hydrostatic - Strain Pressure Cures<br />
Q. I<br />
08 - - - - -t<br />
6- -- - - - -- - -<br />
2 - - --- - - - - - - - - - - --- - - - - - - - - - -- - - - --- -- - - - - -<br />
0 0.1 0.2 0.3 0.5 0.6 0.7 0.8<br />
Volurnetric Strain<br />
Figure A-2: 9th order polynomial fitted curves to hydrostatic experimental data of VN 600 foam<br />
Before calculating the a and b material parameters it is interesting to observe that<br />
when stress is plotted against strain rate on a log-log scale for different strain levels, the<br />
data form a family of almost straight lines with tangent n that is approximately a linear<br />
function of strain E. This behavior is illustrated in the following two figures Figure A-3<br />
and A-4 for uniaxial and hydrostatic compression respectively [46].<br />
193
101<br />
Strain - Stress Rate<br />
T I T I- F _- -I + 10%/ Strain _<br />
- . - - - 1 - L - - - - 20% Strain .<br />
_ - - -. . . . . .<br />
30% Strain<br />
F<br />
L _ _I<br />
T<br />
. - -- - -1 -<br />
F I F<br />
1. - --<br />
F --<br />
T -<br />
L - -. -<br />
- --- 40% Strair<br />
50% Strain<br />
L -- 60% Strin<br />
70% Strain<br />
L - -- - -. ... 0 - - - - - - - -- -+<br />
- T | 1 I 1 | | | 1 | 1<br />
L 1 L -I-- -- I I I | | 1<br />
- - - - - - -- F<br />
- -- - 4 -<br />
T I I- - --<br />
S - _ _ -- -..- -- - -- --<br />
4- - I- -4 - - - --- -4 -1- - -1- - - - - - 4<br />
.- - - - - 4.- - - -1- - -4.- -1| - 1- - - -4 -- 1- k- - - -- -- -- - 4 - - -- - 4 - -1- - 1- - -4 -1!- -<br />
L - - I 4 I 1- -I- L - - - - -- 4<br />
I<br />
- -- - - - -- I - 1 -- - -- - -~-- -- - T - - - -r --- - - - -- - -<br />
I<br />
- - -<br />
I<br />
-<br />
I I<br />
--<br />
I<br />
- --T I<br />
F<br />
I<br />
I<br />
1<br />
I I I.<br />
I -F I I I -- .<br />
I<br />
I<br />
I<br />
- I<br />
I<br />
I<br />
I<br />
I<br />
I<br />
1 I<br />
I I I<br />
| I -1 - I -<br />
I I I I II | I I<br />
I L - -I - I I I - - 1 I I<br />
I I I I I I I I I I I | | I | |I<br />
| I | 1 I I I I I I I I I I I<br />
Strain Rate [1/s]<br />
Figure A-3: Power law strain rate sensitivity of VN 600 foam for uniaxial compression<br />
10 -<br />
10<br />
10 '--<br />
- -<br />
-T<br />
- --4- --<br />
- -4- -<br />
_ I_1_<br />
Ii<br />
I T<br />
- I 1 - +I<br />
I |<br />
I<br />
Strain - Stress Rate<br />
L L L I L - -- --0- - L<br />
L L - J -I- L - _ _ - - - - .L -. - - -.. L--<br />
L L L -LI--- - - --<br />
I I I II I<br />
I I<br />
I- - - - I- - - - - - - - - - - - --- 1-- - - 4 - -<br />
+ - I- -<br />
II<br />
- - - -- - - - - - - -<br />
-<br />
t- -I|ITI-L<br />
4I... I I I I I I<br />
- - - 4 - - - - - - - - -- - -1--<br />
L - _ _ - _ - -<br />
4- -<br />
1--F - -4 - I- f- - - - -- - + - -- - 1-- - - -<br />
- - L 1 -4 -- - F- - --- - --<br />
- -- - -I - - -I - -<br />
F L _- _ 1 _ L -_ - _ _ - 4 - - - -<br />
I 1-4- ,-<br />
4 4 -I-<br />
I<br />
IF<br />
I I II<br />
1- - -<br />
I<br />
4<br />
I I<br />
I I I I<br />
I I I I I I I<br />
10-2<br />
Strain Rate [1/s]<br />
10% Strain -<br />
- 20% Strain -<br />
L30% Strain - .<br />
40% Strain<br />
50% Strain<br />
60% strain -<br />
70% Strain<br />
I I I I I<br />
I I I I 1<br />
I I I I<br />
-- -r- L - L<br />
I I I I I<br />
1- - - F -1- I<br />
L --L -F J I |<br />
I I I I I<br />
I I I I I<br />
I I I I I<br />
I I I I I<br />
I I I I I<br />
Figure A-4: Power law strain rate sensitivity of VN 600 foam for hydrostatic compression<br />
The two previous graphs indicate that there is an approximate linear correlation<br />
between stress values and the logarithm of strain rate for strain levels greater than 30%.<br />
However, for strain levels up to 30%, for both hydrostatic and uniaxial test data, this<br />
linear correlation does not extend throughout the whole span of strain rates. This might<br />
194<br />
-
e due to the fact that for small strain levels there are some anomalies that are evident<br />
in the experimental data and derived stress-strain curves, thus affecting the sensitivity<br />
of the data at small strain levels and low strain rates or this may stem from possible<br />
limitations in the predictive model at these strain levels.<br />
The calculation of the power coefficient for rate dependency n(E) follows the process<br />
that was described earlier with the help of Equation A-2 and a least square fit of the<br />
linear function. The reference data set (oo,Eo) is the experimental set at the lowest strain<br />
rate, while the experimental data that was used to calculate the following expression for<br />
n(E) correspond to the highest experienced strain rate.<br />
A-1.<br />
The resulting n(E) for both loading conditions is presented in the following Table<br />
Table A-1: Rate sensitivity power coefficient n(s) of VN 600 foam for uniaxial and hydrostatic loading<br />
195
196
B. Appendix B - Impulse Loading<br />
The pressure profiles and the contours of the accumulated stress that are plotted as<br />
part of the alternate investigation loading of Chapter 6: "Numerical Simulation of<br />
Material Response under Impulse Loading "are depicted in this paragraph. The<br />
pressure profiles of the eight key elements are initially depicted on based the<br />
measurement location; therefore, graph one for the profiles subject 1 atm to and one for<br />
3 atm loading are presented for each location.<br />
Location A<br />
[x1.E6]<br />
0.4<br />
0.2-<br />
liii<br />
0.0I<br />
-o. 0.0 1.0 2.0 3.0 4.0 5.0 6.0 [x1.E-3]<br />
Time [s]<br />
Figure B-1: Pressure profiles at element A of bottom surface at latm loading<br />
197<br />
press A Air dual latmn<br />
-- - - press A Air single latm<br />
press A H20 dual latm<br />
- - - - press A H20 single latm<br />
press A solid latm<br />
1111
[x1.E6]<br />
0.40<br />
0.20<br />
0.00<br />
-0.20<br />
Location B<br />
[x1.E6]<br />
0.25<br />
0.20<br />
0.10<br />
0.05<br />
0.00<br />
0.0<br />
Time [s]<br />
6.0 [xl.E-3]<br />
press A Air dual 3atm<br />
- - - - - press A Air single 3atm<br />
press A H20 dual 3atm<br />
- - - - - press A H20 single 3atrn<br />
--- press A solid 3atm<br />
Figure B-2: Pressure profiles at element A of bottom surface at 3atm loading<br />
-L.V<br />
1.U Z.u<br />
3.0<br />
Time [s]<br />
4.0 5.0 6.0 [x1.E-3]<br />
-- press B Air dual 1atm<br />
---- press B Air single latm<br />
Figure B-3: Pressure profiles at element B of bottom surface at latm loading<br />
198<br />
..........<br />
press B H20 dual latm<br />
- - - - press B H20 single latm<br />
- - press B solid l atm
[x1.E6]<br />
0.40<br />
0.30<br />
L 0.20<br />
0.10<br />
0.00<br />
-0.10<br />
Location C<br />
[xl.E3J<br />
20.<br />
15.<br />
10.<br />
5.<br />
0.<br />
-5.<br />
-10.<br />
0.0 [x1.E-3]<br />
Time [s]<br />
press I Air dual 3atm<br />
press 8 Air single 3atm<br />
press 8 H20 dual 3atm<br />
- - - - - press B H20 single 3atm<br />
press 8 solid atm<br />
Figure B-4: Pressure profiles at element B of bottom surface at 3atm loading<br />
-15.<br />
0. 3.0<br />
Time [s]<br />
Figure B-5: Pressure profiles at element C of bottom surface at latm loading<br />
199<br />
[xl1.E-3]<br />
press C Air dual l atm<br />
- - - - press C Air single 1atm<br />
press C H20 dual latm<br />
- - - - press C H20 single latm<br />
press C solid latm
[x1.E3]<br />
60.-<br />
40.<br />
-20.<br />
-20.<br />
-40.<br />
Location D<br />
[xl.E6]<br />
0.20-<br />
0.15-<br />
0.10-<br />
0.0 1.0 2.0<br />
4.0 6.0 [x1.E-3]<br />
Time [s]<br />
0.05 4<br />
0.00-<br />
-0.05 -<br />
press C Air dual 3atm<br />
- - - - - press C Air single 3atm<br />
Figure B-6: Pressure profiles at element C of bottom surface at 3atm loading<br />
press C H20 dual 3atm<br />
press C H20 single 3atm<br />
press C solid 3atm<br />
-0.10<br />
0.0 .iU O. e s<br />
[x1 .E-3]<br />
Time [s]<br />
press D Air dual latm<br />
S-- press D Air single latn<br />
press D H20 dual latm<br />
- - - - press D H20 single latm<br />
... ..-. press D solid l atm<br />
Figure B-7: Pressure profiles at element D of bottom surface at latm loading<br />
200
[x1.E6]<br />
0.40<br />
0.35<br />
0.30<br />
0.25<br />
0.20<br />
0.15<br />
0.10<br />
0.05<br />
0.00-<br />
-0.05<br />
-0.10<br />
0.0 1.0 2.0<br />
3.0<br />
Time [s]<br />
Location G<br />
[x1.E3]<br />
60.<br />
40.<br />
20.<br />
0.<br />
-20.<br />
-40.<br />
0.0<br />
6.0 [x1.E-3]<br />
press D Air dual 3atm<br />
- - - - - press D Air single 3atm<br />
press D H20 dual 3atm<br />
- - - - - press D H20 single 3atm<br />
press D solid 3atm<br />
Figure B-8: Pressure profiles at element D of bottom surface at 3atm loading<br />
Time [s]<br />
Figure B-9: Pressure profiles at element G of bottom surface at latm loading<br />
201<br />
(x1.E-3]<br />
press G Air dual latm<br />
- - - - press G Air single latn<br />
press G H20 dual latm<br />
- - - - press G H20 single 1 atm<br />
press G solid latm
[xl-E6]<br />
L<br />
0.04<br />
0.02<br />
0.00<br />
-0.02-<br />
-0.04<br />
Location H<br />
[xl.E3]<br />
-0.06<br />
O.0 2.0 3.0<br />
Time [s]<br />
5.-<br />
0.<br />
-10.<br />
0.0<br />
4.0 5.0 6.0 '[x1.E-3]<br />
press G Air dual 3atm<br />
- - - - - press G Air single 3atm<br />
Figure B-10: Pressure profiles at element G of bottom surface at 3atm loading<br />
:.0Q<br />
Time [s]<br />
press G H20 dual 3atm<br />
press G H20 single 3atm<br />
press G solid 3atm<br />
[x1.E-3]<br />
press H Air dual latm<br />
--- - press H Air single 1 atm<br />
press H H20 dual latm<br />
- - - - press H H20 single latm<br />
Figure B-11: Pressure profiles at element H of bottom surface at latm loading<br />
202<br />
press H solid latm
[xl E3]<br />
20.<br />
10.<br />
0.<br />
-10.<br />
-20.<br />
0.0<br />
Location I<br />
[x1.E3]<br />
20.<br />
15.<br />
10.<br />
5.<br />
0.<br />
-5.<br />
-10.<br />
Z.u<br />
Time [s]<br />
press H Air dual 3atm<br />
- - - - - press H Air single 3atm<br />
press H H20 dual 3atm<br />
press H H20 single 3atm<br />
press H solid 3atm<br />
Figure B-12: Pressure profiles at element H of bottom surface at 3atm loading<br />
Time [s]<br />
Figure B-13: Pressure profiles at element J of bottom surface at latm loading<br />
203<br />
41.V<br />
6.0 [x1.E-3]<br />
[xl.E-3]<br />
press J Air dual l atm<br />
- - - - press J Air single 1atm<br />
press J H20 dual 1atm<br />
- - - - press J H20 single latm<br />
press J solid 1 atm
[xlE6]<br />
0.04<br />
S0.00<br />
-0.04<br />
Location L<br />
[xl.E3]<br />
-0.08 0.0 [x1.E-3]<br />
10.<br />
5.-<br />
0.<br />
-5.-<br />
-10.-<br />
Time [s]<br />
press J Air dual 3atm<br />
press J Air single 3atm<br />
press J H20 dual 3atm<br />
- - - - - press J H20 single 3atm<br />
.. -- .-- press pI 3 solid 3atm<br />
Figure B-14: Pressure profiles at element J of bottom surface at 3atm loading<br />
Time [s]<br />
[x1.E-3]<br />
- - - -<br />
press L Air dual 1 atm<br />
press L Air single l atm<br />
press L H20 dual latm<br />
- - - - press L H20 single latm<br />
----.. ..... press L solid 1 atm<br />
Figure B-15: Pressure profiles at element L of bottom surface at latm loading<br />
204
[x1.E3]<br />
30.<br />
20.<br />
10.<br />
0.<br />
-10.<br />
-20.<br />
-30.<br />
0.0<br />
Time [s]<br />
press L Air dual 3atm<br />
- - - - - press L Air Single 3atm<br />
press L H20 dual 3atm<br />
- - - - - press L H20 single 3atm<br />
press L solid 3atm<br />
Figure B-16: Pressure profiles at element L of bottom surface at 3atm loading<br />
205<br />
[x1.E-3]
The contour plots of the accumulated pressure of the elements of the back surface<br />
for all three loading levels follow.<br />
-0.05 u1at<br />
-0.05|-<br />
-0.05<br />
1 atm<br />
3 atm<br />
2 atm<br />
Figure B-17: Integrated absolute pressure values for bottom surface of solid foam sample<br />
206
- I I I I<br />
-0.15 -0.1 -0.05 0 0.05 0.1<br />
1 atm<br />
I I I I I 1 1<br />
-015 -01 -005 0 0.05 01 0.15<br />
3 atm<br />
I I I I I I I<br />
-015 -0.1 -005 0 0.05 0.1 0.15<br />
2 atm<br />
Figure B-18: Integrated pressure absolute values for bottom surface of air filled dual cavity configuration<br />
207
J00 0.055<br />
emo aaam 2:mo am<br />
001<br />
1 . 0 0.05 0.0 5 1 0 5<br />
00:::/093's--<br />
08<br />
gr. 67/g um50<br />
1 atm3 2 at<br />
.11<br />
Fiur -: 9 Ite:aedabltepess 'ur e vausfrbto ufces ofarflldsnlecvt<br />
QM:-.&@@@%%3<br />
-. '' / 0008 R 7/configur/ation<br />
er su zes ma san208~<br />
011<br />
30510 01mmam .505 0 0.05 0* 0 *<br />
Q
C.1 -<br />
005-<br />
.05<br />
0-<br />
I I I I<br />
0 15 -01 -005 0<br />
1 atm<br />
0.1-<br />
0.05-<br />
0 -<br />
405 -<br />
I I<br />
I I 0.05 1 0 0<br />
I I<br />
-0.15 -OA -005 a<br />
I I I iI Ii<br />
-0.15 -01 -0.05 0 0.05 0.1 0.15<br />
3 atm<br />
2 atm<br />
Figure B-20: Integrated absolute pressure values for bottom surface of water filled dual cavity<br />
configuration<br />
209<br />
I 1 1<br />
005 0.1 0 15
01<br />
00 0.05<br />
-01<br />
10.05 01<br />
-011 0.05 0 005 01 010<br />
atm 2 atm<br />
0.05 -. 1190<br />
1005-0.05 5<br />
5. -0.<br />
015 ) .5 -<br />
I n<br />
3 atm<br />
Figure B-21: Integrated absolute pressure values for bottom surface of water filled single cavity<br />
configuration<br />
210
References<br />
1. C. Wilson, Improvised Explosive Devices (IEDs) in Iraq and Afghanistan: Effects<br />
and Countermeasures, CRS Report for Congress, 2007<br />
2. H. Fischer, United States Military Casualty Statistics: Operation Iraqi Freedom and<br />
Operation Enduring Freedom, Congressional research Service, 2009<br />
3. Traumatic Brain Injury among Members of Active Components, U.S. Armed Forces,<br />
1997-2006, Medical Surveillance Monthly Report, 2007<br />
4. S. Okie, Traumatic Brain Injury in the War Zone, The New England Journal of<br />
Medicine, 2005<br />
5. Douglas Stewart, A Protective Helmet Liner Incorporating Fluid Channels, Dublin,<br />
2008<br />
6. Explosions and Blast Injuries: A Primer for Clinicians, Center for Disease Control<br />
and Prevention, 2006<br />
7. P.D. Smith J.G. Hetherington, Blast and Ballistic Loading of Structures, Butterworth<br />
- Heinemann Ltd, Great Britain, 1994<br />
8. I.G. Bowen, E.R. Fletcher et al., Estimates of man's tolerance to the direct effect of air<br />
blast, Technical Progress Report DASA-2113, Defense Atomic Support Agency, US<br />
Department of Defense, 1968<br />
9. A. Courtney, M. Courtney, A Thoracic Mechanism of Mild Traumatic Brain Injury<br />
Due to Blast Pressure Waves, Nature Precedings, 2008<br />
10. Traumatic Brain Injury, Deployment Health Clinical Center, 2009<br />
11. T. El Sayed, A. Mota et al., Biomechanics of traumatic brain injury, Computational<br />
Methods in Applied Mechanical Engineering, 2008<br />
12. S. Kleiven, Finite element modeling of the human head, Ph.D. thesis, Royal Institute<br />
of Technology, Stockholm, Sweden, 2002<br />
13. R.P. Granacher, Traumatic Brain Injury, CRC Press, 2003<br />
211
14. Traumatic brain injury in the front line, neurophilosophy.wordpress.com, 2007<br />
15. C.W. Hoge, D. McGurk, et al., Mild Traumatic Brain Injury U.S. in Soldiers<br />
Returning from The Iraq, New England Journal of Medicine, 2008<br />
16. M. Chavko, W.A. Koller, et al., Measurement of blast wave by a miniature fiber optic<br />
pressure transducer in the rat brain, Journal of Neuroscience methods, 2006<br />
17. S.M. Moochhala et al., Neuroprotective role of amniguanidine in behavioral changes<br />
after blast injury, J. Trauma, 2004<br />
18. T. Kodama, MR Hamblin, AG Doukas, Cytoplasmic molecular with delivery shock<br />
waves: importance of impuls, Journal of Biophysics, 2000<br />
19. A. Suneson, H-A Hansson, et al., Pressure wave injuries to the nervous system<br />
caused by high-energy missile extremity impact. Part II. Distant effects on the<br />
central nervous system - A light and electron microscopic study on pigs, Journal of<br />
Trauma, 2003<br />
20. E. Fournier, D. Sullivan, et al., Blast Headform Development, Defense R&D Canada<br />
- Valcartier, 2007<br />
21. Matthew Alley, Explosive Blast Loading Experiments for TBI Scenarios:<br />
Characterization and Mitigation, MSc Thesis, West Lafayette, 2009<br />
22. S. Kleiven, W. Hardy, Correlation of an FE model of the human head with local<br />
brain motion - consequences for injury prediction, Proceedings 46th Stapp Car Crash<br />
Conference, 2002<br />
23. J-S Raul, C. Deck et al., Finite-element models of the human head their and<br />
applications in forensic practice, International journal of Legal Medicine, 2008<br />
24. Z. Xue, J.W. Hutchinson, Preliminary assessment of sandwich plates subject to blast<br />
loading, International<br />
Journal of Mechanical Sciences, 2003<br />
25. Z. Xue, J.W. Hutchinson, A comparative study of impulse resistant metal sandwich<br />
plates, International Journal of Impact Engineering,<br />
2003<br />
26. N. Kambouchev, Analysis of blast mitigation strategies exploiting fluid structure<br />
interaction, MIT, Cambridge MA, 2007<br />
27. J. Main, G. Gazonas, Uniaxial crushing of sandwich plates under air blast: Influence<br />
of mass distribution, International Journal of Solids and Structures, 2007<br />
- 212
28. S. Zhuang, G. Ravichandran, et al., An experimental investigation of shock wave<br />
propagation in periodically layered composites, Journal of the Mechanics and<br />
Physics of solids, 2002<br />
29. J. Pfannes, S. Surajit, Energy absorption and recovery in tapered granular chains:<br />
small chains and low tapering, Mat. Rec. Soc. Symp. Proced. Vol. 759, 2003<br />
30. D. Schwer, K. Kailasanath, Blast mitigation by water mist (3) Mitigation of confined<br />
and unconfined blasts, Naval Research Laboratory, Washington, 2006<br />
31. B.E. Gel'fand, M.V. Sil'nikov, A.I. Mikhailin, A.V. Orlov, Attenuation of blast<br />
overpressures from liquid in an elastic shell, Combustion, Explosion and Shock<br />
Waves, 2001<br />
32. W.E. Baker, Explosions in air, <strong>University</strong> of Texas Press, Austin, 1973<br />
33. J.M. Dewey, The air velocity in blast waves from T.N.T. explosions, Proceedings of<br />
Royal Society of London, 1963<br />
34. J.D. Anderson, Fundamentals of Aerodynamics, McGraw-Hill, New York, New<br />
York, Third Edition, 2001<br />
35. J.A. Zukas, W.P. Walters, Explosive Effects and Applications, Springer, New York,<br />
1998<br />
36. G.F. Kinney, K.J. Graham, Explosive Shocks in Air, Second Edition, Springer-Verlag,<br />
New York, 1985<br />
37. G. Taylor, The Formation of a Blast Wave by a Very Intense Explosion. I. Theoretical<br />
Discussion, Proceedings of the Royal Society of London, Series A, 201 (1065):159-174,<br />
1950<br />
38. G. Taylor, The Formation of a Blast Wave by a Very Intense Explosion. I. The atomic<br />
explosion of 1945, Proceedings of the Royal Society of London, Series A, 201<br />
(1065):175-186, 1950<br />
39. J. Neumann, The point source solution, In Collected Works, volume 6, Pergamon,<br />
1943<br />
40. N. Kambouchev, L. Noels, R. Radovitzky, Nonlinear compressibility effects in fluidstructure<br />
interaction and their implications on the air-blast loading of structures,<br />
Journal of Applied Physics, 2006<br />
213
41. S. Chen, Study on Mach Reflection and Mach Configuration<br />
42. D.S. Drumheller, Introduction to Wave Propagation in Nonlinear and Fluids Solids,<br />
Cambridge <strong>University</strong> Press, United Kingdom, 1998<br />
43. A. Jdrusalem, Continuum Models of the Deformation Mechanisms in<br />
Nanocrystalline Metals, MIT, Cambridge MA, 200<br />
44. L. Gibson, M.F. Ashby, Cellular Solids Structure and Properties, Cambridge<br />
<strong>University</strong> Press, 1997, Cambridge<br />
45. ABAQUS Manual v.6.9<br />
46. J. Zhang, N. Kikuchi, et al., Constitutive Modeling of Polymeric Foam Material<br />
Subjected to Dynamic<br />
1998<br />
Loading, Crash International Journal of Impact Engineering,<br />
47. S. Ouellet et al., Compressive of Response polymeric Foams under Quasi-Static,<br />
Medium and High Strain Rate Conditions, Journal of Polymer Testing, 2006<br />
48. C. Mader, W. Carter, An equation of State Shocked for Polyurethane Foam, Los<br />
Alamos Scientific Laboratory, New Mexico, 1968<br />
49. T. Hamada, Y. Nakamura, S. Itoh, The Performane of Pressure Vessel Using<br />
Concentric Double Cylindrical High Explosive, Journal of Pressure Vessel<br />
Technology, 2004<br />
50. N.J. Mills et al., Bicycle Helmet Design, Journal of Materials, 2006<br />
51. Y. Masso - Moreu et al., Impact Compression of Polystyrene Foam Pyramids,<br />
International journal of Impact Engineering, 2002<br />
52. N.J. Mills et al., Finite - Element Analysis of Bicycle Helmet Oblique Impacts,<br />
International Journal of Impact Engineering, 2007<br />
53. www.nanogel.com<br />
54. www.eagerplastics.com<br />
55. T. Hamada, Y. Nakamura, S. Itoh, The Performane of Pressure Vessel Using<br />
Concentric Double Cylindrical High Explosive, Journal of Pressure Vessel<br />
Technology, 2004<br />
214
56. http://www.3d-cam.com/materials/acrylic.asp<br />
57. L.F. Mori, S. Lee et al., Deformation and Fracture Modes of Sandwich Structures<br />
Subjected to Underwater Impulsive Loads, Journal of Mechanics of Materials and<br />
Structures, 2007<br />
58. www.engineeringtoolbox.com<br />
59. http://encyclopedia.jrank.org/articles/pages/1182/Schlieren-and-Shadowgraph-<br />
Photography.html<br />
60. G. Settles, Schlieren and Shadowgraph Imaging in the Great Outdoors, Proceedings<br />
of PSFVIP-2, Honolulu, 1999<br />
61. http://en.wikipedia.org<br />
62. M. Kandula, R. Freeman, On the interaction and coalescence of spherical blast<br />
waves, Shock Waves, 2008<br />
63. Side curtain airbag impactor test, ABAQUS 6.7 Example Problem Manual<br />
64. A. Jerusalem, R. Radovitzky, A Continuum Model of Nanocrystalline Metals under<br />
Shock Loading, Modelling and Simulation in Materials Science Engineering, 2008<br />
215