Long-term Forecast of Medicaid Enrollment Spending in Alaska:
Long-term Forecast of Medicaid Enrollment Spending in Alaska:
Long-term Forecast of Medicaid Enrollment Spending in Alaska:

Create successful ePaper yourself
Turn your PDF publications into a flip-book with our unique Google optimized e-Paper software.
<strong>Enrollment</strong><br />
Cash, which are projected to grow annually at 3.3 percent and 2.5 percent,<br />
respectively. SSI/APA/LTC Cash is the eligibility group that is projected to have<br />
the largest growth <strong>in</strong> total enrollees and is projected to grow from 20,900 to<br />
34,300 enrolled <strong>in</strong> 2029, an <strong>in</strong>crease <strong>of</strong> 13,400 enrollees.<br />
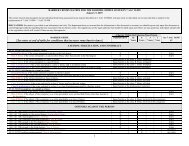
Table 2: <strong>Enrollment</strong> levels <strong>of</strong> eligibility groups associated with the elderly<br />
tend to grow faster than the 1.1 percent average<br />
MEDICAID ENROLLMENT FOR SELECT ELIGIBILITY GROUPS<br />
Eligibility group 2009 2014 2019 2024 2029<br />
Annual<br />
Change<br />
Title XIX Kids 43,999 46,969 48,878 49,262 48,802 0.5%<br />
Title XXI Kids 6,367 6,908 7,232 7,482 7,726 1.0%<br />
SSI/APA/LTC Cash 20,892 24,503 28,253 31,687 34,279 2.5%<br />
LTC Non-cash 1,838 2,170 2,568 3,038 3,501 3.3%<br />
Source: <strong>Medicaid</strong> Budget Group, MESA Model<br />
The Title XIX Kids eligibility group is currently the largest eligibility group. It is<br />
projected to ma<strong>in</strong>ta<strong>in</strong> that dist<strong>in</strong>ction even though its 0.5 percent annual growth<br />
is among the slowest. It is projected to reach its enrollment peak <strong>in</strong> 2023 and then<br />
decrease thereafter.<br />
Total <strong>Medicaid</strong> Claims <strong>Spend<strong>in</strong>g</strong> 7<br />
Total <strong>Medicaid</strong> spend<strong>in</strong>g is expected to <strong>in</strong>crease by 5.8 percent annually<br />
between 2009 and 2029. This projection is based on the program as it currently<br />
exists and does not consider policy changes that may occur throughout the<br />
forecast period. Service categories that primarily serve the elderly are projected<br />
to have the highest growth dur<strong>in</strong>g the forecast period. These services also tend<br />
to have the highest average per capita costs.<br />
Table 3: <strong>Spend<strong>in</strong>g</strong> on the elderly grows nearly twice as fast as spend<strong>in</strong>g on<br />
other age groups<br />
MEDICAID SPENDING BY AGE GROUP FOR SELECTED YEARS, 2009-2029 (IN MILLIONS)<br />
Age Group 2009 2014 2019 2024 2029<br />
Annual<br />
Growth<br />
Children (0-19)<br />
Work<strong>in</strong>g Age<br />
$446.7 $595.9 $775.7 $951.9 $1,125.9 4.7%<br />
Adults (20-64) $454.8 $611.2 $777.1 $950.0 $1,143.0 4.8%<br />
Elderly (65+) $180.3 $293.3 $480.6 $757.6 $1,102.0 9.5%<br />
Total $1,081.8 $1,500.5 $2,033.4 $2,659.4 $3,370.8 5.8%<br />
Source: <strong>Medicaid</strong> Budget Group: MESA Model<br />
7 All tables and figures are nom<strong>in</strong>al unless otherwise noted. Nom<strong>in</strong>al, or actual spend<strong>in</strong>g, is the<br />
projected future value without adjust<strong>in</strong>g for <strong>in</strong>flation. Please see Appendix C for real spend<strong>in</strong>g<br />
tables.<br />
<strong>Long</strong> Term <strong>Forecast</strong> <strong>of</strong> <strong>Medicaid</strong> <strong>Enrollment</strong> and <strong>Spend<strong>in</strong>g</strong> <strong>in</strong> <strong>Alaska</strong>: 2009‐2029<br />
11