Long-term Forecast of Medicaid Enrollment Spending in Alaska:
Long-term Forecast of Medicaid Enrollment Spending in Alaska:
Long-term Forecast of Medicaid Enrollment Spending in Alaska:

Create successful ePaper yourself
Turn your PDF publications into a flip-book with our unique Google optimized e-Paper software.
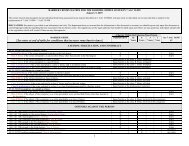
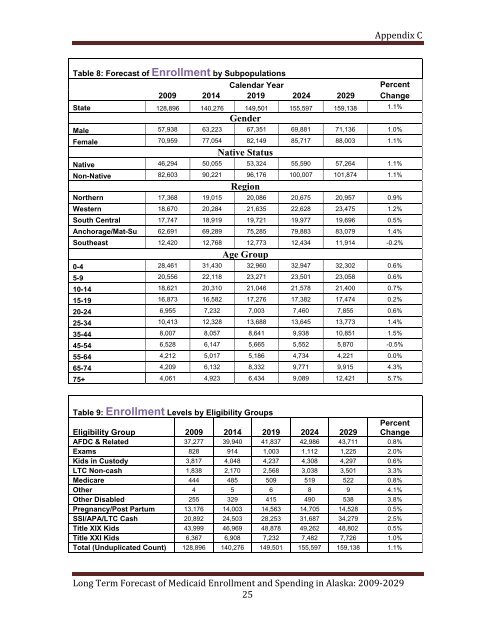
Appendix C<br />
Table 8: <strong>Forecast</strong> <strong>of</strong> <strong>Enrollment</strong> by Subpopulations<br />
Calendar Year Percent<br />
2009 2014 2019 2024 2029 Change<br />
State 128,896 140,276 149,501 155,597 159,138 1.1%<br />
Gender<br />
Male 57,938 63,223 67,351 69,881 71,136 1.0%<br />
Female 70,959 77,054 82,149 85,717 88,003 1.1%<br />
Native Status<br />
Native 46,294 50,055 53,324 55,590 57,264 1.1%<br />
Non-Native 82,603 90,221 96,176 100,007 101,874 1.1%<br />
Region<br />
Northern 17,368 19,015 20,086 20,675 20,957 0.9%<br />
Western 18,670 20,284 21,635 22,628 23,475 1.2%<br />
South Central 17,747 18,919 19,721 19,977 19,696 0.5%<br />
Anchorage/Mat-Su 62,691 69,289 75,285 79,883 83,079 1.4%<br />
Southeast 12,420 12,768 12,773 12,434 11,914 -0.2%<br />
Age Group<br />
0-4 28,461 31,430 32,960 32,947 32,302 0.6%<br />
5-9 20,556 22,118 23,271 23,501 23,058 0.6%<br />
10-14 18,621 20,310 21,046 21,578 21,400 0.7%<br />
15-19 16,873 16,582 17,276 17,382 17,474 0.2%<br />
20-24 6,955 7,232 7,003 7,460 7,855 0.6%<br />
25-34 10,413 12,328 13,688 13,645 13,773 1.4%<br />
35-44 8,007 8,057 8,641 9,938 10,851 1.5%<br />
45-54 6,528 6,147 5,665 5,552 5,870 -0.5%<br />
55-64 4,212 5,017 5,186 4,734 4,221 0.0%<br />
65-74 4,209 6,132 8,332 9,771 9,915 4.3%<br />
75+ 4,061 4,923 6,434 9,089 12,421 5.7%<br />
Table 9: <strong>Enrollment</strong> Levels by Eligibility Groups<br />
Eligibility Group 2009 2014 2019 2024 2029<br />
Percent<br />
Change<br />
AFDC & Related 37,277 39,940 41,837 42,986 43,711 0.8%<br />
Exams 828 914 1,003 1,112 1,225 2.0%<br />
Kids <strong>in</strong> Custody 3,817 4,048 4,237 4,308 4,297 0.6%<br />
LTC Non-cash 1,838 2,170 2,568 3,038 3,501 3.3%<br />
Medicare 444 485 509 519 522 0.8%<br />
Other 4 5 6 8 9 4.1%<br />
Other Disabled 255 329 415 490 538 3.8%<br />
Pregnancy/Post Partum 13,176 14,003 14,563 14,705 14,528 0.5%<br />
SSI/APA/LTC Cash 20,892 24,503 28,253 31,687 34,279 2.5%<br />
Title XIX Kids 43,999 46,969 48,878 49,262 48,802 0.5%<br />
Title XXI Kids 6,367 6,908 7,232 7,482 7,726 1.0%<br />
Total (Unduplicated Count) 128,896 140,276 149,501 155,597 159,138 1.1%<br />
<strong>Long</strong> Term <strong>Forecast</strong> <strong>of</strong> <strong>Medicaid</strong> <strong>Enrollment</strong> and <strong>Spend<strong>in</strong>g</strong> <strong>in</strong> <strong>Alaska</strong>: 2009‐2029<br />
25