

Het gebruik van kinesitherapie en van fysische geneeskunde ... - KCE
Het gebruik van kinesitherapie en van fysische geneeskunde ... - KCE
Het gebruik van kinesitherapie en van fysische geneeskunde ... - KCE

You also want an ePaper? Increase the reach of your titles
YUMPU automatically turns print PDFs into web optimized ePapers that Google loves.
24 Physiotherapy & Physical and Rehabilitation Medicine <strong>KCE</strong> reports 87<br />
3.2.2 Diagnostic or evaluation examination reports<br />
The PRM and physiotherapy nom<strong>en</strong>clatures include codes for examination reports<br />
under precise conditions. These diagnostic consultations are out of the scope of this<br />
report which addresses therapeutic interv<strong>en</strong>tions. The inclusion of these acts could<br />
distort the analysis, since they repres<strong>en</strong>t a considerable portion of the activity of PRM<br />
specialists. These services are detailed in App<strong>en</strong>dix 8 but are not included in the<br />
following chapters.<br />
3.2.3 Consumption of rehabilitation treatm<strong>en</strong>t<br />
The following chapters relate to the rehabilitation treatm<strong>en</strong>t. Rehabilitation within the<br />
framework of conv<strong>en</strong>tions that does not explicitly involve a physiotherapist is not tak<strong>en</strong><br />
into account. Registration with a medical health c<strong>en</strong>tre (first line practice with capitation<br />
paym<strong>en</strong>t) is not included either.<br />
3.2.3.1 Differ<strong>en</strong>t kinds of rehabilitation for the period 2003-2005<br />
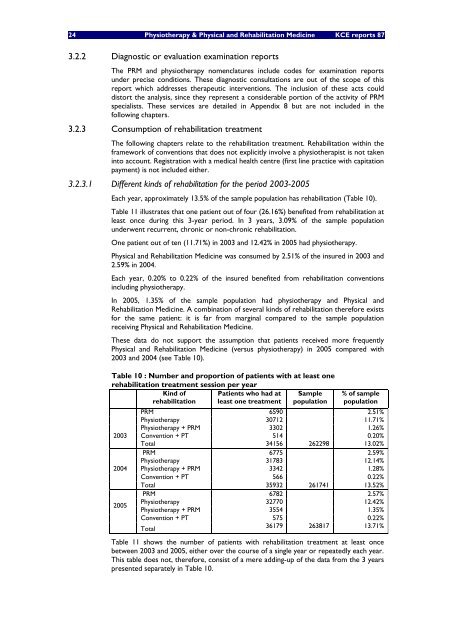
Each year, approximately 13.5% of the sample population has rehabilitation (Table 10).<br />
Table 11 illustrates that one pati<strong>en</strong>t out of four (26.16%) b<strong>en</strong>efited from rehabilitation at<br />
least once during this 3-year period. In 3 years, 3.09% of the sample population<br />
underw<strong>en</strong>t recurr<strong>en</strong>t, chronic or non-chronic rehabilitation.<br />
One pati<strong>en</strong>t out of t<strong>en</strong> (11.71%) in 2003 and 12.42% in 2005 had physiotherapy.<br />
Physical and Rehabilitation Medicine was consumed by 2.51% of the insured in 2003 and<br />
2.59% in 2004.<br />
Each year, 0.20% to 0.22% of the insured b<strong>en</strong>efited from rehabilitation conv<strong>en</strong>tions<br />
including physiotherapy.<br />
In 2005, 1.35% of the sample population had physiotherapy and Physical and<br />
Rehabilitation Medicine. A combination of several kinds of rehabilitation therefore exists<br />
for the same pati<strong>en</strong>t: it is far from marginal compared to the sample population<br />
receiving Physical and Rehabilitation Medicine.<br />
These data do not support the assumption that pati<strong>en</strong>ts received more frequ<strong>en</strong>tly<br />
Physical and Rehabilitation Medicine (versus physiotherapy) in 2005 compared with<br />
2003 and 2004 (see Table 10).<br />
Table 10 : Number and proportion of pati<strong>en</strong>ts with at least one<br />
rehabilitation treatm<strong>en</strong>t session per year<br />
Kind of Pati<strong>en</strong>ts who had at Sample % of sample<br />
rehabilitation least one treatm<strong>en</strong>t population population<br />
PRM 6590 2.51%<br />
Physiotherapy 30712 11.71%<br />
Physiotherapy + PRM 3302 1.26%<br />
2003 Conv<strong>en</strong>tion + PT 514 0.20%<br />
Total 34156 262298 13.02%<br />
PRM 6775 2.59%<br />
Physiotherapy 31783 12.14%<br />
2004 Physiotherapy + PRM 3342 1.28%<br />
Conv<strong>en</strong>tion + PT 566 0.22%<br />
Total 35932 261741 13.52%<br />
PRM 6782 2.57%<br />
2005<br />
Physiotherapy<br />
Physiotherapy + PRM<br />
32770<br />
3554<br />
12.42%<br />
1.35%<br />
Conv<strong>en</strong>tion + PT 575 0.22%<br />
Total<br />
36179 263817 13.71%<br />
Table 11 shows the number of pati<strong>en</strong>ts with rehabilitation treatm<strong>en</strong>t at least once<br />
betwe<strong>en</strong> 2003 and 2005, either over the course of a single year or repeatedly each year.<br />
This table does not, therefore, consist of a mere adding-up of the data from the 3 years<br />
pres<strong>en</strong>ted separately in Table 10.


