

Het gebruik van kinesitherapie en van fysische geneeskunde ... - KCE
Het gebruik van kinesitherapie en van fysische geneeskunde ... - KCE
Het gebruik van kinesitherapie en van fysische geneeskunde ... - KCE

Create successful ePaper yourself
Turn your PDF publications into a flip-book with our unique Google optimized e-Paper software.
26 Physiotherapy & Physical and Rehabilitation Medicine <strong>KCE</strong> reports 87<br />
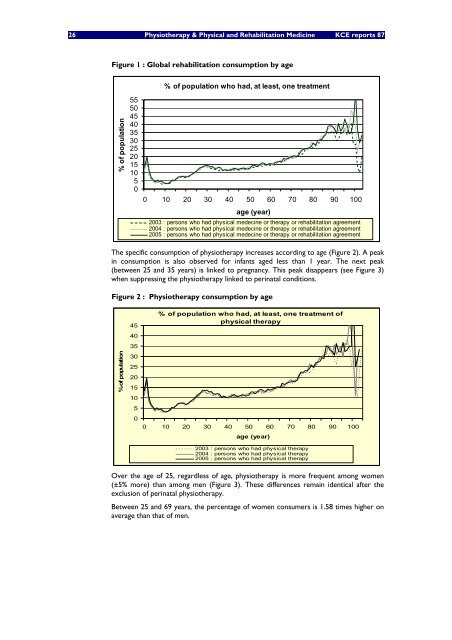
Figure 1 : Global rehabilitation consumption by age<br />
% of population<br />
55<br />
50<br />
45<br />
40<br />
35<br />
30<br />
25<br />
20<br />
15<br />
10<br />
5<br />
0<br />
% of population who had, at least, one treatm<strong>en</strong>t<br />
0 10 20 30 40 50 60 70 80 90 100<br />
age (year)<br />
2003 : persons who had physical medecine or therapy or rehabilitation agreem<strong>en</strong>t<br />
2004 : persons who had physical medecine or therapy or rehabilitation agreem<strong>en</strong>t<br />
2005 : persons who had physical medecine or therapy or rehabilitation agreem<strong>en</strong>t<br />
The specific consumption of physiotherapy increases according to age (Figure 2). A peak<br />
in consumption is also observed for infants aged less than 1 year. The next peak<br />
(betwe<strong>en</strong> 25 and 35 years) is linked to pregnancy. This peak disappears (see Figure 3)<br />
wh<strong>en</strong> suppressing the physiotherapy linked to perinatal conditions.<br />
Figure 2 : Physiotherapy consumption by age<br />
% of population<br />
45<br />
40<br />
35<br />
30<br />
25<br />
20<br />
15<br />
10<br />
5<br />
0<br />
% of population who had, at least, one treatm<strong>en</strong>t of<br />
physical therapy<br />
0 10 20 30 40 50 60 70 80 90 100<br />
age (year)<br />
2003 : persons who had physical therapy<br />
2004 : persons who had physical therapy<br />
2005 : persons who had physical therapy<br />
Over the age of 25, regardless of age, physiotherapy is more frequ<strong>en</strong>t among wom<strong>en</strong><br />
(±5% more) than among m<strong>en</strong> (Figure 3). These differ<strong>en</strong>ces remain id<strong>en</strong>tical after the<br />
exclusion of perinatal physiotherapy.<br />
Betwe<strong>en</strong> 25 and 69 years, the perc<strong>en</strong>tage of wom<strong>en</strong> consumers is 1.58 times higher on<br />
average than that of m<strong>en</strong>.


