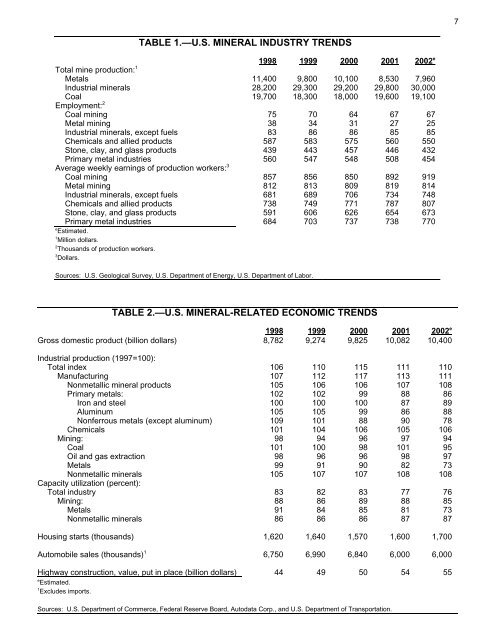
TABLE 1.—U.S. MINERAL INDUSTRY TRENDS 1998 1999 2000 2001 2002 e Total mine production: 1 Metals 11,400 9,800 10,100 8,530 7,960 Industrial minerals 28,200 29,300 29,200 29,800 30,000 Coal Employment: 19,700 18,300 18,000 19,600 19,100 2 Coal mining 75 70 64 67 67 Metal mining 38 34 31 27 25 Industrial minerals, except fuels 83 86 86 85 85 Chemicals and allied products 587 583 575 560 550 Stone, clay, and glass products 439 443 457 446 432 Primary metal industries Average weekly earnings of production workers: 560 547 548 508 454 3 Coal mining 857 856 850 892 919 Metal mining 812 813 809 819 814 Industrial minerals, except fuels 681 689 706 734 748 Chemicals and allied products 738 749 771 787 807 Stone, clay, and glass products 591 606 626 654 673 Primary metal industries e Estimated. 684 703 737 738 770 1 Million dollars. 2 Thousands of production workers. 3 Dollars. Sources: U.S. Geological Survey, U.S. Department of Energy, U.S. Department of Labor. TABLE 2.—U.S. MINERAL-RELATED ECONOMIC TRENDS 1998 1999 2000 2001 2002 e Gross domestic product (billion dollars) 8,782 9,274 9,825 10,082 10,400 Industrial production (1997=100): Total index 106 110 115 111 110 Manufacturing 107 112 117 113 111 Nonmetallic mineral products 105 106 106 107 108 Primary metals: 102 102 99 88 86 Iron and steel 100 100 100 87 89 Aluminum 105 105 99 86 88 Nonferrous metals (except aluminum) 109 101 88 90 78 Chemicals 101 104 106 105 106 Mining: 98 94 96 97 94 Coal 101 100 98 101 95 Oil and gas extraction 98 96 96 98 97 Metals 99 91 90 82 73 Nonmetallic minerals 105 107 107 108 108 Capacity utilization (percent): Total industry 83 82 83 77 76 Mining: 88 86 89 88 85 Metals 91 84 85 81 73 Nonmetallic minerals 86 86 86 87 87 Housing starts (thousands) 1,620 1,640 1,570 1,600 1,700 Automobile sales (thousands) 1 6,750 6,990 6,840 6,000 6,000 Highway construction, value, put in place (billion dollars) 44 49 50 54 55 e Estimated. 1 Excludes imports. Sources: U.S. Department of Commerce, Federal Reserve Board, Autodata Corp., and U.S. Department of Transportation. 7
8 TABLE 3.—VALUE OF NONFUEL MINERAL PRODUCTION IN THE UNITED STATES AND p 1 PRINCIPAL NONFUEL MINERALS PRODUCED IN 2002 Value Percent of U.S. State (thousands) Rank total Principal minerals, in order of value Alabama $968,000 16 2.55 Cement (portland), stone (crushed), lime, sand and gravel (construction), cement (masonry). Alaska 1,030,000 13 2.72 Zinc, gold, lead, silver, sand and gravel (construction). Arizona 1,920,000 5 5.05 Copper, sand and gravel (construction), cement (portland), molybdenum concentrates, stone (crushed). Arkansas 543,000 25 1.43 Bromine, stone (crushed), cement (portland), sand and gravel (construction), lime. California 3,440,000 1 9.07 Sand and gravel (construction), cement (portland), boron minerals, stone (crushed), gold. Colorado 619,000 23 1.63 Sand and gravel (construction), cement (portland), stone (crushed), molybdenum concentrates, gold. Connecticut 2 142,000 42 0.37 Stone (crushed), sand and gravel (construction), stone (dimension), clays (common), gemstones. Delaware 2 17,500 49 0.05 Sand and gravel (construction), magnesium compounds, gemstones. Florida 2,020,000 4 5.32 Phosphate rock, stone (crushed), cement (portland), sand and gravel (construction), cement (masonry). Georgia 1,450,000 7 3.82 Clays (kaolin), stone (crushed), clays (fuller's earth), cement (portland), sand and gravel (construction). Hawaii 75,300 45 0.20 Stone (crushed), sand and gravel (construction), gemstones. Idaho 307,000 35 0.81 Phosphate rock, sand and gravel (construction), silver, molybdenum concentrates, stone (crushed). Illinois 950,000 17 2.50 Stone (crushed), cement (portland), sand and gravel (construction), sand and gravel (industrial), lime. Indiana 740,000 18 1.95 Stone (crushed), cement (portland), sand and gravel (construction), cement (masonry), lime. Iowa 487,000 26 1.28 Stone (crushed), cement (portland), sand and gravel (construction), gypsum (crude), lime. Kansas 661,000 21 1.74 Cement (portland), helium (Grade-A), salt, stone (crushed), helium (crude). Kentucky 2 372,000 32 0.98 Stone (crushed), lime, cement (portland), sand and gravel (construction), clays (ball). Louisiana 294,000 36 0.77 Salt, sand and gravel (construction), stone (crushed), sand and gravel (industrial), lime. Maine 106,000 43 0.28 Sand and gravel (construction), cement (portland), stone (crushed), stone (dimension), cement (masonry). Maryland 2 375,000 31 0.99 Stone (crushed), cement (portland), sand and gravel (construction), cement (masonry), stone (dimension). Massachusetts 2 235,000 38 0.62 Stone (crushed), sand and gravel (construction), lime, stone (dimension), clays (common). Michigan 1,580,000 6 4.16 Cement (portland), iron ore (usable), sand and gravel (construction), stone (crushed), magnesium compounds. Minnesota 2 1,090,000 11 2.86 Iron ore (usable), sand and gravel (construction), stone (crushed), sand and gravel (industrial), stone (dimension). Mississippi 176,000 40 0.46 Sand and gravel (construction), clays (fuller's earth), cement (portland), stone (crushed), clays (bentonite). Missouri 1,290,000 8 3.39 Stone (crushed), cement (portland), lead, lime, sand and gravel (construction). Montana 442,000 30 1.16 Palladium metal, sand and gravel (construction), platinum metal, cement (portland), gold. Nebraska 2 88,600 44 0.23 Cement (portland), stone (crushed), sand and gravel (construction), lime, cement (masonry). Nevada 2,900,000 2 7.63 Gold, sand and gravel (construction), lime, silver, diatomite. New Hampshire 2 68,000 47 0.18 Sand and gravel (construction), stone (crushed), stone (dimension), gemstones. New Jersey 2 285,000 37 0.75 Stone (crushed), sand and gravel (construction), sand and gravel (industrial), greensand marl, peat. See footnotes at end of table.
- Page 1 and 2: U.S. Department of the Interior U.S
- Page 3 and 4: U.S. DEPARTMENT OF THE INTERIOR GAL
- Page 5 and 6: 2 INSTANT INFORMATION Information a
- Page 7 and 8: NET EXPORTS OF MINERAL RAW MATERIAL
- Page 9: 6 SIGNIFICANT EVENTS, TRENDS, AND I
- Page 13 and 14: 10 in some cases, were ascribable t
- Page 15 and 16: 12 situation similar to that of Jap
- Page 17 and 18: 14 TABLE 6.—WORLD ZINC MINE PRODU
- Page 19 and 20: MAJOR BASE AND SPECIALTY METAL PROD
- Page 21 and 22: Gar Salt Peat Gyp Peat Gyp S Gyp Wo
- Page 23 and 24: 20 ABRASIVES (MANUFACTURED) (Fused
- Page 25 and 26: 22 ALUMINUM 1 (Data in thousand met
- Page 27 and 28: 24 ANTIMONY (Data in metric tons of
- Page 29 and 30: 26 ARSENIC 1 (Data in metric tons o
- Page 31 and 32: 28 ASBESTOS (Data in thousand metri
- Page 33 and 34: 30 BARITE (Data in thousand metric
- Page 35 and 36: 32 BAUXITE AND ALUMINA 1 (Data in t
- Page 37 and 38: 34 BERYLLIUM (Data in metric tons o
- Page 39 and 40: 36 BISMUTH (Data in metric tons of
- Page 41 and 42: 38 BORON (Data in thousand metric t
- Page 43 and 44: 40 BROMINE (Data in thousand metric
- Page 45 and 46: 42 CADMIUM (Data in metric tons of
- Page 47 and 48: 44 CEMENT (Data in thousand metric
- Page 49 and 50: 46 CESIUM 1 (Data in kilograms of c
- Page 51 and 52: 48 CHROMIUM (Data in thousand metri
- Page 53 and 54: 50 CLAYS (Data in thousand metric t
- Page 55 and 56: 52 COBALT (Data in metric tons of c
- Page 57 and 58: 54 COLUMBIUM (NIOBIUM) (Data in met
- Page 59 and 60: 56 COPPER (Data in thousand metric
- Page 61 and 62:
58 DIAMOND (INDUSTRIAL) (Data in mi
- Page 63 and 64:
60 DIATOMITE (Data in thousand metr
- Page 65 and 66:
62 FELDSPAR (Data in thousand metri
- Page 67 and 68:
64 FLUORSPAR (Data in thousand metr
- Page 69 and 70:
66 GALLIUM (Data in kilograms of ga
- Page 71 and 72:
68 GARNET (INDUSTRIAL) 1 (Data in m
- Page 73 and 74:
70 GEMSTONES 1 (Data in million dol
- Page 75 and 76:
72 GERMANIUM 1 (Data in kilograms o
- Page 77 and 78:
74 GOLD (Data in metric tons 1 of g
- Page 79 and 80:
76 GRAPHITE (NATURAL) (Data in thou
- Page 81 and 82:
78 GYPSUM (Data in thousand metric
- Page 83 and 84:
80 HELIUM (Data in million cubic me
- Page 85 and 86:
82 INDIUM 1 (Data in metric tons, u
- Page 87 and 88:
84 IODINE (Data in thousand kilogra
- Page 89 and 90:
86 IRON ORE 1 (Data in million metr
- Page 91 and 92:
88 IRON AND STEEL 1 (Data in millio
- Page 93 and 94:
90 IRON AND STEEL SCRAP 1 (Data in
- Page 95 and 96:
92 IRON AND STEEL SLAG (Data in tho
- Page 97 and 98:
94 KYANITE AND RELATED MINERALS (Da
- Page 99 and 100:
96 LEAD (Data in thousand metric to
- Page 101 and 102:
98 LIME 1 (Data in thousand metric
- Page 103 and 104:
100 LITHIUM (Data in metric tons of
- Page 105 and 106:
102 MAGNESIUM COMPOUNDS 1 (Data in
- Page 107 and 108:
104 MAGNESIUM METAL 1 (Data in thou
- Page 109 and 110:
106 MANGANESE (Data in thousand met
- Page 111 and 112:
108 MERCURY 1 (Data in metric tons
- Page 113 and 114:
110 MICA (NATURAL), SCRAP AND FLAKE
- Page 115 and 116:
112 MICA (NATURAL), SHEET 1 (Data i
- Page 117 and 118:
114 MOLYBDENUM (Data in metric tons
- Page 119 and 120:
116 NICKEL (Data in metric tons of
- Page 121 and 122:
118 NITROGEN (FIXED)—AMMONIA (Dat
- Page 123 and 124:
120 PEAT (Data in thousand metric t
- Page 125 and 126:
122 PERLITE (Data in thousand metri
- Page 127 and 128:
124 PHOSPHATE ROCK (Data in thousan
- Page 129 and 130:
126 PLATINUM-GROUP METALS (Platinum
- Page 131 and 132:
128 POTASH (Data in thousand metric
- Page 133 and 134:
130 PUMICE AND PUMICITE (Data in th
- Page 135 and 136:
132 QUARTZ CRYSTAL (INDUSTRIAL) (Da
- Page 137 and 138:
134 RARE EARTHS 1 (Data in metric t
- Page 139 and 140:
136 RHENIUM (Data in kilograms of r
- Page 141 and 142:
138 RUBIDIUM 1 (Data in kilograms o
- Page 143 and 144:
140 SALT (Data in thousand metric t
- Page 145 and 146:
142 SAND AND GRAVEL (CONSTRUCTION)
- Page 147 and 148:
144 SAND AND GRAVEL (INDUSTRIAL) (D
- Page 149 and 150:
146 SCANDIUM 1 (Data in kilograms o
- Page 151 and 152:
148 SELENIUM 1 (Data in metric tons
- Page 153 and 154:
150 SILICON (Data in thousand metri
- Page 155 and 156:
152 SILVER (Data in metric tons 1 o
- Page 157 and 158:
154 SODA ASH (Data in thousand metr
- Page 159 and 160:
156 SODIUM SULFATE (Data in thousan
- Page 161 and 162:
158 STONE (CRUSHED) 1 (Data in mill
- Page 163 and 164:
160 STONE (DIMENSION) 1 (Data in th
- Page 165 and 166:
162 STRONTIUM (Data in metric tons
- Page 167 and 168:
164 SULFUR (Data in thousand metric
- Page 169 and 170:
166 TALC AND PYROPHYLLITE (Data in
- Page 171 and 172:
168 TANTALUM (Data in metric tons o
- Page 173 and 174:
170 TELLURIUM 1 (Data in metric ton
- Page 175 and 176:
172 THALLIUM (Data in kilograms of
- Page 177 and 178:
174 THORIUM (Data in metric tons of
- Page 179 and 180:
176 TIN (Data in metric tons of tin
- Page 181 and 182:
178 TITANIUM MINERAL CONCENTRATES 1
- Page 183 and 184:
180 TITANIUM AND TITANIUM DIOXIDE 1
- Page 185 and 186:
182 TUNGSTEN (Data in metric tons o
- Page 187 and 188:
184 VANADIUM 1 (Data in metric tons
- Page 189 and 190:
186 VERMICULITE (Data in thousand m
- Page 191 and 192:
188 YTTRIUM 1 (Data in metric tons
- Page 193 and 194:
190 ZINC (Data in thousand metric t
- Page 195 and 196:
192 ZIRCONIUM AND HAFNIUM (Data in
- Page 197 and 198:
194 APPENDIX A Abbreviations and Un
- Page 199 and 200:
196 (marginal reserves), and some o
- Page 201 and 202:
198 APPENDIX D Country Specialists