

Mineral Commodity Summaries 2003 - Mineral Resources Program ...
Mineral Commodity Summaries 2003 - Mineral Resources Program ...
Mineral Commodity Summaries 2003 - Mineral Resources Program ...

Create successful ePaper yourself
Turn your PDF publications into a flip-book with our unique Google optimized e-Paper software.
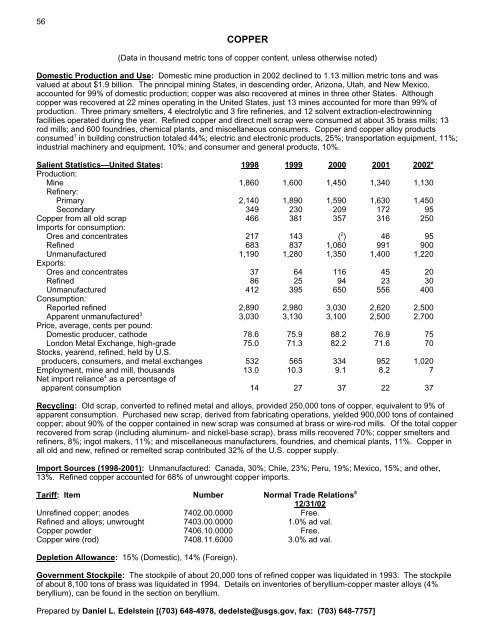
56<br />
COPPER<br />
(Data in thousand metric tons of copper content, unless otherwise noted)<br />
Domestic Production and Use: Domestic mine production in 2002 declined to 1.13 million metric tons and was<br />
valued at about $1.9 billion. The principal mining States, in descending order, Arizona, Utah, and New Mexico,<br />
accounted for 99% of domestic production; copper was also recovered at mines in three other States. Although<br />
copper was recovered at 22 mines operating in the United States, just 13 mines accounted for more than 99% of<br />
production. Three primary smelters, 4 electrolytic and 3 fire refineries, and 12 solvent extraction-electrowinning<br />
facilities operated during the year. Refined copper and direct melt scrap were consumed at about 35 brass mills; 13<br />
rod mills; and 600 foundries, chemical plants, and miscellaneous consumers. Copper and copper alloy products<br />
consumed 1 in building construction totaled 44%; electric and electronic products, 25%; transportation equipment, 11%;<br />
industrial machinery and equipment, 10%; and consumer and general products, 10%.<br />
Salient Statistics—United States: 1998 1999 2000 2001 2002 e<br />
Production:<br />
Mine<br />
Refinery:<br />
1,860 1,600 1,450 1,340 1,130<br />
Primary 2,140 1,890 1,590 1,630 1,450<br />
Secondary 349 230 209 172 95<br />
Copper from all old scrap<br />
Imports for consumption:<br />
466 381 357 316 250<br />
Ores and concentrates 217 143 ( 2 ) 46 95<br />
Refined 683 837 1,060 991 900<br />
Unmanufactured<br />
Exports:<br />
1,190 1,280 1,350 1,400 1,220<br />
Ores and concentrates 37 64 116 45 20<br />
Refined 86 25 94 23 30<br />
Unmanufactured<br />
Consumption:<br />
412 395 650 556 400<br />
Reported refined 2,890 2,980 3,030 2,620 2,500<br />
Apparent unmanufactured 3<br />
3,030 3,130 3,100 2,500 2,700<br />
Price, average, cents per pound:<br />
Domestic producer, cathode 78.6 75.9 88.2 76.9 75<br />
London Metal Exchange, high-grade 75.0 71.3 82.2 71.6 70<br />
Stocks, yearend, refined, held by U.S.<br />
producers, consumers, and metal exchanges 532 565 334 952 1,020<br />
Employment, mine and mill, thousands 13.0 10.3 9.1 8.2 7<br />
Net import reliance 4 as a percentage of<br />
apparent consumption 14 27 37 22 37<br />
Recycling: Old scrap, converted to refined metal and alloys, provided 250,000 tons of copper, equivalent to 9% of<br />
apparent consumption. Purchased new scrap, derived from fabricating operations, yielded 900,000 tons of contained<br />
copper; about 90% of the copper contained in new scrap was consumed at brass or wire-rod mills. Of the total copper<br />
recovered from scrap (including aluminum- and nickel-base scrap), brass mills recovered 70%; copper smelters and<br />
refiners, 8%; ingot makers, 11%; and miscellaneous manufacturers, foundries, and chemical plants, 11%. Copper in<br />
all old and new, refined or remelted scrap contributed 32% of the U.S. copper supply.<br />
Import Sources (1998-2001): Unmanufactured: Canada, 30%; Chile, 23%; Peru, 19%; Mexico, 15%; and other,<br />
13%. Refined copper accounted for 68% of unwrought copper imports.<br />
Tariff: Item Number Normal Trade Relations 5<br />
12/31/02<br />
Unrefined copper; anodes 7402.00.0000 Free.<br />
Refined and alloys; unwrought 7403.00.0000 1.0% ad val.<br />
Copper powder 7406.10.0000 Free.<br />
Copper wire (rod) 7408.11.6000 3.0% ad val.<br />
Depletion Allowance: 15% (Domestic), 14% (Foreign).<br />
Government Stockpile: The stockpile of about 20,000 tons of refined copper was liquidated in 1993. The stockpile<br />
of about 8,100 tons of brass was liquidated in 1994. Details on inventories of beryllium-copper master alloys (4%<br />
beryllium), can be found in the section on beryllium.<br />
Prepared by Daniel L. Edelstein [(703) 648-4978, dedelste@usgs.gov, fax: (703) 648-7757]


