

Mineral Commodity Summaries 2003 - Mineral Resources Program ...
Mineral Commodity Summaries 2003 - Mineral Resources Program ...
Mineral Commodity Summaries 2003 - Mineral Resources Program ...

You also want an ePaper? Increase the reach of your titles
YUMPU automatically turns print PDFs into web optimized ePapers that Google loves.
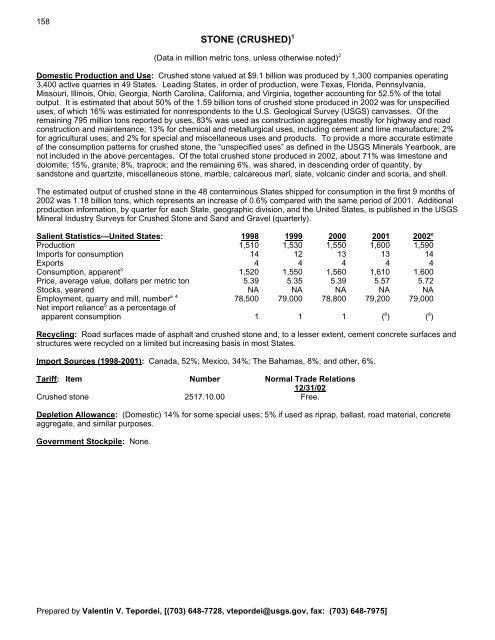
158<br />
STONE (CRUSHED) 1<br />
(Data in million metric tons, unless otherwise noted) 2<br />
Domestic Production and Use: Crushed stone valued at $9.1 billion was produced by 1,300 companies operating<br />
3,400 active quarries in 49 States. Leading States, in order of production, were Texas, Florida, Pennsylvania,<br />
Missouri, Illinois, Ohio, Georgia, North Carolina, California, and Virginia, together accounting for 52.5% of the total<br />
output. It is estimated that about 50% of the 1.59 billion tons of crushed stone produced in 2002 was for unspecified<br />
uses, of which 16% was estimated for nonrespondents to the U.S. Geological Survey (USGS) canvasses. Of the<br />
remaining 795 million tons reported by uses, 83% was used as construction aggregates mostly for highway and road<br />
construction and maintenance; 13% for chemical and metallurgical uses, including cement and lime manufacture; 2%<br />
for agricultural uses; and 2% for special and miscellaneous uses and products. To provide a more accurate estimate<br />
of the consumption patterns for crushed stone, the “unspecified uses” as defined in the USGS <strong>Mineral</strong>s Yearbook, are<br />
not included in the above percentages. Of the total crushed stone produced in 2002, about 71% was limestone and<br />
dolomite; 15%, granite; 8%, traprock; and the remaining 6%, was shared, in descending order of quantity, by<br />
sandstone and quartzite, miscellaneous stone, marble, calcareous marl, slate, volcanic cinder and scoria, and shell.<br />
The estimated output of crushed stone in the 48 conterminous States shipped for consumption in the first 9 months of<br />
2002 was 1.18 billion tons, which represents an increase of 0.6% compared with the same period of 2001. Additional<br />
production information, by quarter for each State, geographic division, and the United States, is published in the USGS<br />
<strong>Mineral</strong> Industry Surveys for Crushed Stone and Sand and Gravel (quarterly).<br />
Salient Statistics—United States: 1998 1999 2000 2001 2002 e<br />
Production 1,510 1,530 1,550 1,600 1,590<br />
Imports for consumption 14 12 13 13 14<br />
Exports 4 4 4 4 4<br />
Consumption, apparent 3<br />
1,520 1,550 1,560 1,610 1,600<br />
Price, average value, dollars per metric ton 5.39 5.35 5.39 5.57 5.72<br />
Stocks, yearend NA NA NA NA NA<br />
Employment, quarry and mill, number<br />
e 4<br />
78,500 79,000 78,800 79,200 79,000<br />
Net import reliance 5 as a percentage of<br />
apparent consumption 1 1 1 ( 6 ) ( 6 )<br />
Recycling: Road surfaces made of asphalt and crushed stone and, to a lesser extent, cement concrete surfaces and<br />
structures were recycled on a limited but increasing basis in most States.<br />
Import Sources (1998-2001): Canada, 52%; Mexico, 34%; The Bahamas, 8%; and other, 6%.<br />
Tariff: Item Number Normal Trade Relations<br />
12/31/02<br />
Crushed stone 2517.10.00 Free.<br />
Depletion Allowance: (Domestic) 14% for some special uses; 5% if used as riprap, ballast, road material, concrete<br />
aggregate, and similar purposes.<br />
Government Stockpile: None.<br />
Prepared by Valentin V. Tepordei, [(703) 648-7728, vtepordei@usgs.gov, fax: (703) 648-7975]


