

Mineral Commodity Summaries 2003 - Mineral Resources Program ...
Mineral Commodity Summaries 2003 - Mineral Resources Program ...
Mineral Commodity Summaries 2003 - Mineral Resources Program ...

Create successful ePaper yourself
Turn your PDF publications into a flip-book with our unique Google optimized e-Paper software.
GOLD<br />
During the first 9 months of 2002, the Englehard Corporation’s daily price of gold ranged from a low of about $279 per<br />
troy ounce in January to a high of almost $331 in June. For most of the year, this price range was above $300. After<br />
terrorists attacked the United States in September 2001, the traditional role of gold as a store of value was able to lift<br />
the price of gold out of its low trading range. In 2002, the Swiss National Bank continued selling 1,300 tons of gold<br />
(one-half its reserves). Concerns about terrorism, war in the Middle East, and weaknesses in the U.S. dollar,<br />
prompted increases in gold prices, which averaged over $300 during the year.<br />
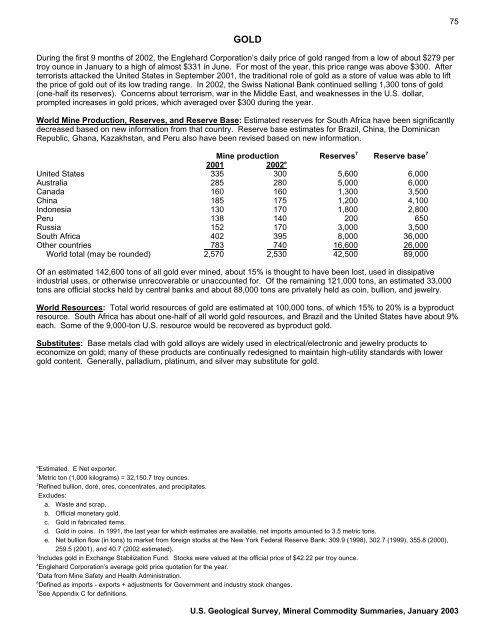
World Mine Production, Reserves, and Reserve Base: Estimated reserves for South Africa have been significantly<br />
decreased based on new information from that country. Reserve base estimates for Brazil, China, the Dominican<br />
Republic, Ghana, Kazakhstan, and Peru also have been revised based on new information.<br />
Mine production Reserves 7<br />
Reserve base 7<br />
2001 2002 e<br />
United States 335 300 5,600 6,000<br />
Australia 285 280 5,000 6,000<br />
Canada 160 160 1,300 3,500<br />
China 185 175 1,200 4,100<br />
Indonesia 130 170 1,800 2,800<br />
Peru 138 140 200 650<br />
Russia 152 170 3,000 3,500<br />
South Africa 402 395 8,000 36,000<br />
Other countries 783 740 16,600 26,000<br />
World total (may be rounded) 2,570 2,530 42,500 89,000<br />
Of an estimated 142,600 tons of all gold ever mined, about 15% is thought to have been lost, used in dissipative<br />
industrial uses, or otherwise unrecoverable or unaccounted for. Of the remaining 121,000 tons, an estimated 33,000<br />
tons are official stocks held by central banks and about 88,000 tons are privately held as coin, bullion, and jewelry.<br />
World <strong>Resources</strong>: Total world resources of gold are estimated at 100,000 tons, of which 15% to 20% is a byproduct<br />
resource. South Africa has about one-half of all world gold resources, and Brazil and the United States have about 9%<br />
each. Some of the 9,000-ton U.S. resource would be recovered as byproduct gold.<br />
Substitutes: Base metals clad with gold alloys are widely used in electrical/electronic and jewelry products to<br />
economize on gold; many of these products are continually redesigned to maintain high-utility standards with lower<br />
gold content. Generally, palladium, platinum, and silver may substitute for gold.<br />
e<br />
Estimated. E Net exporter.<br />
1<br />
Metric ton (1,000 kilograms) = 32,150.7 troy ounces.<br />
2<br />
Refined bullion, doré, ores, concentrates, and precipitates.<br />
Excludes:<br />
a. Waste and scrap.<br />
b. Official monetary gold.<br />
c. Gold in fabricated items.<br />
d. Gold in coins. In 1991, the last year for which estimates are available, net imports amounted to 3.5 metric tons.<br />
e. Net bullion flow (in tons) to market from foreign stocks at the New York Federal Reserve Bank: 309.9 (1998), 302.7 (1999), 355.8 (2000),<br />
259.5 (2001), and 40.7 (2002 estimated).<br />
3<br />
Includes gold in Exchange Stabilization Fund. Stocks were valued at the official price of $42.22 per troy ounce.<br />
4<br />
Englehard Corporation’s average gold price quotation for the year.<br />
5<br />
Data from Mine Safety and Health Administration.<br />
6<br />
Defined as imports - exports + adjustments for Government and industry stock changes.<br />
7 See Appendix C for definitions.<br />
U.S. Geological Survey, <strong>Mineral</strong> <strong>Commodity</strong> <strong>Summaries</strong>, January <strong>2003</strong><br />
75


