

Mineral Commodity Summaries 2003 - Mineral Resources Program ...
Mineral Commodity Summaries 2003 - Mineral Resources Program ...
Mineral Commodity Summaries 2003 - Mineral Resources Program ...

You also want an ePaper? Increase the reach of your titles
YUMPU automatically turns print PDFs into web optimized ePapers that Google loves.
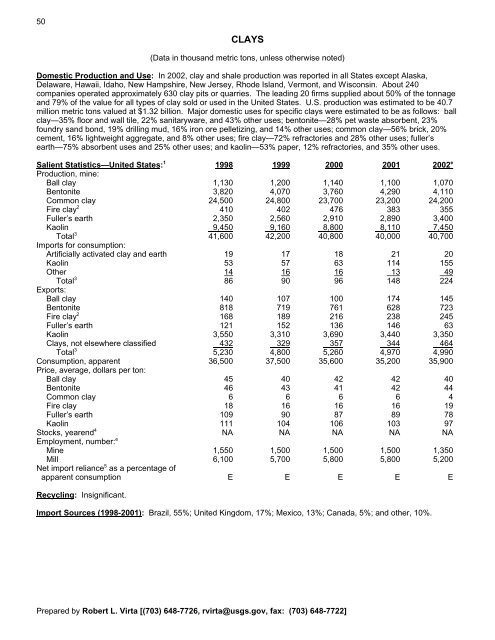
50<br />
CLAYS<br />
(Data in thousand metric tons, unless otherwise noted)<br />
Domestic Production and Use: In 2002, clay and shale production was reported in all States except Alaska,<br />
Delaware, Hawaii, Idaho, New Hampshire, New Jersey, Rhode Island, Vermont, and Wisconsin. About 240<br />
companies operated approximately 630 clay pits or quarries. The leading 20 firms supplied about 50% of the tonnage<br />
and 79% of the value for all types of clay sold or used in the United States. U.S. production was estimated to be 40.7<br />
million metric tons valued at $1.32 billion. Major domestic uses for specific clays were estimated to be as follows: ball<br />
clay—35% floor and wall tile, 22% sanitaryware, and 43% other uses; bentonite—28% pet waste absorbent, 23%<br />
foundry sand bond, 19% drilling mud, 16% iron ore pelletizing, and 14% other uses; common clay—56% brick, 20%<br />
cement, 16% lightweight aggregate, and 8% other uses; fire clay—72% refractories and 28% other uses; fuller’s<br />
earth—75% absorbent uses and 25% other uses; and kaolin—53% paper, 12% refractories, and 35% other uses.<br />
Salient Statistics—United States: 1<br />
1998 1999 2000 2001 2002 e<br />
Production, mine:<br />
Ball clay 1,130 1,200 1,140 1,100 1,070<br />
Bentonite 3,820 4,070 3,760 4,290 4,110<br />
Common clay 24,500 24,800 23,700 23,200 24,200<br />
Fire clay 2<br />
410 402 476 383 355<br />
Fuller’s earth 2,350 2,560 2,910 2,890 3,400<br />
Kaolin 9,450 9,160 8,800 8,110 7,450<br />
Total 3<br />
Imports for consumption:<br />
41,600 42,200 40,800 40,000 40,700<br />
Artificially activated clay and earth 19 17 18 21 20<br />
Kaolin 53 57 63 114 155<br />
Other 14 16 16 13 49<br />
Total 3<br />
Exports:<br />
86 90 96 148 224<br />
Ball clay 140 107 100 174 145<br />
Bentonite 818 719 761 628 723<br />
Fire clay 2<br />
168 189 216 238 245<br />
Fuller’s earth 121 152 136 146 63<br />
Kaolin 3,550 3,310 3,690 3,440 3,350<br />
Clays, not elsewhere classified 432 329 357 344 464<br />
Total 3<br />
5,230 4,800 5,260 4,970 4,990<br />
Consumption, apparent<br />
Price, average, dollars per ton:<br />
36,500 37,500 35,600 35,200 35,900<br />
Ball clay 45 40 42 42 40<br />
Bentonite 46 43 41 42 44<br />
Common clay 6 6 6 6 4<br />
Fire clay 18 16 16 16 19<br />
Fuller’s earth 109 90 87 89 78<br />
Kaolin 111 104 106 103 97<br />
Stocks, yearend 4<br />
Employment, number:<br />
NA NA NA NA NA<br />
e<br />
Mine 1,550 1,500 1,500 1,500 1,350<br />
Mill<br />
Net import reliance<br />
6,100 5,700 5,800 5,800 5,200<br />
5 as a percentage of<br />
apparent consumption E E E E E<br />
Recycling: Insignificant.<br />
Import Sources (1998-2001): Brazil, 55%; United Kingdom, 17%; Mexico, 13%; Canada, 5%; and other, 10%.<br />
Prepared by Robert L. Virta [(703) 648-7726, rvirta@usgs.gov, fax: (703) 648-7722]


