Mineral Commodity Summaries 2003 - Mineral Resources Program ...
Mineral Commodity Summaries 2003 - Mineral Resources Program ...
Mineral Commodity Summaries 2003 - Mineral Resources Program ...
Create successful ePaper yourself
Turn your PDF publications into a flip-book with our unique Google optimized e-Paper software.
74<br />
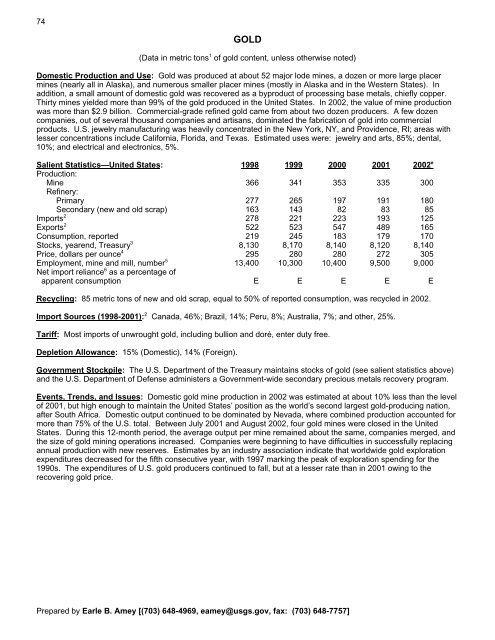
GOLD<br />
(Data in metric tons 1 of gold content, unless otherwise noted)<br />
Domestic Production and Use: Gold was produced at about 52 major lode mines, a dozen or more large placer<br />
mines (nearly all in Alaska), and numerous smaller placer mines (mostly in Alaska and in the Western States). In<br />
addition, a small amount of domestic gold was recovered as a byproduct of processing base metals, chiefly copper.<br />
Thirty mines yielded more than 99% of the gold produced in the United States. In 2002, the value of mine production<br />
was more than $2.9 billion. Commercial-grade refined gold came from about two dozen producers. A few dozen<br />
companies, out of several thousand companies and artisans, dominated the fabrication of gold into commercial<br />
products. U.S. jewelry manufacturing was heavily concentrated in the New York, NY, and Providence, RI; areas with<br />
lesser concentrations include California, Florida, and Texas. Estimated uses were: jewelry and arts, 85%; dental,<br />
10%; and electrical and electronics, 5%.<br />
Salient Statistics—United States: 1998 1999 2000 2001 2002 e<br />
Production:<br />
Mine<br />
Refinery:<br />
366 341 353 335 300<br />
Primary 277 265 197 191 180<br />
Secondary (new and old scrap) 163 143 82 83 85<br />
Imports 2<br />
278 221 223 193 125<br />
Exports 2<br />
522 523 547 489 165<br />
Consumption, reported 219 245 183 179 170<br />
Stocks, yearend, Treasury 3<br />
8,130 8,170 8,140 8,120 8,140<br />
Price, dollars per ounce 4<br />
295 280 280 272 305<br />
Employment, mine and mill, number 5<br />
13,400 10,300 10,400 9,500 9,000<br />
Net import reliance 6 as a percentage of<br />
apparent consumption E E E E E<br />
Recycling: 85 metric tons of new and old scrap, equal to 50% of reported consumption, was recycled in 2002.<br />
Import Sources (1998-2001): 2 Canada, 46%; Brazil, 14%; Peru, 8%; Australia, 7%; and other, 25%.<br />
Tariff: Most imports of unwrought gold, including bullion and doré, enter duty free.<br />
Depletion Allowance: 15% (Domestic), 14% (Foreign).<br />
Government Stockpile: The U.S. Department of the Treasury maintains stocks of gold (see salient statistics above)<br />
and the U.S. Department of Defense administers a Government-wide secondary precious metals recovery program.<br />
Events, Trends, and Issues: Domestic gold mine production in 2002 was estimated at about 10% less than the level<br />
of 2001, but high enough to maintain the United States’ position as the world’s second largest gold-producing nation,<br />
after South Africa. Domestic output continued to be dominated by Nevada, where combined production accounted for<br />
more than 75% of the U.S. total. Between July 2001 and August 2002, four gold mines were closed in the United<br />
States. During this 12-month period, the average output per mine remained about the same, companies merged, and<br />
the size of gold mining operations increased. Companies were beginning to have difficulties in successfully replacing<br />
annual production with new reserves. Estimates by an industry association indicate that worldwide gold exploration<br />
expenditures decreased for the fifth consecutive year, with 1997 marking the peak of exploration spending for the<br />
1990s. The expenditures of U.S. gold producers continued to fall, but at a lesser rate than in 2001 owing to the<br />
recovering gold price.<br />
Prepared by Earle B. Amey [(703) 648-4969, eamey@usgs.gov, fax: (703) 648-7757]


