

Mineral Commodity Summaries 2003 - Mineral Resources Program ...
Mineral Commodity Summaries 2003 - Mineral Resources Program ...
Mineral Commodity Summaries 2003 - Mineral Resources Program ...

Create successful ePaper yourself
Turn your PDF publications into a flip-book with our unique Google optimized e-Paper software.
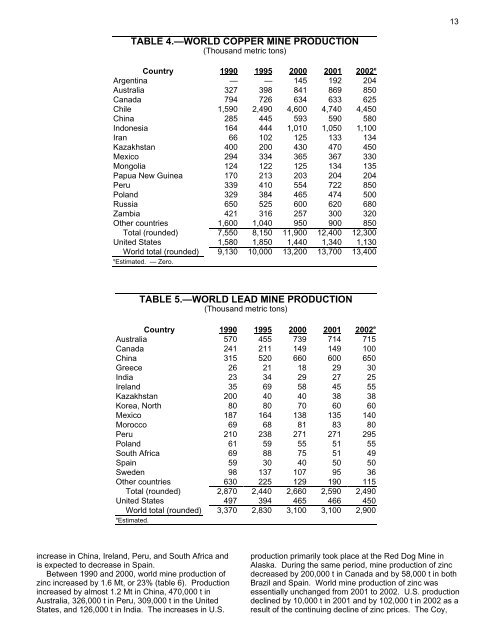
TABLE 4.—WORLD COPPER MINE PRODUCTION<br />
(Thousand metric tons)<br />
Country 1990 1995 2000 2001 2002 e<br />
Argentina — — 145 192 204<br />
Australia 327 398 841 869 850<br />
Canada 794 726 634 633 625<br />
Chile 1,590 2,490 4,600 4,740 4,450<br />
China 285 445 593 590 580<br />
Indonesia 164 444 1,010 1,050 1,100<br />
Iran 66 102 125 133 134<br />
Kazakhstan 400 200 430 470 450<br />
Mexico 294 334 365 367 330<br />
Mongolia 124 122 125 134 135<br />
Papua New Guinea 170 213 203 204 204<br />
Peru 339 410 554 722 850<br />
Poland 329 384 465 474 500<br />
Russia 650 525 600 620 680<br />
Zambia 421 316 257 300 320<br />
Other countries 1,600 1,040 950 900 850<br />
Total (rounded) 7,550 8,150 11,900 12,400 12,300<br />
United States 1,580 1,850 1,440 1,340 1,130<br />
World total (rounded) 9,130 10,000 13,200 13,700 13,400<br />
e Estimated. — Zero.<br />
TABLE 5.—WORLD LEAD MINE PRODUCTION<br />
(Thousand metric tons)<br />
Country 1990 1995 2000 2001 2002 e<br />
Australia 570 455 739 714 715<br />
Canada 241 211 149 149 100<br />
China 315 520 660 600 650<br />
Greece 26 21 18 29 30<br />
India 23 34 29 27 25<br />
Ireland 35 69 58 45 55<br />
Kazakhstan 200 40 40 38 38<br />
Korea, North 80 80 70 60 60<br />
Mexico 187 164 138 135 140<br />
Morocco 69 68 81 83 80<br />
Peru 210 238 271 271 295<br />
Poland 61 59 55 51 55<br />
South Africa 69 88 75 51 49<br />
Spain 59 30 40 50 50<br />
Sweden 98 137 107 95 36<br />
Other countries 630 225 129 190 115<br />
Total (rounded) 2,870 2,440 2,660 2,590 2,490<br />
United States 497 394 465 466 450<br />
World total (rounded) 3,370 2,830 3,100 3,100 2,900<br />
e Estimated.<br />
increase in China, Ireland, Peru, and South Africa and<br />
is expected to decrease in Spain.<br />
Between 1990 and 2000, world mine production of<br />
zinc increased by 1.6 Mt, or 23% (table 6). Production<br />
increased by almost 1.2 Mt in China, 470,000 t in<br />
Australia, 326,000 t in Peru, 309,000 t in the United<br />
States, and 126,000 t in India. The increases in U.S.<br />
13<br />
production primarily took place at the Red Dog Mine in<br />
Alaska. During the same period, mine production of zinc<br />
decreased by 200,000 t in Canada and by 58,000 t in both<br />
Brazil and Spain. World mine production of zinc was<br />
essentially unchanged from 2001 to 2002. U.S. production<br />
declined by 10,000 t in 2001 and by 102,000 t in 2002 as a<br />
result of the continuing decline of zinc prices. The Coy,


