- Page 1 and 2:
Final Report Simulation and Analysi
- Page 3 and 4:
Executive Summary of Report • Fou
- Page 5 and 6:
magnitude. Loose soil surfaces with
- Page 7 and 8:
Table of Contents v Page 2.8.5. Fet
- Page 9 and 10:
List of Tables Table Page 1. GPS lo
- Page 11 and 12:
List of Figures Figure Page 12. TSI
- Page 13 and 14:
List of Figures Figure Page 35. The
- Page 15 and 16:
List of Figures Figure Page 52. The
- Page 17 and 18:
List of Figures Figure Page 67. The
- Page 19 and 20:
List of Figures Figure Page 81. Con
- Page 21 and 22:
1. Introduction 1.1. Background The
- Page 23 and 24:
a) b) d) Figure 1. Owens Lake histo
- Page 25 and 26:
1.2. Project Objectives and Applica
- Page 27 and 28:
Section 2. Experimental Techniques
- Page 29 and 30:
valley surface winds; and in the su
- Page 31 and 32:
a) b) Radiative Arctic/Pacific Air
- Page 33 and 34:
Figure 6. The process of formation
- Page 35 and 36:
soil in these locations appeared qu
- Page 37 and 38:
Lone Pine “North Sheet Simulation
- Page 39 and 40:
2.3. Soil Properties Properties of
- Page 41 and 42:
2.4. Wind Tunnel Quantification of
- Page 43 and 44:
2.5. Measurement Instrumentation Th
- Page 45 and 46:
concentration limit. For the DustTr
- Page 47 and 48:
height of oil in a U-tube. The pres
- Page 49 and 50:
a) b) Figure 12. TSI DustTrak used
- Page 51 and 52:
∆P, (Pa) 800 600 400 200 0 Pressu
- Page 53 and 54:
2.6. Measurements 2.6.1. Threshold
- Page 55 and 56:
four different soils and variations
- Page 57 and 58:
was repeated for up to five velocit
- Page 59 and 60:
coarse Owens Lake sand (Soil #2 and
- Page 61 and 62:
The procedure of crust formation is
- Page 63 and 64:
a minimum temperature difference be
- Page 65 and 66:
Figure 16. Schematic of the believe
- Page 67 and 68:
Figure 18. Bagnold (1941) experimen
- Page 69 and 70:
a) b) Figure 20. The above figure i
- Page 71 and 72:
me Control Volume l, length Figure
- Page 73 and 74:
0.30 m Soil being Tested 5.0 m Wind
- Page 75 and 76:
a) b) Figure 26. Photographs of the
- Page 77 and 78:
Figure 28. Photograph showing the i
- Page 79 and 80:
0.30 m Hard Soil Crust Wind Directi
- Page 81 and 82:
Section 3. Results Summary • Soil
- Page 83 and 84:
extract. The arsenic soil concentra
- Page 85 and 86:
that crust development is most like
- Page 87 and 88:
3.2. Threshold Studies The threshol
- Page 89 and 90:
Voltage (V) 7 6 5 4 3 2 1 0 -1 Nort
- Page 91 and 92:
Voltage (V) 6 5 4 3 2 1 0 -1 UCD Fe
- Page 93 and 94:
tube. The corresponding plots of th
- Page 95 and 96:
z (m) 10 0 10 -1 10 -2 10 -3 10 -4
- Page 97 and 98:
z (m) 10 0 10 -1 10 -2 10 -3 10 -4
- Page 99 and 100:
z (m) 10 0 10 -1 10 -2 10 -3 10 -4
- Page 101 and 102:
u * (m/s) 1.0 0.8 0.6 0.4 0.2 0.0 N
- Page 103 and 104:
u * (m/s) 1.0 0.8 0.6 0.4 0.2 0.0 U
- Page 105 and 106:
3.4. PM10 Loose Soil Emission Rates
- Page 107 and 108: source of emissions and dust storms
- Page 109 and 110: z (m) 10 0 10 -1 10 -2 10 -3 10 -4
- Page 111 and 112: z (m) 10 0 10 -1 10 -2 10 -3 10 -4
- Page 113 and 114: z (m) UCD Fence Soil (Soil #4), ure
- Page 115 and 116: Table 5. Emission Rates for enhance
- Page 117 and 118: z (m) South Saltation Simulation, u
- Page 119 and 120: PM 10 Emission Rate (µg/m 2 s) Sou
- Page 121 and 122: z (m) 10 0 10 -1 10 -2 North Sand (
- Page 123 and 124: North Sand Sheet (Soil #2 over Soil
- Page 125 and 126: Q, Sand Flux (kg/m*s) 0.35 0.30 0.2
- Page 127 and 128: Q, Sand Flux (kg/m*s) 0.08 0.06 0.0
- Page 129 and 130: 3.7. Fetch Studies In studying the
- Page 131 and 132: similar amounts of PM 10; however,
- Page 133 and 134: z (m) 10 0 10 -1 10 -2 UCD Fence So
- Page 135 and 136: Emission Rate (mg/m*s) 15 10 Dirty
- Page 137 and 138: Emission Rate (mg/m*s) 8 6 4 2 0 No
- Page 139 and 140: Emission Rate (mg/m*s) North Sand S
- Page 141 and 142: 3.8. Moisture Content Studies The m
- Page 143 and 144: z (m) 10 0 10 -1 10 -2 10 -3 10 -4
- Page 145 and 146: Emission Rate (g/m 2 s) PM 10 Emiss
- Page 147 and 148: %(PM 2.5 /PM 10 ) 40 30 20 10 Pipe
- Page 149 and 150: 3.10. Crust Studies Experimentally,
- Page 151 and 152: sand abrasion, broken apart by expa
- Page 153 and 154: z (m) 10 0 10 -1 10 -2 10 -3 10 -4
- Page 155 and 156: Emission Rate (mg/m 2 s) 4 3 2 1 0
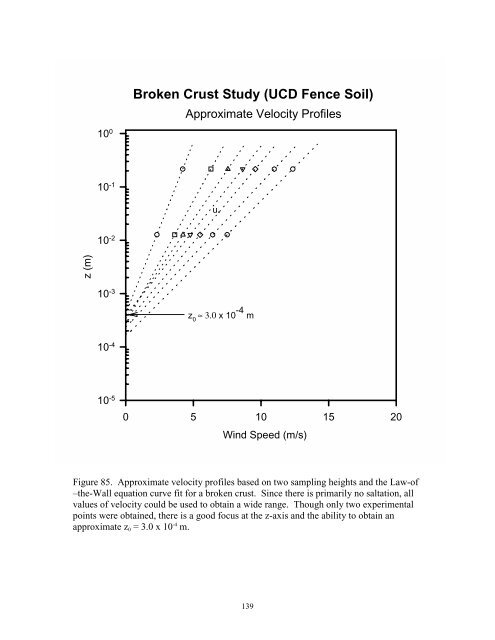
- Page 157: Figure 84. The hard crust was broke
- Page 161 and 162: • The major results are re-summar
- Page 163 and 164: enhancing the emissions. Moisture c
- Page 165 and 166: developed allow comparisons of the
- Page 167 and 168: Gillette, D.A., and Passi, R., 1988
- Page 169 and 170: White, B.R., 1979. Soil Transport b
- Page 171 and 172: Appendix A: Loose Soil Emissions Co
- Page 173 and 174: z (m) 1.00 0.10 0.01 Old Pipe Line
- Page 175 and 176: z (m) 1.00 0.10 0.01 Old Pipe Line
- Page 177 and 178: z (m) 1.00 0.10 0.01 North Sand (So
- Page 179 and 180: z (m) 1.00 0.10 0.01 North Sand (So
- Page 181 and 182: z (m) 1.00 0.10 0.01 North Sand (So
- Page 183 and 184: Dirty Socks Dune Sand (Soil #3), ur
- Page 185 and 186: Dirty Socks Dune Sand (Soil #3), ur
- Page 187 and 188: z (m) 1.00 0.10 0.01 UCD Fence Soil
- Page 189 and 190: z (m) 1.00 0.10 0.01 UCD Fence Soil
- Page 191 and 192: z (m) UCD Fence Soil (Soil #4), ure
- Page 193 and 194: z (m) 1.00 0.10 0.01 UCD Fence Soil
- Page 195 and 196: Appendix B: Enhanced Saltation Emis
- Page 197 and 198: z (m) 1.00 0.10 0.01 North Saltatio
- Page 199 and 200: z (m) North Saltation Simulation, u
- Page 201 and 202: z (m) 10 0 10 -1 10 -2 10 -3 10 -4
- Page 203 and 204: South Sand Saltation Simulation, ur
- Page 205 and 206: z (m) South Saltation Simulation, u
- Page 207 and 208: z (m) 10 0 10 -1 10 -2 10 -3 10 -4
- Page 209 and 210:
Appendix C: Fetch Study Concentrati
- Page 211 and 212:
z (m) Dirty Socks Sand Fetch Study,
- Page 213 and 214:
Dirty Socks Sand Fetch Study, uref
- Page 215 and 216:
z (m) 10 0 10 -1 10 -2 10 -3 10 -4
- Page 217 and 218:
z (m) UCD Fence Soil Fetch Study, u
- Page 219 and 220:
z (m) UCD Fence Soil Fetch Study, u
- Page 221 and 222:
z (m) 10 0 10 -1 10 -2 10 -3 10 -4
- Page 223 and 224:
z (m) UCD Fence Soil Fetch Study, u
- Page 225 and 226:
z (m) UCD Fence Soil Fetch Study, u
- Page 227 and 228:
z (m) 10 0 10 -1 10 -2 10 -3 10 -4
- Page 229 and 230:
z (m) 1.00 0.10 0.01 Old Pipe Line
- Page 231 and 232:
z (m) 1.00 0.10 0.01 Old Pipe Line
- Page 233 and 234:
z (m) UCD Fence Soil (Soil #4), ure
- Page 235 and 236:
z (m) UCD Fence Soil (Soil #4), ure
- Page 237 and 238:
z (m) UCD Fence Soil (Soil #4), ure
- Page 239 and 240:
Appendix E: PM2.5 Study Concentrati
- Page 241 and 242:
z (m) 1.00 0.10 0.01 Old Pipe Line
- Page 243 and 244:
z (m) 1.00 0.10 0.01 Old Pipe Line
- Page 245 and 246:
z (m) 1.00 0.10 0.01 UCD Fence Soil
- Page 247 and 248:
z (m) UCD Fence Soil (Soil #4), ure
- Page 249 and 250:
z (m) UCD Fence Soil (Soil #4), ure
- Page 251 and 252:
Appendix F: Wallace Laboratories Ch
- Page 253 and 254:
234
- Page 255 and 256:
236
- Page 257 and 258:
Appendix H: Individual Soil Gradati
- Page 259 and 260:
%Passing 100 80 60 40 20 0 North Sa
- Page 261:
%Passing 100 80 60 40 20 0 UCD Fenc