Download - Coordinates
Download - Coordinates
Download - Coordinates

Create successful ePaper yourself
Turn your PDF publications into a flip-book with our unique Google optimized e-Paper software.
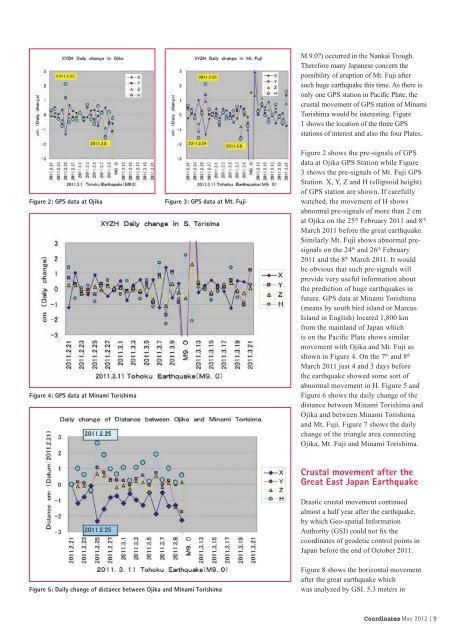
Figure 2: GPS data at Ojika<br />
Figure 4: GPS data at Minami Torishima<br />
Figure 3: GPS data at Mt. Fuji<br />
Figure 5: Daily change of distance between Ojika and Minami Torishima<br />
M 9.0?) occurred in the Nankai Trough.<br />
Therefore many Japanese concern the<br />
possibility of eruption of Mt. Fuji after<br />
such huge earthquake this time. As there is<br />
only one GPS station in Paci c Plate, the<br />
crustal movement of GPS station of Minami<br />
Torishima would be interesting. Figure<br />
1 shows the location of the three GPS<br />
stations of interest and also the four Plates.<br />
Figure 2 shows the pre-signals of GPS<br />
data at Ojika GPS Station while Figure<br />
3 shows the pre-signals of Mt. Fuji GPS<br />
Station. X, Y, Z and H (ellipsoid height)<br />
of GPS station are shown. If carefully<br />
watched, the movement of H shows<br />
abnormal pre-signals of more than 2 cm<br />
at Ojika on the 25 th February 2011 and 8 th<br />
March 2011 before the great earthquake.<br />
Similarly Mt. Fuji shows abnormal presignals<br />
on the 24 th and 26 th February<br />
2011 and the 8 th March 2011. It would<br />
be obvious that such pre-signals will<br />
provide very useful information about<br />
the prediction of huge earthquakes in<br />
future. GPS data at Minami Torishima<br />
(means by south bird island or Marcus<br />
Island in English) located 1,800 km<br />
from the mainland of Japan which<br />
is on the Paci c Plate shows similar<br />
movement with Ojika and Mt. Fuji as<br />
shown in Figure 4. On the 7 th and 8 th<br />
March 2011 just 4 and 3 days before<br />
the earthquake showed some sort of<br />
abnormal movement in H. Figure 5 and<br />
Figure 6 shows the daily change of the<br />
distance between Minami Torishima and<br />
Ojika and between Minami Torishima<br />
and Mt. Fuji. Figure 7 shows the daily<br />
change of the triangle area connecting<br />
Ojika, Mt. Fuji and Minami Torishima.<br />
Crustal movement after the<br />
Great East Japan Earthquake<br />
Drastic crustal movement continued<br />
almost a half year after the earthquake,<br />
by which Geo-spatial Information<br />
Authority (GSI) could not x the<br />
coordinates of geodetic control points in<br />
Japan before the end of October 2011.<br />
Figure 8 shows the horizontal movement<br />
after the great earthquake which<br />
was analyzed by GSI. 5.3 meters in<br />
<strong>Coordinates</strong> May 2012 | 9