a new sensor for detecting and characterising acoustic cavitation in ...
a new sensor for detecting and characterising acoustic cavitation in ...
a new sensor for detecting and characterising acoustic cavitation in ...

You also want an ePaper? Increase the reach of your titles
YUMPU automatically turns print PDFs into web optimized ePapers that Google loves.
Proceed<strong>in</strong>gs of the Institute of Acoustics<br />
A NEW SENSOR FOR DETECTING AND<br />
CHARACTERISING ACOUSTIC CAVITATION IN VIVO<br />
DURING ESWL<br />
F Fedele Medical Physics Department, Guy’s <strong>and</strong> St. Thomas’ NHS Trust, UK<br />
Institute of Sound <strong>and</strong> Vibration Research, University of Southampton, UK<br />
AJ Coleman Medical Physics Department, Guy’s <strong>and</strong> St. Thomas’ NHS Trust, UK<br />
TG Leighton Institute of Sound <strong>and</strong> Vibration Research, University of Southampton, UK<br />
PR White Institute of Sound <strong>and</strong> Vibration Research, University of Southampton, UK<br />
AM Hurrell Precision Acoustics Ltd., UK<br />
1 INTRODUCTION<br />
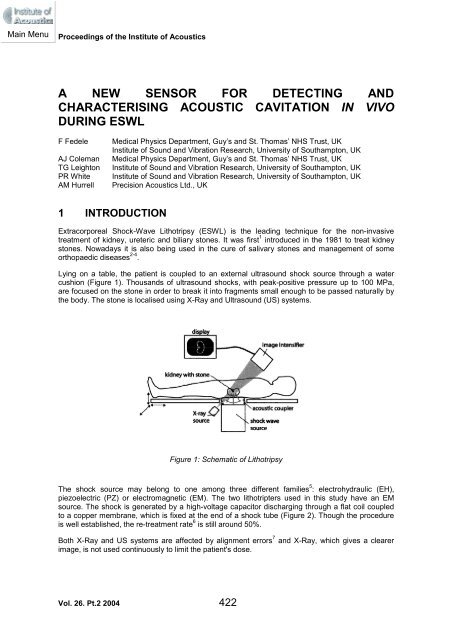
Extracorporeal Shock-Wave Lithotripsy (ESWL) is the lead<strong>in</strong>g technique <strong>for</strong> the non-<strong>in</strong>vasive<br />
treatment of kidney, ureteric <strong>and</strong> biliary stones. It was first 1 <strong>in</strong>troduced <strong>in</strong> the 1981 to treat kidney<br />
stones. Nowadays it is also be<strong>in</strong>g used <strong>in</strong> the cure of salivary stones <strong>and</strong> management of some<br />
orthopaedic diseases 2-4 .<br />
Ly<strong>in</strong>g on a table, the patient is coupled to an external ultrasound shock source through a water<br />
cushion (Figure 1). Thous<strong>and</strong>s of ultrasound shocks, with peak-positive pressure up to 100 MPa,<br />
are focused on the stone <strong>in</strong> order to break it <strong>in</strong>to fragments small enough to be passed naturally by<br />
the body. The stone is localised us<strong>in</strong>g X-Ray <strong>and</strong> Ultrasound (US) systems.<br />
Vol. 26. Pt.2 2004<br />
Figure 1: Schematic of Lithotripsy<br />
The shock source may belong to one among three different families 5 : electrohydraulic (EH),<br />
piezoelectric (PZ) or electromagnetic (EM). The two lithotripters used <strong>in</strong> this study have an EM<br />
source. The shock is generated by a high-voltage capacitor discharg<strong>in</strong>g through a flat coil coupled<br />
to a copper membrane, which is fixed at the end of a shock tube (Figure 2). Though the procedure<br />
is well established, the re-treatment rate 6 is still around 50%.<br />
Both X-Ray <strong>and</strong> US systems are affected by alignment errors 7 <strong>and</strong> X-Ray, which gives a clearer<br />
image, is not used cont<strong>in</strong>uously to limit the patient's dose.
Proceed<strong>in</strong>gs of the Institute of Acoustics<br />
Figure 2: Schematic representation of the EM source. (TSP) Triggered spark-gap. (SC) Flat<br />
solenoid. (IF) Polyamide film. (MF) Copper membrane<br />
Several projects have exam<strong>in</strong>ed the development of auxiliary target<strong>in</strong>g techniques that may identify<br />
if the stone has actually been hit by the beam 8-10 . Olson et al. 10 suggested a system based on the<br />
classification of the audible sound that is generated when the shock hits the stone, while other<br />
authors 8-9 worked on solutions based on the elaboration of ultrasound echoes from signals<br />
generated by active ultrasonic probes.<br />
A significant limitation of the present lithotripters is that there is no capability <strong>for</strong> on-l<strong>in</strong>e monitor<strong>in</strong>g<br />
of the degree of fragmentation of the stone. Usually the urologist tries to assess this by observ<strong>in</strong>g if<br />
any changes appear <strong>in</strong> the density or size of the stone <strong>in</strong> the X-Ray image.<br />
The underly<strong>in</strong>g physical mechanisms responsible of the fragmentation of the stone are still subject<br />
to <strong>in</strong>vestigation. Several studies <strong>in</strong>dicate that both direct stress damage <strong>and</strong> <strong>in</strong>direct <strong>cavitation</strong><br />
erosion seem to be necessary to obta<strong>in</strong> elim<strong>in</strong>able fragments 11 . The impact<strong>in</strong>g shockwave produces<br />
the first fissures <strong>in</strong> the stone (Figure 3). Later <strong>cavitation</strong> bubbles implod<strong>in</strong>g with<strong>in</strong> these splits cause<br />
the actual dis<strong>in</strong>tegration 12 .<br />
Figure 3: Sequence of high speed photographic pictures of human gallstone be<strong>in</strong>g hit by a shock<br />
wave <strong>in</strong> Sass et al. 1991. The <strong>in</strong>terval between each frame is of 0.1ms. (a) Taken 0.1ms prior the<br />
shock hits stone. The white arrow <strong>in</strong>dicates the shock orientation. The shock reaches the stones<br />
between (a) <strong>and</strong> (b). (b-h) These frames show <strong>cavitation</strong> activity. Note bubbles on the stone<br />
referr<strong>in</strong>g to <strong>cavitation</strong> with<strong>in</strong> small cracks. (i-k) Rapid material outburst. (l) Dis<strong>in</strong>tegration of the stone<br />
with<strong>in</strong> the crack.
Proceed<strong>in</strong>gs of the Institute of Acoustics<br />
In previous studies the authors 13 monitored <strong>cavitation</strong> <strong>in</strong>-vivo through the associated <strong>acoustic</strong><br />
emissions exploit<strong>in</strong>g an experimental focused piezoelectric bowl. The objective of this study was to<br />
design a <strong>new</strong> passive <strong>and</strong> unfocused <strong>acoustic</strong> <strong>sensor</strong> to detect <strong>and</strong> characterise <strong>cavitation</strong> <strong>in</strong> vivo<br />
dur<strong>in</strong>g ESWL.<br />
The first phase of the study used an experimental <strong>cavitation</strong> <strong>sensor</strong> (Figure 4, developed by the<br />
National Physical Laboratory 14 , NPL, UK) to record passive emissions from <strong>cavitation</strong> generated <strong>in</strong><br />
vitro by an experimental lithotripter 15 . This paper reports on the analysis of these emissions <strong>and</strong><br />
shows that they possess characteristics that depend on the degree of fragmentation of the stone.<br />
Exploit<strong>in</strong>g these prelim<strong>in</strong>ary results, some cl<strong>in</strong>ical prototypes (an example of which is displayed <strong>in</strong><br />
Figure 5) were developed <strong>in</strong> collaboration with Precision Acoustics Ltd. (PAL), UK. The prototypes<br />
have been patented 16 <strong>and</strong> they are currently be<strong>in</strong>g tested <strong>in</strong> the cl<strong>in</strong>ical environment.<br />
2 IN VITRO EXPERIMENTS<br />
2.1 Experimental set-up<br />
Figure 4: NPL cyl<strong>in</strong>drical <strong>cavitation</strong> <strong>sensor</strong><br />
Figure 5: Cl<strong>in</strong>ical prototype developed with PAL.<br />
Figure 6 shows a diagram of the experimental set-up. Stone samples were placed at the focus of a<br />
bench top EM lithotripter <strong>in</strong> spherical holders (table-tennis balls) of 2 cm diameter. Tests ensured<br />
that the holder walls did not significantly alter the lithotripter pressure field. A novel cyl<strong>in</strong>drical<br />
broadb<strong>and</strong> <strong>cavitation</strong> <strong>sensor</strong> 14 , made by the NPL, was then coupled to the stone holder. The balls<br />
were each filled with different grades of s<strong>and</strong>, m<strong>in</strong>imis<strong>in</strong>g the presence of entra<strong>in</strong>ed air bubbles:<br />
coarse s<strong>and</strong> (CS; gra<strong>in</strong> diameter 10-30 mm); medium s<strong>and</strong> (MS; gra<strong>in</strong> diameter 4-10 mm) or f<strong>in</strong>e<br />
s<strong>and</strong> (FS; gra<strong>in</strong> diameter 1-4mm).
Proceed<strong>in</strong>gs of the Institute of Acoustics<br />
Figure 6: Experimental set-up<br />
These graded s<strong>and</strong> targets were used to simulate a stone at different well-characterized stages of<br />
fragmentation as it is encountered dur<strong>in</strong>g the course of an ESWL treatment. One ball was filled with<br />
tap water (TW) to act as a control. The discharge potential of the EM source was set <strong>and</strong><br />
ma<strong>in</strong>ta<strong>in</strong>ed at 16 kV, which gave lithotripter shocks of 16 MPa peak-positive pressure <strong>and</strong> 3 MPa<br />
peak-negative pressure. The lithotripter pulses were measured us<strong>in</strong>g a Marconi Y-34-3598 PVDF<br />
bilam<strong>in</strong>ar membrane hydrophone (Ser. no. IP116, Sensitivity 53 mV/MPa). The detected signals<br />
were filtered us<strong>in</strong>g an analogue high pass filter with a cut-off frequency of 0.2 MHz, to suppress<br />
most of the background noise due to the EM source itself. The filtered signals were acquired us<strong>in</strong>g<br />
a LeCroy 9354L digital scope with a sampl<strong>in</strong>g frequency of 100 Msamples/s <strong>and</strong> the digital data<br />
were transferred to a PC with a LabVIEW <strong>in</strong>terface to be stored as text files. The stored data could<br />
then be processed us<strong>in</strong>g the MATLAB signal process<strong>in</strong>g toolbox. Figure 7 (upper box) displays a 16<br />
kV lithotripter pulse, measured as described above. The maximum positive pressure <strong>and</strong> the<br />
maximum negative pressure <strong>in</strong> the shock are respectively named peak-positive pressure <strong>and</strong> peak<br />
negative pressure. The lower box displays a typical output from the NPL <strong>cavitation</strong> <strong>sensor</strong> (currently<br />
uncalibrated). Two ma<strong>in</strong> bursts <strong>in</strong> the lower plot may be identified <strong>in</strong> the <strong>acoustic</strong> emission above<br />
the noise level. Previous work 17 <strong>in</strong>dicates that these components are related respectively to the first<br />
<strong>and</strong> second collapse of microscopic bubbles (present <strong>in</strong> a cloud around the beam axis <strong>and</strong> <strong>in</strong><br />
proximity of the stone 18 ) dur<strong>in</strong>g the shock-bubble <strong>in</strong>teraction. The <strong>in</strong>terval between these two bursts<br />
probably represents the mean <strong>in</strong>terval (tc) between the first <strong>and</strong> second rebound of each <strong>in</strong>dividual<br />
<strong>cavitation</strong> bubble dur<strong>in</strong>g ESWL.<br />
Figure 7: Experimental lithotripter pulse at 16kV (top). The detection of secondary <strong>acoustic</strong> emission<br />
(bottom)
Proceed<strong>in</strong>gs of the Institute of Acoustics<br />
The <strong>in</strong>teractions between a lithotripter pulse <strong>and</strong> a s<strong>in</strong>gle bubble may be described adopt<strong>in</strong>g the<br />
Gilmore model of bubble dynamics 13,17 . The fundamental assumptions of the model are: The bubble<br />
rema<strong>in</strong>s spherical throughout its motion; the radius of the bubble is much less than the wavelength<br />
of the applied field; the motion of the liquid is isentropic. The model has proved to be very useful<br />
even though only the second assumption is well satisfied <strong>in</strong> lithotripsy. Figure 8 shows the results<br />
obta<strong>in</strong>ed <strong>for</strong> an ideal lithotripter pulse 13, 17 <strong>and</strong> a bubble of 6 µm.<br />
Figure 8: Lithotripter pulse-bubble <strong>in</strong>teraction accord<strong>in</strong>g with the prediction of the Gilmore model of<br />
bubble dynamic. The <strong>in</strong>itial bubble radius was set to 6µm. (A) Lithotripter pulse. (B) Bubble radius<br />
(log-scale). (C) Pressure emitted by the bubble (log-scale).<br />
When the lithotripter pulse passes over the location of the bubble, the bubble suddenly collapses<br />
(first collapse) emitt<strong>in</strong>g a pressure spike. It then rebounds <strong>and</strong> undergoes an explosive growth to<br />
collapse aga<strong>in</strong> (second collapse) after a time named collapse time (tc), emitt<strong>in</strong>g another pressure<br />
pulse.<br />
2.2 Data analysis<br />
The collected data were analysed <strong>in</strong> both the time <strong>and</strong> frequency doma<strong>in</strong><br />
2.2.1 Analysis <strong>in</strong> the time doma<strong>in</strong><br />
A<br />
B<br />
C<br />
The signals have been analysed off-l<strong>in</strong>e us<strong>in</strong>g the MATLAB. An adaptive threshold algorithm that<br />
automatically detects the two bursts <strong>in</strong> an emission signal has been developed.<br />
It calculates their ma<strong>in</strong> parameters: duration, maximum amplitude <strong>and</strong> kurtosis (Figure 9). In order<br />
to estimate tc the algorithm calculates the central times of the two bursts <strong>and</strong> estimates tc as the<br />
difference between these two times.<br />
This dist<strong>in</strong>guishes the method of this paper from all previous studies 17, 18 , which estimated tc as the<br />
<strong>in</strong>terval between the two maxima of the two bursts.
Proceed<strong>in</strong>gs of the Institute of Acoustics<br />
Figure 9: Example of an analysis <strong>in</strong> the time doma<strong>in</strong>, show<strong>in</strong>g: The maximum amplitude of the first<br />
burst (m1); the duration of the first burst (d1); the central time of the first burst (t1); the collapse time<br />
(tc); the maximum amplitude of the second burst (m2); the duration of the second burst (d2); the<br />
central time of the second burst (t2). The picture does not illustrate the kurtosis, which is a measure<br />
of how peaked are the bursts.<br />
2.2.2 Analysis <strong>in</strong> the frequency doma<strong>in</strong><br />
An algorithm analyses a set of traces recorded under the same conditions <strong>in</strong> order to extract the key<br />
frequency characteristics of the first <strong>and</strong> the second burst accord<strong>in</strong>g to the follow<strong>in</strong>g procedure.<br />
Given the set of data, each burst is w<strong>in</strong>dowed <strong>and</strong> coherently averaged with the correspond<strong>in</strong>g<br />
ones <strong>in</strong> the other record<strong>in</strong>gs. Subsequently the Power spectral Densities of the two averages<br />
obta<strong>in</strong>ed (one <strong>for</strong> the first burst <strong>and</strong> one <strong>for</strong> the second) <strong>and</strong> their central frequencies are estimated<br />
(Figure 10).<br />
Figure 10: Example of an analysis <strong>in</strong> the frequency doma<strong>in</strong>. PSDs of the two burst (upper box).<br />
Normalised PSDs (lower box).
Proceed<strong>in</strong>gs of the Institute of Acoustics<br />
2.3 Results: characterisation of <strong>cavitation</strong> <strong>in</strong> tap water<br />
The time doma<strong>in</strong> analysis of the traces relative to the control sample, (tap water) gave results <strong>in</strong><br />
agreement with those of earlier experiments by the authors 17, 18 . The frequency doma<strong>in</strong> analysis <strong>in</strong><br />
the provided <strong>new</strong> <strong>in</strong><strong>for</strong>mation on the nature of the two bursts.<br />
2.3.1 Time doma<strong>in</strong><br />
The data recorded with the NPL <strong>cavitation</strong> <strong>sensor</strong> showed a positive correlation between the<br />
collapse time tc (estimated as described <strong>in</strong> 2.2.1) <strong>and</strong> the peak negative pressure of the lithotripter<br />
pulse (Figure 12). These results are <strong>in</strong> agreement with both the Gilmore model of bubble dynamics<br />
(2.2.1), <strong>and</strong> previous experiments by the authors 13, 17, 18 .<br />
This tends to confirm the hypothesis that the NPL experimental <strong>sensor</strong> was record<strong>in</strong>g essentially<br />
<strong>cavitation</strong> phenomena.<br />
[microseconds]<br />
340<br />
320<br />
300<br />
280<br />
260<br />
240<br />
220<br />
Collapse time versus peak negative pressure<br />
2.31 2.51 2.71 2.91<br />
[MPa]<br />
3.11 3.31 3.51<br />
Figure 11: Trend of the estimated collapse time tc with the peak- negative pressure<br />
2.3.2 Frequency doma<strong>in</strong><br />
In each set of data the central frequency of the first burst is lower than that of the second burst. In<br />
particular the PSD of the first burst has its predom<strong>in</strong>ant component around 0.2 MHz, which is the<br />
ma<strong>in</strong> frequency of the lithotripter pulse. The second burst that represent the activity of bubbles <strong>in</strong><br />
free-evolution has a central frequency around 0.5 MHz Assum<strong>in</strong>g that most of bubble <strong>in</strong> the cloud<br />
have this resonant frequency, accord<strong>in</strong>g to the M<strong>in</strong>naert equation 19 (f0 ∝ 1/R0) this gives a radius of<br />
6 µm (used <strong>in</strong> the Gilmore simulation, see 2.3.1).<br />
2.4 Results: Characterisation of <strong>cavitation</strong> adjacent to stone samples<br />
The results show a significant dependency of some of the <strong>cavitation</strong> emission parameters on the<br />
size of the stone fragments.<br />
2.4.1 Time doma<strong>in</strong><br />
The collapse time tc (Figure 12 A) decreases significantly with the size of the fragments, imply<strong>in</strong>g<br />
that the size of the bubble present is related to that of the fragments 19 . The first burst conta<strong>in</strong>s both<br />
energy scattered from the <strong>in</strong>cident lithotripter pulse; plus any <strong>cavitation</strong> emission. The amplitude<br />
(Figure 12 B) of the first burst clearly decreases with the size of the fragments, while its duration<br />
<strong>in</strong>creases (Figure 12 C). This may <strong>in</strong>dicate less coherent scatter<strong>in</strong>g from the stone.
Proceed<strong>in</strong>gs of the Institute of Acoustics<br />
[mV]<br />
[microseconds]<br />
[microseconds]<br />
500<br />
400<br />
300<br />
200<br />
410<br />
370<br />
330<br />
290<br />
65<br />
60<br />
55<br />
50<br />
45<br />
40<br />
A<br />
B<br />
C<br />
CS<br />
CS<br />
CS<br />
Collapse time<br />
MS<br />
stone sample<br />
Amplitude of the first burst<br />
MS<br />
stone sample<br />
Duration of the first burst<br />
MS<br />
stone sample<br />
Fragments size<br />
Figure 12: (A) collapse time tc. (B) Maximum amplitude of the first burst. (C) Duration of the first<br />
burst. The l<strong>in</strong>es between each po<strong>in</strong>t <strong>in</strong>dicate best l<strong>in</strong>ear fitt<strong>in</strong>g.<br />
FS<br />
FS<br />
FS<br />
TW<br />
TW<br />
TW
Proceed<strong>in</strong>gs of the Institute of Acoustics<br />
2.4.2 Frequency doma<strong>in</strong><br />
The central frequency (Figure 13) of the first burst is, <strong>for</strong> each sample, lower than that <strong>for</strong> the<br />
second burst <strong>and</strong> close to the ma<strong>in</strong> frequency of the lithotripter pulse (0.2 MHz). This result is <strong>in</strong><br />
agreement with the hypothesis there is considerable scatter<strong>in</strong>g component of the first burst.<br />
Comparison of a set of measurements related to the same burst shows no significant difference<br />
between the frequencies of the different samples.<br />
MHz<br />
1<br />
0.8<br />
0.6<br />
0.4<br />
0.2<br />
0<br />
Comparison of the central frequencies of the<br />
two bursts<br />
CS<br />
MS<br />
stone sample<br />
FS TW<br />
first burst second burst<br />
Figure 13: Central frequencies of the two bursts<br />
3 DESIGN OF A CLINICAL PROTOTYPE<br />
The prototype (Figure 5) is a passive hydrophone made of a circular piezo-polymer PVdF element<br />
of 2 cm diameter encapsulated <strong>in</strong> an external <strong>in</strong>sulat<strong>in</strong>g shield. The size of the element has been<br />
designed to ensure that a path difference no greater than 0.1 mm occurs <strong>for</strong> emissions com<strong>in</strong>g from<br />
the kidney at 3 MHz. The <strong>sensor</strong> is applied to the patient satisfy<strong>in</strong>g the restrictions of a class BF<br />
medical device accord<strong>in</strong>g to the IEC60601-1. All the equipment has successfully passed electrical<br />
safety tests be<strong>for</strong>e its use <strong>in</strong> the cl<strong>in</strong>ic. Ethics approval has been obta<strong>in</strong>ed.<br />
4 TEST OF THE PROTOTYPE IN VITRO<br />
Several sets of record<strong>in</strong>gs were made simultaneously us<strong>in</strong>g the NPL <strong>cavitation</strong> <strong>sensor</strong> <strong>and</strong> the PAL<br />
cl<strong>in</strong>ical prototype. The NPL was left at the focus of the lithotripter (coupled to the stone holder) while<br />
the PAL was placed at different positions laterally off-axis, fac<strong>in</strong>g the NPL <strong>and</strong> the stone. The PAL<br />
was placed off-axis to reproduce the configuration it would be <strong>in</strong> vivo, where it is not possible to<br />
place any <strong>sensor</strong> between the source <strong>and</strong> the stone, because this would <strong>in</strong>terfere with the treatment<br />
itself. A correlation coefficient of 0.4 was found when the two <strong>sensor</strong>s were close together (PAL<br />
5mm off-axis), which decreased mov<strong>in</strong>g them further. Figure 14 shows an example of the data<br />
recorded by the two <strong>sensor</strong>s when they were close together.
Proceed<strong>in</strong>gs of the Institute of Acoustics<br />
Figure 14: Data simultaneously recorded by the NPL (upper box) <strong>and</strong> PAL (lower box) <strong>sensor</strong>s<br />
5 TEST OF THE PROTOTYPE IN VIVO<br />
The prototype was then tested on 15 consent<strong>in</strong>g patients undergo<strong>in</strong>g lithotripsy at Guy’s <strong>and</strong> St.<br />
Thomas’ Hospital, after the design of the experiments was approved by the Ethical Committee of<br />
the hospital. The cl<strong>in</strong>ical lithotripter, at Guy’s Hospital, London, is a Storz Modulith SLX-MX.<br />
Exploit<strong>in</strong>g the results of the test <strong>in</strong> vitro, the <strong>sensor</strong> was placed on the side of the torso <strong>in</strong><br />
correspondence of the treated kidney rather than on the front of the patient abdomen.<br />
6 CONCLUSIONS<br />
It has been shown <strong>in</strong> vitro that it is possible to use a passive <strong>acoustic</strong> device <strong>for</strong> diagnostic<br />
monitor<strong>in</strong>g dur<strong>in</strong>g lithotripsy, by exploit<strong>in</strong>g the <strong>in</strong><strong>for</strong>mation carried by the passive <strong>cavitation</strong><br />
emission. The prototype device has been tested <strong>in</strong> the cl<strong>in</strong>ic, <strong>and</strong> has been shown to be capable of<br />
<strong>detect<strong>in</strong>g</strong> the first <strong>and</strong> second bursts of <strong>acoustic</strong> emission from the target. Prelim<strong>in</strong>ary analysis of<br />
the signal demonstrates similar features to those observed <strong>in</strong> vitro. Further work is needed to<br />
establish the parameters that correlate with the condition of the target material.<br />
7 ACKNOWLEDGMENTS<br />
This research was f<strong>in</strong>anced by the Eng<strong>in</strong>eer<strong>in</strong>g <strong>and</strong> Physical Sciences Research Council, UK<br />
GR/N19243. The authors thanks Mrs Terri Gill at PAL, Dr. Bajram Zeqiri <strong>and</strong> Ms. Cather<strong>in</strong>e Bickley<br />
at NPL, Mr. Jonathan Glass, Mr. Richard Tiptaff, , Mr Simon Ryves <strong>and</strong> all the Lithotripsy unit, the<br />
Mechanical Workshop <strong>and</strong> Electro Biomedical Eng<strong>in</strong>eer<strong>in</strong>g Section at Guy’s <strong>and</strong> St.<br />
Thomas’Hospital, London, <strong>for</strong> their collaboration.<br />
8 REFERENCES<br />
1. C. Chaussy, E. Schmiedt, D. Jocham, W. Brendel, B. Forssmann <strong>and</strong> V. Walther , ‘First<br />
cl<strong>in</strong>ical experience with extracorporeally <strong>in</strong>duced destruction of kidney stones by shock<br />
waves. 1981’. Journal of Urology 167(5) 1957-1960. (2002).<br />
2. H. Iro, N. Nitsche, J. Meier, P.M. Wirtz <strong>and</strong> C.H. Ell, ‘Piezoelectric shock wave lithotripsy of<br />
salivary gl<strong>and</strong> stones: an <strong>in</strong> vitro feasibility study’. Journal of Lithotripsy Stone Disease 3(3)<br />
211-216. (1991).<br />
3. M. Maier, S. Milz, T. Tischer, W. Munz<strong>in</strong>g, N. Manthey, A. Stabler et al., ‘Influence of<br />
extracorporeal shock-wave application on normal bone <strong>in</strong> an animal model <strong>in</strong> vivo.<br />
Sc<strong>in</strong>tigraphy, MRI <strong>and</strong> histopathology’. J Bone Jo<strong>in</strong>t Surg Br 84(4) 592-599. (2002):
Proceed<strong>in</strong>gs of the Institute of Acoustics<br />
4. C. Von Eiff, J. Overbeck, G. Haupt, M. Herrmann, S. W<strong>in</strong>ckler, K.D. Richter et al.,<br />
‘Bactericidal effect of extracorporeal shock waves on Staphylococcus aureus’. J Med<br />
Microbiol: 49(8) 709-712 (2000).<br />
5. K.T. Ison, ‘Physical <strong>and</strong> technical <strong>in</strong>troduction to lithotripsy’, <strong>in</strong>: M.J. Coptcoat, R.A. Miller<br />
<strong>and</strong> J.E.A. Wicklam Eds, ‘Lithotripsy II. Textbook of second generation extracorporeal<br />
lithotripsy’, BDI Publish<strong>in</strong>g, London, 7-12 (1987).<br />
6. D.A. Tolley <strong>and</strong> P. Downey, 'Current advances <strong>in</strong> shock wave lithotripsy', Current Op<strong>in</strong>ion <strong>in</strong><br />
Urology 9(4) 319-23 (1999).<br />
7. R.M. Schmitt, H. Wuster, W. Kraus <strong>and</strong> M. Bib<strong>in</strong>ger, ‘The effects of errors <strong>in</strong> position<strong>in</strong>g<br />
lithotriptor <strong>and</strong> imag<strong>in</strong>g kidney stones ultrasound’, Proc. of Annual <strong>in</strong>ternational conference<br />
of the IEEE Eng<strong>in</strong>eer<strong>in</strong>g <strong>in</strong> Medic<strong>in</strong>e <strong>and</strong> Biology Society, Vol. 12(1), 252-253 (1990).<br />
8. E. Hausler, V. Rech <strong>and</strong> M. Wache M., ‘Transient <strong>cavitation</strong> based ultrasonic lithotriptor<br />
position<strong>in</strong>g system’, Proc of the Annual <strong>in</strong>ternational conference of the IEEE Eng<strong>in</strong>eer<strong>in</strong>g <strong>in</strong><br />
Medic<strong>in</strong>e <strong>and</strong> Biology Society, Vol. 13, 185-186 (1991).<br />
9. C.C. Chang, S.M. Liang, Y.R. Pu, C.H. Chen, I. Manousakas, T.S. Chen et al., ‘In vitro<br />
study of ultrasound based real-time track<strong>in</strong>g of renal stones <strong>for</strong> shock wave lithotripsy’,<br />
Journal of Urology, 166(1) 28-32 (2001).<br />
10. L. Olsson, L.O. Almquist, A. Grennberg <strong>and</strong> N.G. Holmer, ‘Analysis <strong>and</strong> classification of<br />
secondary sounds from the dis<strong>in</strong>tegration of kidney stones with <strong>acoustic</strong> shock waves’,<br />
Ultrasound. Med. Biol., 17(5):491-495 (1991).<br />
11. S. Zhu, F.H. Cocks, G.M. Prem<strong>in</strong>ger <strong>and</strong> P. Zhong, ‘The role of stress waves <strong>and</strong> <strong>cavitation</strong><br />
<strong>in</strong> stone comm<strong>in</strong>ution <strong>in</strong> shock wave lithotripsy’, Ultrasound <strong>in</strong> Medic<strong>in</strong>e <strong>and</strong> Biology, 28(5)<br />
661-671 (2002).<br />
12. W. Sass, M. Braunlich, H.P. Dreyer, E. Matura, W. Folberth, H.G. Preismeyer et al. ‘The<br />
mechanisms of stone dis<strong>in</strong>tegration by shock waves’, Ultrasound Med Biol., 17(3) 239-243<br />
(1991).<br />
13. K.B. Cunn<strong>in</strong>gham, A.J. Coleman, T.G. Leighton <strong>and</strong> P.R. White, ‘Characteris<strong>in</strong>g <strong>in</strong> vivo<br />
<strong>acoustic</strong> <strong>cavitation</strong> dur<strong>in</strong>g lithotripsy with time-frequency methods’, Acoustics Bullet<strong>in</strong>, 26(5)<br />
10-16 (2002).<br />
14. B. Zeqiri, S.C. Davies, P.N. Gelat, M. Hodnett <strong>and</strong> U.I. Lula, ‘Novel <strong>sensor</strong>s <strong>for</strong> monitor<strong>in</strong>g<br />
<strong>acoustic</strong> <strong>cavitation</strong>’, Proc of IEEE Ultrasonics Symposium, Vol. 1, 417-420 (2000).<br />
15. F. Fedele, A.J. Coleman <strong>and</strong> T.G. Leighton, ‘Use of cyl<strong>in</strong>drical PVdF hydrophone <strong>in</strong> a study<br />
of <strong>cavitation</strong> adjacent to stone phantoms dur<strong>in</strong>g extracorporeal shockwave lithotripsy’, Proc<br />
of the IPEM Annual Scientific Meet<strong>in</strong>g, 66. Bath, UK, September 2003.<br />
16. T.G. Leighton, A.J. Coleman, F. Fedele <strong>and</strong> P.R. White, ‘A passive <strong>acoustic</strong> system <strong>for</strong><br />
evaluat<strong>in</strong>g the <strong>in</strong> vivo per<strong>for</strong>mance of extracorporeal shock wave lithotripsy’, UK Patent<br />
Application No. 0319863.7 (2003).<br />
17. A.J. Coleman, M.J. Choi, J.E. Saunders, T.G. Leighton, ‘Acoustic emission <strong>and</strong><br />
sonolum<strong>in</strong>escence due to <strong>cavitation</strong> at the beam focus of an electrohydraulic shock wave<br />
lithotripter’, Ultrasound <strong>in</strong> Medic<strong>in</strong>e <strong>and</strong> Biology, 18 267-281 (1992).<br />
18. A.J. Coleman, M. Whitlock, T. Leighton <strong>and</strong> J.E. Saunders, ‘The spatial distribution of<br />
<strong>cavitation</strong> <strong>in</strong>duced <strong>acoustic</strong> emission, sonolum<strong>in</strong>escence <strong>and</strong> cell lysis <strong>in</strong> the field of a shock<br />
wave lithotripter’, Phys Med Biol., 38(11) 1545-1560 (1993).<br />
19. T.G. Leighton, ‘The Acoustic Bubble’, Academic Press, London (1994).