Alarm Analytics V9.1 Product Bulletin
Alarm Analytics V9.1 Product Bulletin
Alarm Analytics V9.1 Product Bulletin

Create successful ePaper yourself
Turn your PDF publications into a flip-book with our unique Google optimized e-Paper software.
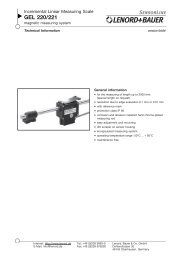
Each alarm count bar adds up to 100% of the total count, showing the percent of<br />
alarms at each priority. Superimposed on the chart is the total number of transitions into<br />
alarm per interval in the form of a line chart. The <strong>Alarm</strong> Distribution by Interval with<br />
Priority chart integrates into Excel’s PivotTable functionality for its data.<br />
Figure 1: <strong>Alarm</strong> Distribution by Interval Figure 2: <strong>Alarm</strong> Distribution by Interval<br />
with Priority<br />
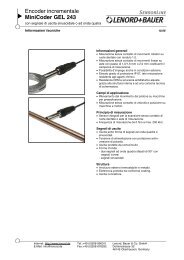
<strong>Alarm</strong> Distribution by Priority<br />
If the distribution of the alarms by priority only<br />
is important the best visualization report is<br />
<strong>Alarm</strong> Distribution by Priority. This simple pie<br />
chart allows for a quick insight into how many<br />
alarms you are experiencing at each priority<br />
level. The priority levels are set to EEMUA<br />
standards by default (critical, high, medium and<br />
low) and can be customized easily with the<br />
Global <strong>Alarm</strong> Priority Manager.<br />
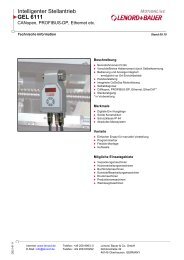
Figure 4: <strong>Alarm</strong> Tag Frequency<br />
ICONICS <strong>Product</strong> <strong>Bulletin</strong><br />
Copyright © 2009 ICONICS, Inc.<br />
All Rights Reserved.<br />
Figure 3: <strong>Alarm</strong> Distribution by Priority<br />
<strong>Alarm</strong> Tag Frequency<br />
This report indicates which alarm tags went into<br />
alarm most often over a given period of time.<br />
The report uses a Pareto chart to sort the<br />
alarms by number of occurrences, so the<br />
“worst” alarm is the first one in the chart. The<br />
user can configure the maximum number of<br />
rows to return in the report, effectively turning<br />
it into a “Top 10” or “Top X” Pareto chart.<br />
Page 3 of 7<br />
February 2009<br />
ICO-PBB-007