Alarm Analytics V9.1 Product Bulletin
Alarm Analytics V9.1 Product Bulletin
Alarm Analytics V9.1 Product Bulletin

Create successful ePaper yourself
Turn your PDF publications into a flip-book with our unique Google optimized e-Paper software.
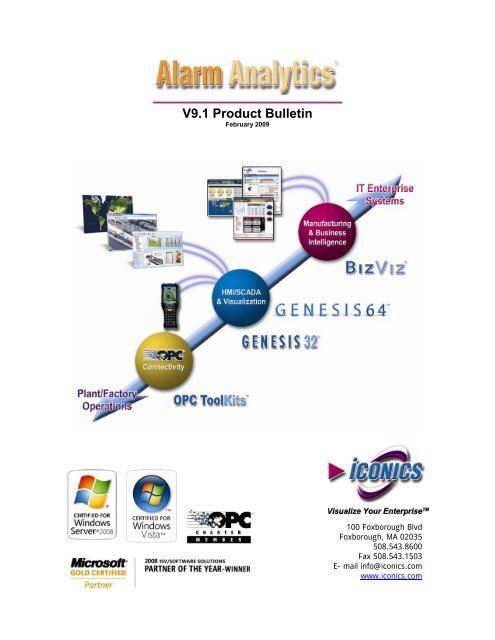
<strong>V9.1</strong> <strong>Product</strong> <strong>Bulletin</strong><br />
February 2009<br />
100 Foxborough Blvd<br />
Foxborough, MA 02035<br />
508.543.8600<br />
Fax 508.543.1503<br />
E- mail info@iconics.com<br />
www.iconics.com
<strong>Alarm</strong> <strong>Analytics</strong> <strong>V9.1</strong><br />
<strong>Product</strong> <strong>Bulletin</strong><br />
ICONICS <strong>Product</strong> <strong>Bulletin</strong><br />
Copyright © 2009 ICONICS, Inc.<br />
All Rights Reserved.<br />
February 2009<br />
Complies with industry standards EEMUA 191 and OSHA PSM 1910.119 for<br />
<strong>Alarm</strong> <strong>Analytics</strong>, connects to all major databases<br />
ICONICS’ <strong>Alarm</strong> <strong>Analytics</strong> product<br />
enables plant personnel to Visualize,<br />
Analyze, and Manage alarm<br />
information in accordance with the<br />
industry best practices. The push for<br />
operational excellence in the<br />
manufacturing industry is driving the<br />
need for more effective alarm<br />
analytics. Proper analysis of alarms<br />
and events in a manufacturing plant<br />
can reveal significant opportunities<br />
for improving current operations and<br />
mitigating abnormal situations.<br />
BizViz <strong>Alarm</strong> <strong>Analytics</strong> captures and<br />
analyzes all alarm and event information to identify frequent alarms, chattering alarms,<br />
cross-correlated alarms, and many more alarm-related issues. This module also records,<br />
analyzes, and displays operator-initiated process changes, which then yield significant<br />
insight into the performance of the entire system.<br />
Features Benefits<br />
Store <strong>Alarm</strong>s and Events to popular Captures and archives alarms, operator actions, and<br />
databases<br />
system events into SQL, Oracle, Access or MSDE.<br />
Analyze <strong>Alarm</strong>s in real-time or by a Identifies unusual alarm occurrences, trends in plant<br />
specified time period<br />
alarms and control modules responsible for those alarms<br />
Benchmark alarm performance Benchmarks alarms vs. established standard EEMUA 191<br />
recommended best practices.<br />
Deliver alarm information in industry<br />
standard reports<br />
Complies with standards set by OSHA PSM 1910.119.<br />
Leverage Microsoft Excel expertise <strong>Alarm</strong> <strong>Analytics</strong> is built on top of widely used Microsoft® Excel<br />
Real-time <strong>Alarm</strong> <strong>Analytics</strong> drives <strong>Alarm</strong> <strong>Analytics</strong> provides up-to-the-minute reports that<br />
better process understanding<br />
show alarm frequency, statistics, user acknowledgements,<br />
alarm priority distributions or system events.<br />
Easy configuration with industry Predefined reports and wizards help focus on a plant<br />
standard predefined reports<br />
area, time period or event type.<br />
Identify areas for improvement Built-in Pareto charts to help rank alarms by frequency<br />
and categorize problematic areas such as tag chattering.<br />
Distribute <strong>Alarm</strong> <strong>Analytics</strong> reports Users can view reports in Excel, PDF, or HTML format<br />
via e-mail or fax<br />
on the Web or receive them via automated e-mail.<br />
Simplifies Incident Investigation Easily access all recorded events and operator actions.<br />
Page 1 of 7<br />
February 2009<br />
ICO-PBB-007
<strong>Alarm</strong> <strong>Analytics</strong>:<br />
Industry Standard-based <strong>Alarm</strong> Reporting<br />
<strong>Alarm</strong> <strong>Analytics</strong>, which is based on ICONICS’ BizViz ReportWorX and <strong>Alarm</strong>WorX32 <strong>Alarm</strong><br />
Logger, provides advanced <strong>Alarm</strong> <strong>Analytics</strong>, <strong>Alarm</strong> Reporting, and <strong>Alarm</strong> Management. <strong>Alarm</strong><br />
<strong>Analytics</strong> supports industry standards for <strong>Alarm</strong> Management issued by OSHA and EEMUA.<br />
The <strong>Alarm</strong> <strong>Analytics</strong> module contains 15 standard reports with advanced <strong>Alarm</strong> KPIs,<br />
including the following:<br />
1. <strong>Alarm</strong> Distribution by Interval<br />
2. <strong>Alarm</strong> Distribution by Interval with Priority<br />
3. <strong>Alarm</strong> Distribution by Priority<br />
4. <strong>Alarm</strong> Rate Distribution by Interval<br />
5. <strong>Alarm</strong> Tag Chattering<br />
6. <strong>Alarm</strong> Tag Frequency<br />
7. <strong>Alarm</strong>s from Worst Actors by Interval<br />
8. Average <strong>Alarm</strong> Rate per Minor/Major Interval<br />
9. Cross-Correlation Analysis<br />
10. Operator Changes by Interval<br />
11. Operator Response Time<br />
12. Peak <strong>Alarm</strong> Rate Distribution<br />
13. Standing <strong>Alarm</strong>s at Time<br />
14. Standing <strong>Alarm</strong>s by Interval<br />
15. Standing <strong>Alarm</strong>s Duration<br />
Pre-Configured Templates<br />
<strong>Alarm</strong> Distribution by Interval<br />
This report provides a quick insight into the frequency of alarms over a specified<br />
interval. It shows an alarm transaction count per interval over a time range. The user<br />
specifies the time interval such as daily, weekly, or monthly and the report automatically<br />
adjusts the chart with the new interval values. In addition, the alarms can be separated<br />
out by priority according to priority levels that you can customize to match the standards<br />
at your facility.<br />
The color coding corresponds to alarm priority levels, which by default match the EEMUA<br />
standards for “critical”, “high”, “medium” and “low”. The Global <strong>Alarm</strong> Priority Manager<br />
allows the user to define the OPC Severity bands that correspond to their custom<br />
priorities if different from the EEMUA standards.<br />
ICONICS <strong>Product</strong> <strong>Bulletin</strong><br />
Copyright © 2009 ICONICS, Inc.<br />
All Rights Reserved.<br />
Page 2 of 7<br />
February 2009<br />
ICO-PBB-007
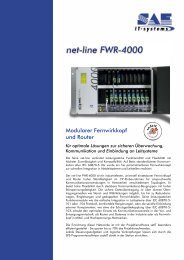
Each alarm count bar adds up to 100% of the total count, showing the percent of<br />
alarms at each priority. Superimposed on the chart is the total number of transitions into<br />
alarm per interval in the form of a line chart. The <strong>Alarm</strong> Distribution by Interval with<br />
Priority chart integrates into Excel’s PivotTable functionality for its data.<br />
Figure 1: <strong>Alarm</strong> Distribution by Interval Figure 2: <strong>Alarm</strong> Distribution by Interval<br />
with Priority<br />
<strong>Alarm</strong> Distribution by Priority<br />
If the distribution of the alarms by priority only<br />
is important the best visualization report is<br />
<strong>Alarm</strong> Distribution by Priority. This simple pie<br />
chart allows for a quick insight into how many<br />
alarms you are experiencing at each priority<br />
level. The priority levels are set to EEMUA<br />
standards by default (critical, high, medium and<br />
low) and can be customized easily with the<br />
Global <strong>Alarm</strong> Priority Manager.<br />
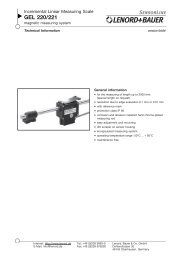
Figure 4: <strong>Alarm</strong> Tag Frequency<br />
ICONICS <strong>Product</strong> <strong>Bulletin</strong><br />
Copyright © 2009 ICONICS, Inc.<br />
All Rights Reserved.<br />
Figure 3: <strong>Alarm</strong> Distribution by Priority<br />
<strong>Alarm</strong> Tag Frequency<br />
This report indicates which alarm tags went into<br />
alarm most often over a given period of time.<br />
The report uses a Pareto chart to sort the<br />
alarms by number of occurrences, so the<br />
“worst” alarm is the first one in the chart. The<br />
user can configure the maximum number of<br />
rows to return in the report, effectively turning<br />
it into a “Top 10” or “Top X” Pareto chart.<br />
Page 3 of 7<br />
February 2009<br />
ICO-PBB-007
<strong>Alarm</strong> Tag Chattering<br />
This report is represented by a table that shows alarm tags that go in and out of alarm<br />
repeatedly in a short period of time (chattering). The user specifies a time window and<br />
the maximum number of rows. If an alarm<br />
repeats within the time window it is<br />
considered a chattering alarm and part of a<br />
cluster. For each tag, the table also includes<br />
the number of clusters, the average<br />
occurrences per cluster and the total<br />
number of occurrences. The table is sorted<br />
by the Cluster Member Percentage.<br />
The percentage of occurrences that happen<br />
in a cluster (Cluster Member Percentage) is<br />
calculated as follows:<br />
Cluster Member Percentage = (Avg. occurrences per cluster) * (# of clusters) / (total occurrences)<br />
Cross Correlation Analysis<br />
This analysis finds alarms that always (or usually) occur one after another which<br />
suggests correlation between two alarms. This process compares all combinations of<br />
pairs of alarm tags and the results for<br />
each alarm pair are shown in tabular<br />
format. The table shows the following<br />
important information:<br />
Occurrence Count – The number of<br />
times the child tag occurred after the<br />
primary tag, within the time window.<br />
Predictability – The percentage of<br />
time that the primary alarm occurred<br />
and the child alarm occurred within<br />
the time window i.e. 100% if the child<br />
alarm occurred every time the primary<br />
alarm occurred.<br />
ICONICS <strong>Product</strong> <strong>Bulletin</strong><br />
Copyright © 2009 ICONICS, Inc.<br />
All Rights Reserved.<br />
Figure 5: <strong>Alarm</strong> Tag Chattering<br />
Figure 6: Cross Correlation<br />
Significance – The percentage of time the child alarm occurs within the window of the<br />
primary, i.e. 100% if the child alarm only occurs after the primary alarm within the time window.<br />
Page 4 of 7<br />
February 2009<br />
ICO-PBB-007
Operator Response Time and Operator Changes by Interval<br />
This report analyzes the time it takes an<br />
operator to respond to each alarm condition<br />
(Acknowledge, or ACK for short) and the<br />
time for the condition to Return to Normal<br />
(RTN). Since each row summarizes multiple<br />
occurrences, the Min, Max and Average<br />
values are shown. The table is sorted in<br />
descending order according to whatever the<br />
user selects while executing the report. The<br />
Operator Changes report by interval shows<br />
operator actions as defined in OPC Tracking<br />
event in GenEvent audit tracking system.<br />
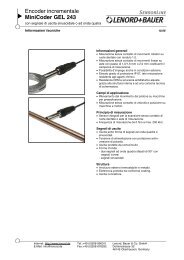
Figure 8: Standing <strong>Alarm</strong>s by Interval<br />
ICONICS <strong>Product</strong> <strong>Bulletin</strong><br />
Copyright © 2009 ICONICS, Inc.<br />
All Rights Reserved.<br />
Figure 7: Operator Response Time<br />
Standing <strong>Alarm</strong>s at Time, by<br />
Interval and Duration<br />
Standing alarms are the ones that show up on the<br />
<strong>Alarm</strong>WorX32 viewer (i.e. active and/or<br />
unacknowledged alarms). A snapshot of the<br />
number of standing alarms is captured at the end<br />
of each interval and is displayed on a bar chart.<br />
The related reports include Standing <strong>Alarm</strong>s at<br />
Time and Standing <strong>Alarm</strong> Duration.<br />
Page 5 of 7<br />
February 2009<br />
ICO-PBB-007
Configuring <strong>Alarm</strong> <strong>Analytics</strong><br />
Figure 9: Report<br />
Configurator<br />
Unified Web Interface<br />
<strong>Alarm</strong> <strong>Analytics</strong> users can now visualize all of their<br />
configured data sources in one centralized location and edit<br />
them through simple property dialogs. This leads to much<br />
better performance when loading and editing your reports.<br />
Another revolutionary<br />
new feature is the<br />
Layout Manager. By far<br />
the most noticeable<br />
difference for our users<br />
will be the ease with<br />
which they can now<br />
configure many cells for<br />
data. Hundreds of OPC<br />
tags can be added to a<br />
report in just seconds!<br />
Figure 10: Layout Manager<br />
<strong>Alarm</strong> <strong>Analytics</strong> leverages the power of the Unified Web Interface for V9, which allows<br />
users to visualize, execute, and manage their reports and transactions from any Webaccessible,<br />
thin-client browser.<br />
The Unified Web Interface is ideal for thin-client applications where access to the <strong>Alarm</strong><br />
<strong>Analytics</strong> Server is restricted.<br />
Benefits of Unified Web Interface:<br />
• Visualize reports with thinclient<br />
browser<br />
• Execute and manage reports<br />
from central location<br />
• Customize look and feel of<br />
your Web interface<br />
• Sort and group reports for<br />
easier navigation<br />
• Create “Favorite” folder<br />
ICONICS <strong>Product</strong> <strong>Bulletin</strong><br />
Copyright © 2009 ICONICS, Inc.<br />
All Rights Reserved.<br />
Figure 11: Unified Web Interface<br />
Page 6 of 7<br />
February 2009<br />
ICO-PBB-007
System Requirements<br />
The BizViz <strong>Alarm</strong> <strong>Analytics</strong> product includes ReportWorX and <strong>Alarm</strong>WorX32 Logger and<br />
requires the following minimum hardware, software, and operating system components.<br />
System requirements may vary based on application size, system performance<br />
requirements, and loading factors.<br />
Microsoft Windows 2000 Professional or 2000 Server, or<br />
Windows XP Professional, or Windows Server 2003<br />
MSDE 2000, SQL Server 2000, SQL Server Express, or SQL Server 2005<br />
Microsoft .NET Framework 2.0<br />
Microsoft Excel 2000 or greater<br />
Microsoft Internet Explorer 6.0 or greater<br />
Pentium 4 CPU, 2.0 GHz or greater<br />
At least 1 GB of available RAM<br />
<strong>Alarm</strong> <strong>Analytics</strong> Licensing Options<br />
<strong>Alarm</strong> <strong>Analytics</strong> comes in two configurations:<br />
• Standard: Includes 15 industry standard <strong>Alarm</strong> <strong>Analytics</strong> pre-configured templates,<br />
ReportWorX - Standard Edition and <strong>Alarm</strong>WorX32 - Unlimited.<br />
• Enterprise: Includes 15 industry standard <strong>Alarm</strong> <strong>Analytics</strong> pre-configured<br />
templates, ReportWorX - Enterprise Edition and <strong>Alarm</strong>WorX32 - Unlimited for the<br />
ability to create and run an unlimited number of custom, user defined, <strong>Alarm</strong><br />
<strong>Analytics</strong> reports.<br />
ICONICS <strong>Product</strong> <strong>Bulletin</strong><br />
Copyright © 2009 ICONICS, Inc.<br />
All Rights Reserved.<br />
Page 7 of 7<br />
February 2009<br />
ICO-PBB-007
About ICONICS<br />
ICONICS is a leading provider of award‐winning enterprise<br />
manufacturing intelligence and automation software<br />
solutions.<br />
ICONICS’ solutions deliver real‐time visibility into<br />
all enterprise operations and systems, helping<br />
companies to be more profitable, more agile, and<br />
more efficient. As a Microsoft Gold Certified<br />
Partner, ICONICS designs its solutions from the<br />
ground up to take maximum advantage of<br />
Microsoft .NET and SharePoint Portal Server<br />
technology, offering an unprecedented level of<br />
performance and ease of use.<br />
Our award‐winning GENESIS32 and new<br />
GENESIS64 automation software solutions can<br />
improve productivity, reduce integration and<br />
operating costs, and optimize your asset<br />
utilization, giving your organization a competitive<br />
edge. All ICONICS products are based on “open<br />
standards,” using OPC‐to‐the‐Core technology<br />
leveraging proven architecture and lower TCO of<br />
mainstream Microsoft platform, and connect to<br />
your existing infrastructure. We have more than<br />
225,000 applications running worldwide serving<br />
top manufacturing companies.<br />
ICONICS’ BizViz suite of products provides real‐time<br />
manufacturing intelligence from the production floor to<br />
the boardroom, turning real‐time information into your<br />
competitive advantage.<br />
WORLDWIDE OFFICES<br />
World Headquarters<br />
ICONICS, Inc.<br />
100 Foxborough Blvd.<br />
Foxborough, MA 02035 USA<br />
ph: 508‐543‐8600<br />
fx: 508‐543‐1503<br />
info@iconics.com<br />
Czech Republic<br />
ph: 420‐37‐718‐3420<br />
fx: 420‐37‐718‐3424<br />
czech@iconics.com<br />
France<br />
ph: 33‐045‐019‐1180<br />
fx: 33‐045‐001‐0870<br />
france@iconics.com<br />
Germany<br />
ph: 49‐224‐114‐82233<br />
fx: 49‐224‐114‐82686<br />
germany@iconics.com<br />
Italy<br />
ph: 39‐347‐819‐9250<br />
fx: 39‐010‐601‐4091<br />
italy@iconics.com<br />
Netherlands<br />
ph: 31‐252‐228‐588<br />
fx: 31‐252‐226‐240<br />
holland@iconics.com<br />
Australia<br />
ph: 61‐297‐273‐411<br />
fx: 61‐297‐273‐422<br />
australia@iconics.com<br />
China<br />
ph: 86‐130‐684‐86069<br />
china@iconics.com<br />
Hong Kong<br />
ph: 852‐21‐505‐797<br />
china@iconics.com<br />
United Kingdom<br />
ph: 44‐138‐427‐5500<br />
fx: 44‐138‐440‐1642<br />
info@iconics‐uk.com<br />
Next Generation in Automation Software Connect, Analyze & Visualize Manufacturing Intelligence<br />
© 2009 ICONICS, Inc. All rights reserved. Specifications are subject to change without notice. GENESIS32,<br />
GENESIS64, Pocket GENESIS, BizViz and their respective modules, OPC-To- The-Core, and Visualize Your Enterprise<br />
are trademarks of ICONICS Inc. Other product and company names mentioned herein may be trademarks of their<br />
respective owners. ICO-PBB-007