PGE Wireless Pneumatic Thermostat ET Final Report.pdf
PGE Wireless Pneumatic Thermostat ET Final Report.pdf
PGE Wireless Pneumatic Thermostat ET Final Report.pdf

Create successful ePaper yourself
Turn your PDF publications into a flip-book with our unique Google optimized e-Paper software.
PG&E’s Emerging Technologies Program <strong>ET</strong>11<strong>PGE</strong>3171<br />
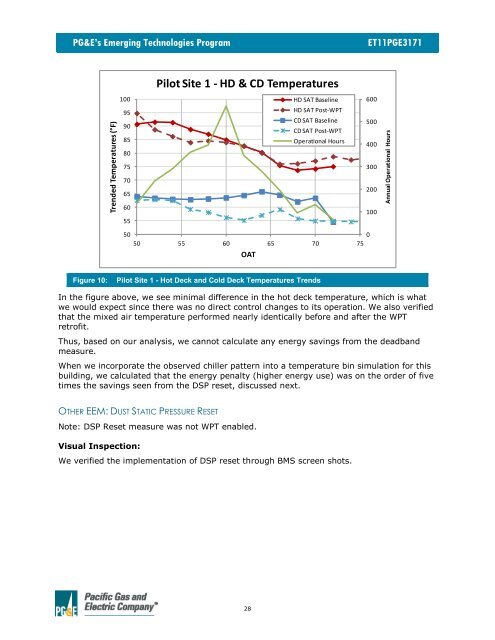
Figure 10: Pilot Site 1 - Hot Deck and Cold Deck Temperatures Trends<br />
In the figure above, we see minimal difference in the hot deck temperature, which is what<br />
we would expect since there was no direct control changes to its operation. We also verified<br />
that the mixed air temperature performed nearly identically before and after the WPT<br />
retrofit.<br />
Thus, based on our analysis, we cannot calculate any energy savings from the deadband<br />
measure.<br />
When we incorporate the observed chiller pattern into a temperature bin simulation for this<br />
building, we calculated that the energy penalty (higher energy use) was on the order of five<br />
times the savings seen from the DSP reset, discussed next.<br />
OTHER EEM: DUST STATIC PRESSURE RES<strong>ET</strong><br />
Note: DSP Reset measure was not WPT enabled.<br />
Visual Inspection:<br />
Trended Temperatures (°F)<br />
100<br />
95<br />
90<br />
85<br />
80<br />
75<br />
70<br />
65<br />
60<br />
55<br />
Pilot Site 1 - HD & CD Temperatures<br />
50<br />
0<br />
50 55 60 65 70 75<br />
OAT<br />
We verified the implementation of DSP reset through BMS screen shots.<br />
28<br />
HD SAT Baseline<br />
HD SAT Post-WPT<br />
CD SAT Baseline<br />
CD SAT Post-WPT<br />
Operational Hours<br />
600<br />
500<br />
400<br />
300<br />
200<br />
100<br />
Annual Operational Hours