PGE Wireless Pneumatic Thermostat ET Final Report.pdf
PGE Wireless Pneumatic Thermostat ET Final Report.pdf
PGE Wireless Pneumatic Thermostat ET Final Report.pdf
Create successful ePaper yourself
Turn your PDF publications into a flip-book with our unique Google optimized e-Paper software.
PG&E’s Emerging Technologies Program <strong>ET</strong>11<strong>PGE</strong>3171<br />
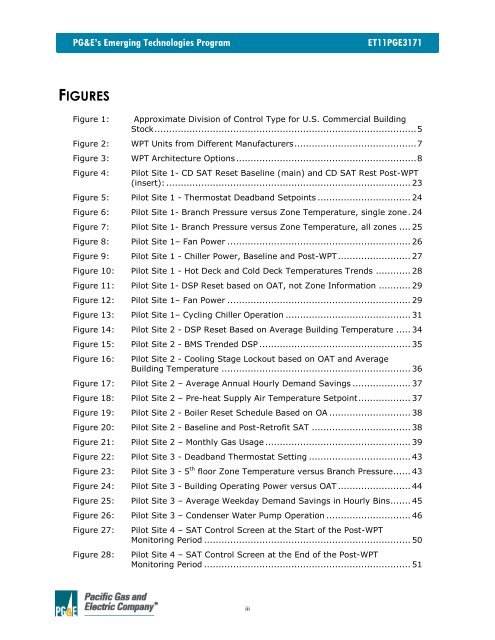
FIGURES<br />
Figure 1: Approximate Division of Control Type for U.S. Commercial Building<br />
Stock .......................................................................................... 5<br />
Figure 2: WPT Units from Different Manufacturers .......................................... 7<br />
Figure 3: WPT Architecture Options .............................................................. 8<br />
Figure 4: Pilot Site 1- CD SAT Reset Baseline (main) and CD SAT Rest Post-WPT<br />
(insert): .................................................................................... 23<br />
Figure 5: Pilot Site 1 - <strong>Thermostat</strong> Deadband Setpoints ................................ 24<br />
Figure 6: Pilot Site 1- Branch Pressure versus Zone Temperature, single zone . 24<br />
Figure 7: Pilot Site 1- Branch Pressure versus Zone Temperature, all zones .... 25<br />
Figure 8: Pilot Site 1– Fan Power ............................................................... 26<br />
Figure 9: Pilot Site 1 - Chiller Power, Baseline and Post-WPT ......................... 27<br />
Figure 10: Pilot Site 1 - Hot Deck and Cold Deck Temperatures Trends ............ 28<br />
Figure 11: Pilot Site 1- DSP Reset based on OAT, not Zone Information ........... 29<br />
Figure 12: Pilot Site 1– Fan Power ............................................................... 29<br />
Figure 13: Pilot Site 1– Cycling Chiller Operation ........................................... 31<br />
Figure 14: Pilot Site 2 - DSP Reset Based on Average Building Temperature ..... 34<br />
Figure 15: Pilot Site 2 - BMS Trended DSP .................................................... 35<br />
Figure 16: Pilot Site 2 - Cooling Stage Lockout based on OAT and Average<br />
Building Temperature ................................................................. 36<br />
Figure 17: Pilot Site 2 – Average Annual Hourly Demand Savings .................... 37<br />
Figure 18: Pilot Site 2 – Pre-heat Supply Air Temperature Setpoint .................. 37<br />
Figure 19: Pilot Site 2 - Boiler Reset Schedule Based on OA ............................ 38<br />
Figure 20: Pilot Site 2 - Baseline and Post-Retrofit SAT .................................. 38<br />
Figure 21: Pilot Site 2 – Monthly Gas Usage .................................................. 39<br />
Figure 22: Pilot Site 3 - Deadband <strong>Thermostat</strong> Setting ................................... 43<br />
Figure 23: Pilot Site 3 - 5 th floor Zone Temperature versus Branch Pressure ...... 43<br />
Figure 24: Pilot Site 3 - Building Operating Power versus OAT ......................... 44<br />
Figure 25: Pilot Site 3 – Average Weekday Demand Savings in Hourly Bins ....... 45<br />
Figure 26: Pilot Site 3 – Condenser Water Pump Operation ............................. 46<br />
Figure 27: Pilot Site 4 – SAT Control Screen at the Start of the Post-WPT<br />
Monitoring Period ....................................................................... 50<br />
Figure 28: Pilot Site 4 – SAT Control Screen at the End of the Post-WPT<br />
Monitoring Period ....................................................................... 51<br />
iii


