Structural reforms and macro-economic policy - ETUC
Structural reforms and macro-economic policy - ETUC
Structural reforms and macro-economic policy - ETUC

Create successful ePaper yourself
Turn your PDF publications into a flip-book with our unique Google optimized e-Paper software.
<strong>Structural</strong> <strong>reforms</strong> <strong>and</strong> <strong>macro</strong>-<strong>economic</strong> <strong>policy</strong><br />
/ 66<br />
2<br />
1<br />
0<br />
-2<br />
-2<br />
-9<br />
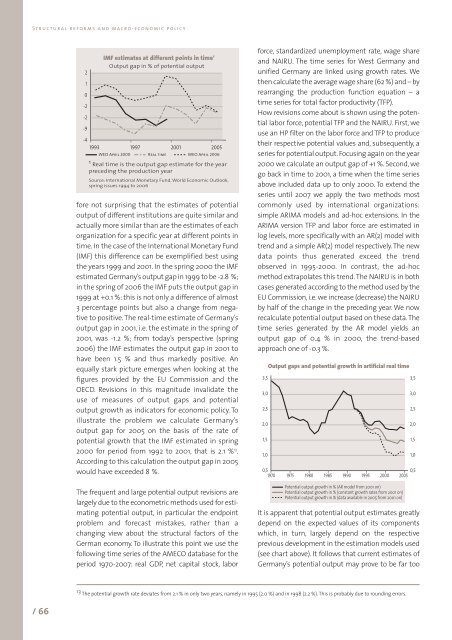
IMF estimates at different points in time<br />
Output gap in % of potential output<br />
1<br />
-4<br />
1993 1997 2001 2005<br />
WEO April 2000 Real time WEO April 2006<br />
1 Real time is the output gap estimate for the year<br />
preceding the production year<br />
Source: International Monetary Fund, World Economic Outlook,<br />
spring issues 1994 to 2006<br />
fore not surprising that the estimates of potential<br />
output of different institutions are quite similar <strong>and</strong><br />
actually more similar than are the estimates of each<br />
organization for a specific year at different points in<br />
time. In the case of the International Monetary Fund<br />
(IMF) this difference can be exemplified best using<br />
the years 1999 <strong>and</strong> 2001. In the spring 2000 the IMF<br />
estimated Germany’s output gap in 1999 to be -2.8 %;<br />
in the spring of 2006 the IMF puts the output gap in<br />
1999 at +0.1 %: this is not only a difference of almost<br />
3 percentage points but also a change from negative<br />
to positive. The real-time estimate of Germany’s<br />
output gap in 2001, i.e. the estimate in the spring of<br />
2001, was -1.2 %; from today’s perspective (spring<br />
2006) the IMF estimates the output gap in 2001 to<br />
have been 1.5 % <strong>and</strong> thus markedly positive. An<br />
equally stark picture emerges when looking at the<br />
figures provided by the EU Commission <strong>and</strong> the<br />
OECD. Revisions in this magnitude invalidate the<br />
use of measures of output gaps <strong>and</strong> potential<br />
output growth as indicators for <strong>economic</strong> <strong>policy</strong>. To<br />
illustrate the problem we calculate Germany’s<br />
output gap for 2005 on the basis of the rate of<br />
potential growth that the IMF estimated in spring<br />
2000 for period from 1992 to 2001, that is 2.1 % 13 .<br />
According to this calculation the output gap in 2005<br />
would have exceeded 8 %.<br />
The frequent <strong>and</strong> large potential output revisions are<br />
largely due to the econometric methods used for estimating<br />
potential output, in particular the endpoint<br />
problem <strong>and</strong> forecast mistakes, rather than a<br />
changing view about the structural factors of the<br />
German economy. To illustrate this point we use the<br />
following time series of the AMECO database for the<br />
period 1970-2007: real GDP, net capital stock, labor<br />
force, st<strong>and</strong>ardized unemployment rate, wage share<br />
<strong>and</strong> NAIRU. The time series for West Germany <strong>and</strong><br />
unified Germany are linked using growth rates. We<br />
then calculate the average wage share (62 %) <strong>and</strong> – by<br />
rearranging the production function equation – a<br />
time series for total factor productivity (TFP).<br />
How revisions come about is shown using the potential<br />
labor force, potential TFP <strong>and</strong> the NAIRU. First, we<br />
use an HP filter on the labor force <strong>and</strong> TFP to produce<br />
their respective potential values <strong>and</strong>, subsequently, a<br />
series for potential output. Focusing again on the year<br />
2000 we calculate an output gap of +1 %. Second, we<br />
go back in time to 2001, a time when the time series<br />
above included data up to only 2000. To extend the<br />
series until 2007 we apply the two methods most<br />
commonly used by international organizations:<br />
simple ARIMA models <strong>and</strong> ad-hoc extensions. In the<br />
ARIMA version TFP <strong>and</strong> labor force are estimated in<br />
log levels, more specifically with an AR(2) model with<br />
trend <strong>and</strong> a simple AR(2) model respectively. The new<br />
data points thus generated exceed the trend<br />
observed in 1995-2000. In contrast, the ad-hoc<br />
method extrapolates this trend. The NAIRU is in both<br />
cases generated according to the method used by the<br />
EU Commission, i.e. we increase (decrease) the NAIRU<br />
by half of the change in the preceding year. We now<br />
recalculate potential output based on these data. The<br />
time series generated by the AR model yields an<br />
output gap of 0.4 % in 2000, the trend-based<br />
approach one of -0.3 %.<br />
Output gaps <strong>and</strong> potential growth in artificial real time<br />
0,5<br />
0,5<br />
1970 1975 1980 1985 1990 1995 2000 2005<br />
It is apparent that potential output estimates greatly<br />
depend on the expected values of its components<br />
which, in turn, largely depend on the respective<br />
previous development in the estimation models used<br />
(see chart above). It follows that current estimates of<br />
Germany’s potential output may prove to be far too<br />
13 The potential growth rate deviates from 2.1 % in only two years, namely in 1995 (2.0 %) <strong>and</strong> in 1998 (2.2 %). This is probably due to rounding errors.<br />
3,5<br />
3,0<br />
2,5<br />
2,0<br />
1,5<br />
1,0<br />
Potential output growth in % (AR model from 2001 on)<br />
Potential output growth in % (constant growth rates from 2001 on)<br />
Potential output growth in % (data available in 2005 from 2001 on)<br />
3,5<br />
3,0<br />
2,5<br />
2,0<br />
1,5<br />
1,0