Occupation and cancer - European Trade Union Institute (ETUI)
Occupation and cancer - European Trade Union Institute (ETUI)
Occupation and cancer - European Trade Union Institute (ETUI)

You also want an ePaper? Increase the reach of your titles
YUMPU automatically turns print PDFs into web optimized ePapers that Google loves.
Acta Oncol Downloaded from informahealthcare.com by 212.35.100.66 on 04/06/11<br />
For personal use only.<br />
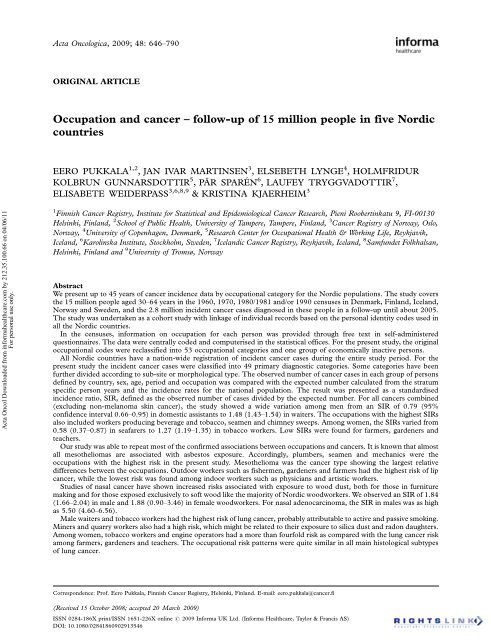
Acta Oncologica, 2009; 48: 646 790<br />
ORIGINAL ARTICLE<br />
<strong>Occupation</strong> <strong>and</strong> <strong>cancer</strong> follow-up of 15 million people in five Nordic<br />
countries<br />
EERO PUKKALA 1,2 , JAN IVAR MARTINSEN 3 , ELSEBETH LYNGE 4 , HOLMFRIDUR<br />
KOLBRUN GUNNARSDOTTIR 5 ,PÄR SPARÉN 6 , LAUFEY TRYGGVADOTTIR 7 ,<br />
ELISABETE WEIDERPASS 3,6,8,9 & KRISTINA KJAERHEIM 3<br />
1 Finnish Cancer Registry, <strong>Institute</strong> for Statistical <strong>and</strong> Epidemiological Cancer Research, Pieni Roobertinkatu 9, FI-00130<br />
Helsinki, Finl<strong>and</strong>, 2 School of Public Health, University of Tampere, Tampere, Finl<strong>and</strong>, 3 Cancer Registry of Norway, Oslo,<br />
Norway, 4 University of Copenhagen, Denmark, 5 Research Center for <strong>Occupation</strong>al Health & Working Life, Reykjavik,<br />
Icel<strong>and</strong>, 6 Karolinska <strong>Institute</strong>, Stockholm, Sweden, 7 Icel<strong>and</strong>ic Cancer Registry, Reykjavik, Icel<strong>and</strong>, 8 Samfundet Folkhalsan,<br />
Helsinki, Finl<strong>and</strong> <strong>and</strong> 9 University of Tromsø, Norway<br />
Abstract<br />
We present up to 45 years of <strong>cancer</strong> incidence data by occupational category for the Nordic populations. The study covers<br />
the 15 million people aged 30 64 years in the 1960, 1970, 1980/1981 <strong>and</strong>/or 1990 censuses in Denmark, Finl<strong>and</strong>, Icel<strong>and</strong>,<br />
Norway <strong>and</strong> Sweden, <strong>and</strong> the 2.8 million incident <strong>cancer</strong> cases diagnosed in these people in a follow-up until about 2005.<br />
The study was undertaken as a cohort study with linkage of individual records based on the personal identity codes used in<br />
all the Nordic countries.<br />
In the censuses, information on occupation for each person was provided through free text in self-administered<br />
questionnaires. The data were centrally coded <strong>and</strong> computerised in the statistical offices. For the present study, the original<br />
occupational codes were reclassified into 53 occupational categories <strong>and</strong> one group of economically inactive persons.<br />
All Nordic countries have a nation-wide registration of incident <strong>cancer</strong> cases during the entire study period. For the<br />
present study the incident <strong>cancer</strong> cases were classified into 49 primary diagnostic categories. Some categories have been<br />
further divided according to sub-site or morphological type. The observed number of <strong>cancer</strong> cases in each group of persons<br />
defined by country, sex, age, period <strong>and</strong> occupation was compared with the expected number calculated from the stratum<br />
specific person years <strong>and</strong> the incidence rates for the national population. The result was presented as a st<strong>and</strong>ardised<br />
incidence ratio, SIR, defined as the observed number of cases divided by the expected number. For all <strong>cancer</strong>s combined<br />
(excluding non-melanoma skin <strong>cancer</strong>), the study showed a wide variation among men from an SIR of 0.79 (95%<br />
confidence interval 0.66 0.95) in domestic assistants to 1.48 (1.43 1.54) in waiters. The occupations with the highest SIRs<br />
also included workers producing beverage <strong>and</strong> tobacco, seamen <strong>and</strong> chimney sweeps. Among women, the SIRs varied from<br />
0.58 (0.37 0.87) in seafarers to 1.27 (1.19 1.35) in tobacco workers. Low SIRs were found for farmers, gardeners <strong>and</strong><br />
teachers.<br />
Our study was able to repeat most of the confirmed associations between occupations <strong>and</strong> <strong>cancer</strong>s. It is known that almost<br />
all mesotheliomas are associated with asbestos exposure. Accordingly, plumbers, seamen <strong>and</strong> mechanics were the<br />
occupations with the highest risk in the present study. Mesothelioma was the <strong>cancer</strong> type showing the largest relative<br />
differences between the occupations. Outdoor workers such as fishermen, gardeners <strong>and</strong> farmers had the highest risk of lip<br />
<strong>cancer</strong>, while the lowest risk was found among indoor workers such as physicians <strong>and</strong> artistic workers.<br />
Studies of nasal <strong>cancer</strong> have shown increased risks associated with exposure to wood dust, both for those in furniture<br />
making <strong>and</strong> for those exposed exclusively to soft wood like the majority of Nordic woodworkers. We observed an SIR of 1.84<br />
(1.66 2.04) in male <strong>and</strong> 1.88 (0.90 3.46) in female woodworkers. For nasal adenocarcinoma, the SIR in males was as high<br />
as 5.50 (4.60 6.56).<br />
Male waiters <strong>and</strong> tobacco workers had the highest risk of lung <strong>cancer</strong>, probably attributable to active <strong>and</strong> passive smoking.<br />
Miners <strong>and</strong> quarry workers also had a high risk, which might be related to their exposure to silica dust <strong>and</strong> radon daughters.<br />
Among women, tobacco workers <strong>and</strong> engine operators had a more than fourfold risk as compared with the lung <strong>cancer</strong> risk<br />
among farmers, gardeners <strong>and</strong> teachers. The occupational risk patterns were quite similar in all main histological subtypes<br />
of lung <strong>cancer</strong>.<br />
Correspondence: Prof. Eero Pukkala, Finnish Cancer Registry, Helsinki, Finl<strong>and</strong>. E-mail: eero.pukkala@<strong>cancer</strong>.fi<br />
(Received 15 October 2008; accepted 20 March 2009)<br />
ISSN 0284-186X print/ISSN 1651-226X online # 2009 Informa UK Ltd. (Informa Healthcare, Taylor & Francis AS)<br />
DOI: 10.1080/02841860902913546
Acta Oncol Downloaded from informahealthcare.com by 212.35.100.66 on 04/06/11<br />
For personal use only.<br />
Bladder <strong>cancer</strong> is considered as one of the <strong>cancer</strong> types most likely to be related to occupational carcinogens. Waiters had<br />
the highest risk of bladder <strong>cancer</strong> in men <strong>and</strong> tobacco workers in women, <strong>and</strong> the low-risk categories were the same ones as<br />
for lung <strong>cancer</strong>. All this can be accounted for by smoking. The second-highest SIRs were among chimney sweeps <strong>and</strong><br />
hairdressers. Chimney sweeps are exposed to carcinogens such as polycyclic aromatic hydrocarbons from the chimney soot,<br />
<strong>and</strong> hairdressers’ work environment is also rich in chemical agents.<br />
Exposure to the known hepatocarcinogens, the Hepatitis B virus <strong>and</strong> aflatoxin, is rare in the Nordic countries, <strong>and</strong> a large<br />
proportion of primary liver <strong>cancer</strong>s can therefore be attributed to alcohol consumption. The highest risks of liver <strong>cancer</strong><br />
were seen in occupational categories with easy access to alcohol at the work place or with cultural traditions of high alcohol<br />
consumption, such as waiters, cooks, beverage workers, journalists <strong>and</strong> seamen.<br />
The risk of colon <strong>cancer</strong> has been related to sedentary work. The findings in the present study did not strongly indicate<br />
any protective role of physical activity. Colon <strong>cancer</strong> was one of the <strong>cancer</strong> types showing the smallest relative variation in<br />
incidence between occupational categories. The occupational variation in the risk of female breast <strong>cancer</strong> (the most<br />
common <strong>cancer</strong> type in the present series, 373 361 cases) was larger, <strong>and</strong> there was a tendency of physically dem<strong>and</strong>ing<br />
occupations to show SIRs below unity. Women in occupations which require a high level of education have, on average, a<br />
higher age at first child-birth <strong>and</strong> elevated breast <strong>cancer</strong> incidence. Women in occupational categories with the highest<br />
average number of children had markedly lower incidence. In male breast <strong>cancer</strong> (2 336 cases), which is not affected by the<br />
dominating reproductive factors, there was a suggestion of an increase in risk in occupations characterised by shift work.<br />
Night-shift work was recently classified as probably carcinogenic, with human evidence based on breast <strong>cancer</strong> research.<br />
The most common <strong>cancer</strong> among men in the present cohort was prostate <strong>cancer</strong> (339 973 cases). Despite the huge<br />
number of cases, we were unable to demonstrate any occupation-related risks. The observed small occupational variation<br />
could be easily explained by varying PSA test frequency.<br />
The Nordic countries are known for equity <strong>and</strong> free <strong>and</strong> equal access to health care for all citizens. The present study<br />
shows that the risk of <strong>cancer</strong>, even under these circumstances, is highly dependent on the person’s position in the society.<br />
Direct occupational hazards seem to explain only a small percentage of the observed variation but still a large number of<br />
cases while indirect factors such as life style changes related to longer education <strong>and</strong> decreasing physical activity become<br />
more important.<br />
This publication is the first one from the extensive Nordic <strong>Occupation</strong>al Cancer (NOCCA) project. Subsequent studies<br />
will focus on associations between specific work-related factors <strong>and</strong> <strong>cancer</strong> diseases with the aim to identify exposureresponse<br />
patterns. In addition to the <strong>cancer</strong> data demonstrated in the present publication, the NOCCA project produced<br />
Nordic Job Exposure Matrix (described in separate articles in this issue of Acta Oncologica) that transforms information<br />
about occupational title histories to quantitative estimates of specific exposures. The third essential component is<br />
methodological development related to analysis <strong>and</strong> interpretation of results based on averaged information of exposures<br />
<strong>and</strong> co-factors in the occupational categories.<br />
Abbreviations: CI, Confidence Interval, ICD, International Classification of Diseases, ICD-O, International<br />
Classification of Diseases for Oncology, ISCO, International St<strong>and</strong>ard Classification of <strong>Occupation</strong>, NYK,<br />
Nordisk Yrkesklassifisering (Nordic Classification of <strong>Occupation</strong>), PY, Person years, Obs, Observed number of<br />
<strong>cancer</strong> cases, SIR, St<strong>and</strong>ardised Incidence Ratio, NHL, Non-Hodgkin’s lymphoma<br />
Introduction<br />
A study published in 1999 reported occupational<br />
<strong>cancer</strong> risk estimates in four Nordic countries based<br />
on data from the 1970 censuses in Denmark, Finl<strong>and</strong>,<br />
Norway <strong>and</strong> Sweden, <strong>and</strong> a subsequent followup<br />
of <strong>cancer</strong> incidence of 20 years [1]. Those data<br />
have been extensively used in both Nordic <strong>and</strong><br />
international contexts, <strong>and</strong> there was an evident<br />
need to update <strong>and</strong> extend the results. In addition,<br />
a need has been expressed to develop analytic<br />
approaches to utilise the data, which is unique both<br />
in terms of size <strong>and</strong> accuracy, for tracing exposureresponse<br />
associations between work-related variables<br />
<strong>and</strong> <strong>cancer</strong>. That was the reason to start the Nordic<br />
<strong>Occupation</strong>al Cancer (NOCCA) project which aims<br />
at joining the Nordic data <strong>and</strong> researcher skills<br />
(http://www.<strong>cancer</strong>registry.fi/eng/research/AID159.<br />
html). As the first output of the NOCCA project, we<br />
present here a study similar to the previous Nordic<br />
study [1] but updated <strong>and</strong> extended in several<br />
dimensions.<br />
<strong>Occupation</strong> <strong>and</strong> <strong>cancer</strong> in Nordic countries 647<br />
Tabulation of <strong>cancer</strong> by occupational categories<br />
builds on tradition from the occupational mortality<br />
studies, <strong>and</strong> therefore also the term ‘‘occupational<br />
<strong>cancer</strong>’’ is often used in studies where the information<br />
on occupation <strong>and</strong> industry comes from the data<br />
collected for each citizen in a census. To ensure<br />
correspondence between numerator <strong>and</strong> denominator,<br />
these studies should preferably be based on<br />
linkage between individual census <strong>and</strong> <strong>cancer</strong> registration<br />
records. The use of unique personal identity<br />
codes given to all residents <strong>and</strong> systematically recorded<br />
in every register including personal data<br />
facilitates such a record linkage in the most accurate<br />
way. In the Nordic countries personal identity codes<br />
have been widely used since the 1960s for administrative<br />
purposes such as payment of salaries, taxation,<br />
bank accounts, social security, health insurance,<br />
hospitalisation, etc. The use of the personal identity<br />
codes is thus a part of daily life ensuring a high quality<br />
of the data. All five countries have computerised<br />
central population registers with daily updates on<br />
births, deaths, immigrations <strong>and</strong> emigrations.
Acta Oncol Downloaded from informahealthcare.com by 212.35.100.66 on 04/06/11<br />
For personal use only.<br />
648 E. Pukkala et al.<br />
The computerised registration of census data by<br />
personal identity codes started in Norway <strong>and</strong><br />
Sweden in 1960, in Finl<strong>and</strong> <strong>and</strong> Denmark in 1970,<br />
<strong>and</strong> in Icel<strong>and</strong> in 1981. Because central administrative<br />
registers also include much demographic<br />
information, the incentive to undertake traditional<br />
censuses has diminished by time. The detailed<br />
information on occupation <strong>and</strong> industry for each<br />
citizen is, however, difficult to obtain from routine<br />
registers. Denmark was the first country in the world<br />
to abolish traditional censuses. In the first registerbased<br />
census in Denmark from 1981 the information<br />
on occupation came primarily from tax-forms,<br />
<strong>and</strong> 5% of the work force ended up being registered<br />
only as wage-earners without further information<br />
[2]. The Danish part of the present study is therefore<br />
based solely on the 1970 census. Sweden kept the<br />
traditional censuses throughout the 20th century,<br />
<strong>and</strong> the present study includes data from the 1960,<br />
1970, 1980, <strong>and</strong> 1990 censuses. In Finl<strong>and</strong>, data<br />
from the 1960 census only exists in manual forms<br />
<strong>and</strong> could not be used, <strong>and</strong> in Norway the 1990<br />
census included only a sample of the Norwegian<br />
population <strong>and</strong> was therefore excluded from the<br />
present study. Icel<strong>and</strong> has a long census tradition,<br />
but the only census available with computerised data<br />
is from 1981.<br />
National <strong>cancer</strong> registration started in 1943 in<br />
Denmark, in 1953 in Finl<strong>and</strong> <strong>and</strong> Norway, in<br />
1955 in Icel<strong>and</strong>, <strong>and</strong> in 1958 in Sweden. The first<br />
linkage study of occupational <strong>cancer</strong> was based<br />
on the 1960 census from Sweden, with the creation<br />
of the so-called Cancer-Environment Register [3].<br />
A linkage has also been performed between the<br />
Swedish 1970 census <strong>and</strong> the <strong>cancer</strong> register [4].<br />
Comprehensive studies on occupational <strong>cancer</strong><br />
based on data from the 1970 censuses have been<br />
published in Denmark [5] <strong>and</strong> Finl<strong>and</strong> [6]. In<br />
Norway, studies for selected occupational categories<br />
have been undertaken based on the 1970 census<br />
[7,8]. This is the first time the Icel<strong>and</strong>ic census is<br />
used as a study base.<br />
The st<strong>and</strong>ardisation of occupations for the present<br />
studies was facilitated by the previous Nordic<br />
collaborative projects on occupational <strong>cancer</strong> mortality<br />
[9] <strong>and</strong> incidence [1].<br />
The occupational <strong>cancer</strong> study presented here<br />
includes 1) data from five Nordic countries, 2)<br />
data from up to four consecutive decennial censuses,<br />
3) data for main <strong>cancer</strong> sites, as well as for several<br />
specific histological categories <strong>and</strong> subsites, <strong>and</strong> for a<br />
number of rare <strong>cancer</strong> sites seldom studied by<br />
occupation, <strong>and</strong> 4) data from a follow-up period of<br />
up to 45 years (1961 2005). The study cohort<br />
covers 15 million residents of Nordic countries,<br />
followed for a total of 385 million person years,<br />
<strong>and</strong> developing 2.8 million <strong>cancer</strong> cases during the<br />
follow-up. It thus constitutes the largest cohort study<br />
on occupational <strong>cancer</strong> incidence ever published.<br />
This is the first publication to come out from<br />
the extensive study Nordic <strong>Occupation</strong>al Cancer<br />
(NOCCA) project <strong>and</strong> should be considered as a<br />
base document for the numerous subsequent studies<br />
focusing on associations between specific workrelated<br />
factors <strong>and</strong> well-defined <strong>cancer</strong> diseases<br />
with the aim to identify exposure-response patterns.<br />
In addition to the <strong>cancer</strong> data demonstrated in the<br />
present publication, the NOCCA project produces<br />
the Nordic Job Exposure Matrix (JEM) that transforms<br />
information of occupational title histories to<br />
quantitative estimates of specific exposures. The<br />
third essential component is methodological development<br />
targeted at better interpretation of results<br />
based on averaged information of exposures <strong>and</strong> cofactors<br />
in the occupational categories. The JEM<br />
work is described in a separate article in this issue of<br />
Acta Oncologica.<br />
The Nordic countries<br />
The Nordic countries comprise five states: Denmark,<br />
Finl<strong>and</strong>, Icel<strong>and</strong>, Norway <strong>and</strong> Sweden, <strong>and</strong><br />
three autonomous territories, the Faroe Isl<strong>and</strong>s,<br />
Greenl<strong>and</strong> <strong>and</strong> A˚ l<strong>and</strong>. The Faroe Isl<strong>and</strong>s <strong>and</strong><br />
Greenl<strong>and</strong> are both part of the kingdom of Denmark,<br />
but are not included in the present study.<br />
A˚ l<strong>and</strong> is part of the republic of Finl<strong>and</strong>, <strong>and</strong> is<br />
included in the Finnish data. Denmark, Norway<br />
<strong>and</strong> Sweden are monarchies whereas Finl<strong>and</strong> <strong>and</strong><br />
Icel<strong>and</strong> are republics.<br />
The Nordic countries share a long history. Icel<strong>and</strong><br />
came under the Norwegian king in 1262. The<br />
three kingdoms of Denmark, Norway <strong>and</strong> Sweden<br />
(including Finl<strong>and</strong>), dating back to the 10 13th<br />
centuries, were united in the Kalmar <strong>Union</strong> in 1397.<br />
After Sweden had broken out in 1523, Denmark <strong>and</strong><br />
Norway were in a political union, including also<br />
the Norwegian dependencies of Icel<strong>and</strong>, the Faroe<br />
Isl<strong>and</strong>s, <strong>and</strong> Greenl<strong>and</strong>. This Dano-Norwegian<br />
union was dissolved in 1814. Norway then entered<br />
a union with Sweden, while Icel<strong>and</strong>, the Faroe<br />
Isl<strong>and</strong>s, <strong>and</strong> Greenl<strong>and</strong> remained with Denmark.<br />
The Swedish-Norwegian union was dissolved in<br />
1905. Finl<strong>and</strong>, formerly constituting the eastern<br />
third of Sweden, in 1809 became an autonomous<br />
Gr<strong>and</strong> Duchy within the Russian Empire, but<br />
declared its independence in 1917. Icel<strong>and</strong> was until<br />
1944 part of the Danish monarchy. The Faroe<br />
Isl<strong>and</strong>s <strong>and</strong> Greenl<strong>and</strong> are today autonomous provinces<br />
of Denmark with home rule. Denmark joined<br />
the <strong>European</strong> <strong>Union</strong> in 1973, Finl<strong>and</strong> <strong>and</strong> Sweden<br />
in 1995. Icel<strong>and</strong> <strong>and</strong> Norway are not EU members.
Acta Oncol Downloaded from informahealthcare.com by 212.35.100.66 on 04/06/11<br />
For personal use only.<br />
In the Second World War (WWII), Norway <strong>and</strong><br />
Finl<strong>and</strong> were combat zones, while the other Nordic<br />
countries did not participate directly in the warfare.<br />
The living conditions in Norway <strong>and</strong> Finl<strong>and</strong> were<br />
thus heavily affected by the war, whereas this was<br />
not the case to the same extent in the other<br />
countries. Norway <strong>and</strong> Denmark were occupied by<br />
the Germans. Finl<strong>and</strong> fought the Winter War <strong>and</strong><br />
the continuation war against the Soviet <strong>Union</strong>.<br />
Icel<strong>and</strong> was occupied by Great Britain in May of<br />
1940 (a friendly occupation) but one year later made<br />
a defense agreement with USA. Sweden kept its<br />
neutrality.<br />
The Nordic countries cover a total area of<br />
3.5 million km 2 . If Greenl<strong>and</strong> <strong>and</strong> the isl<strong>and</strong>s of<br />
Svalbard <strong>and</strong> Jan Mayen are excluded, the remaining<br />
part of the Nordic countries covers an area of 1.2<br />
million km 2 . The northernmost parts of Norway,<br />
Finl<strong>and</strong>, <strong>and</strong> Sweden are located north of the<br />
Arctic Circle, <strong>and</strong> thus experience winter without<br />
sunrise <strong>and</strong> midnight sun in summertime. This<br />
area is sparsely populated. Denmark <strong>and</strong> Finl<strong>and</strong><br />
are flat countries, whereas mountainous areas are<br />
found in the central <strong>and</strong> northern parts of Norway<br />
<strong>and</strong> in the northern part of Sweden. Icel<strong>and</strong> is a<br />
mountainous isl<strong>and</strong> situated in the North Atlantic<br />
with glaciers, volcanoes, <strong>and</strong> geothermal activity.<br />
Climate<br />
The climate in the Nordic countries is determined<br />
by two factors, their northern latitude <strong>and</strong> the<br />
existence of the Gulf Stream in the Atlantic Ocean.<br />
The climate is temperate but with variation between<br />
the southern <strong>and</strong> northern parts <strong>and</strong> between the<br />
coastal <strong>and</strong> inl<strong>and</strong> areas. During winter, average<br />
temperatures are fairly low. The five capitals,<br />
Copenhagen, Helsinki, Reykjavik, Oslo, <strong>and</strong><br />
Stockholm, are all located by the sea, which reduces<br />
the temperature variation (Table 1) [10].<br />
Annual exposure to carcinogenic UV light at<br />
sea level in the southernmost regions of the Nordic<br />
countries (southern Denmark, latitude 558N) is<br />
about 30% <strong>and</strong> in the northernmost parts of<br />
the other Nordic countries (latitude about 708N)<br />
Table 1. Mean temperature in five Nordic capitals in the years<br />
1961 1990 [10].<br />
January July<br />
Helsinki 6.9 16.6<br />
Copenhagen 0.1 16.4<br />
Oslo 4.3 16.4<br />
Reykjavik 0.5 10.6<br />
Stocholm 2.8 17.2<br />
approximately 20% of the respective exposure at<br />
equator [11].<br />
Population<br />
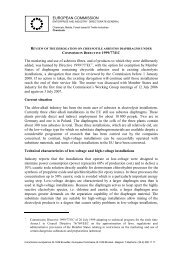
The total population in the Nordic countries has<br />
doubled during the last hundred years, comprising<br />
24.7 million in 2005 (Figure 1) [12]. The population<br />
density varies from 127 per km 2 in Denmark to 3 per<br />
km 2 , in Icel<strong>and</strong>. In Norway <strong>and</strong> Denmark around<br />
30 40% <strong>and</strong> in Icel<strong>and</strong> more than 60% of the<br />
population live in the vicinity of the capital [13].<br />
The population in the Nordic countries is getting<br />
older, partly due to the fact that the death rate has<br />
fallen for almost all age groups <strong>and</strong> partly because<br />
the number of births has been low over the past<br />
30 years. As of the year 2005, the percentage of<br />
80 years or older was highest (over 5%) in Sweden.<br />
The fertility rate has fallen in all the Nordic<br />
countries but is still relatively high compared<br />
to most industrialised countries [14]. From 1970<br />
to 2004, the fertility rate among women 15 49<br />
years in Denmark decreased from 1.95 to 1.78; in<br />
Finl<strong>and</strong> from 1.83 to 1.80; in Icel<strong>and</strong> from 2.81 to<br />
2.04; in Norway from 2.50 to 1.83; <strong>and</strong> in Sweden<br />
from 1.92 to 1.75.<br />
A great majority of people in the five Nordic<br />
countries are Caucasian. Following WWII Sweden<br />
experienced labour immigration from Central <strong>and</strong><br />
Western <strong>European</strong> countries, in addition to immigration<br />
from the other Nordic countries. From 1954<br />
there has been a completely common labour market<br />
between the Nordic countries. However, apart from<br />
a substantial movement from Finl<strong>and</strong> to Sweden,<br />
this did not significantly influence the labour markets<br />
in the individual countries. Labour immigration<br />
from Southern Europe <strong>and</strong> outside Europe started<br />
in Sweden from the early 1960s, <strong>and</strong> came to<br />
Denmark <strong>and</strong> Norway by the late 1960s. From the<br />
Population in millions<br />
10<br />
8<br />
6<br />
4<br />
2<br />
0<br />
<strong>Occupation</strong> <strong>and</strong> <strong>cancer</strong> in Nordic countries 649<br />
1890<br />
Denmark<br />
Finl<strong>and</strong><br />
Icel<strong>and</strong><br />
Norway<br />
Sweden<br />
1900<br />
1910<br />
1920<br />
1930<br />
1940<br />
1950<br />
Year<br />
Figure 1. Population in the Nordic countries in 1890 2005, in<br />
millions [12].<br />
1960<br />
1970<br />
1980<br />
1990<br />
2000<br />
2010
Acta Oncol Downloaded from informahealthcare.com by 212.35.100.66 on 04/06/11<br />
For personal use only.<br />
650 E. Pukkala et al.<br />
Immigrants<br />
60 000<br />
40 000<br />
20 000<br />
0<br />
Denmark Finl<strong>and</strong> Icel<strong>and</strong> Norway Sweden<br />
1990 2004<br />
Figure 2. Number of immigrants to the Nordic countries [13].<br />
early 1970s immigration from countries outside the<br />
Nordic common market was stopped, only allowing<br />
family reunions. By joining the <strong>European</strong> <strong>Union</strong><br />
Denmark in 1973 <strong>and</strong> Sweden <strong>and</strong> Finl<strong>and</strong> in 1995<br />
became part of the joint <strong>European</strong> labour market. In<br />
general, labour immigration has been mainly from<br />
Western countries, while refugee <strong>and</strong> family related<br />
immigration has been mainly from non-Western<br />
countries [15].<br />
Culture<br />
The Danish, Icel<strong>and</strong>ic, Norwegian <strong>and</strong> Swedish<br />
languages are of the same origin whereas Finnish<br />
belongs to an entirely different language family.<br />
About 6% of the Finnish population have Swedish<br />
as their mother tongue, <strong>and</strong> both Finnish <strong>and</strong><br />
Swedish are official languages in Finl<strong>and</strong>. The<br />
Sami people are indigenous people living in the<br />
northern parts of Finl<strong>and</strong>, Norway, Sweden <strong>and</strong><br />
Russia. They speak Sami languages.<br />
Elementary schools have been compulsory in<br />
all Nordic countries for more than a century. In<br />
Denmark, schooling has been compulsory since<br />
1814. In Sweden, six years of schooling was made<br />
m<strong>and</strong>atory in 1882, in Norway, seven years has been<br />
m<strong>and</strong>atory since 1889. Today, 9 10 years of schooling<br />
is compulsory in all countries, after which most<br />
students will pursue some form of further training.<br />
The number of students finishing higher education<br />
increased very much during the second half of the<br />
20th century. In Denmark, Norway <strong>and</strong> Sweden,<br />
13% <strong>and</strong> in Finl<strong>and</strong> 8% of men aged 35 54 years in<br />
1970, had 13 or more years of education. The<br />
respective proportions for women were 10% in<br />
Sweden; 7% in Finl<strong>and</strong>; 6% in Norway <strong>and</strong> 5% in<br />
Denmark [16]. In Icel<strong>and</strong> 15% of all 20-year-olds<br />
passed the matriculation examination in the school<br />
year 1970/1971, whereas 29% <strong>and</strong> 45% passed this<br />
examination in the years 1980/1981 <strong>and</strong> 1989/1990,<br />
respectively [17]. The percentage of people with<br />
a tertiary level education according to the International<br />
St<strong>and</strong>ard Classification of Education, which<br />
typically begins at the end of full time compulsory<br />
education, varied in 2003 2004 from 20% in<br />
Denmark to 26% in Finl<strong>and</strong> among persons<br />
between the ages of 15 <strong>and</strong> 74. In the five countries,<br />
more women than men now have the highest level<br />
of education in the population of those aged 25 74,<br />
<strong>and</strong> more women are enrolled in high-level education<br />
institutions than men [13]. The number of<br />
doctoral <strong>and</strong> licentiate degrees awarded each year is<br />
growing fast. In 1990 the total number of doctoral<br />
degrees awarded in the Nordic countries was about<br />
3 400, but in 2002 the number exceeded 7 100 [18].<br />
In all five Nordic countries a vast majority of the<br />
population are Lutherans. In Finl<strong>and</strong>, the Orthodox<br />
church (1% of the population) also has the<br />
status of state church. However, full freedom of<br />
religion is granted by the constitutions of the five<br />
countries. The extent to which religion plays a role<br />
in daily life varies between groups <strong>and</strong> regions,<br />
but has in general been decreasing by time. The<br />
Nordic countries are now confronting new challenges<br />
with immigrants that are followers of various<br />
religions [19].<br />
Industry<br />
Agriculture is still important in most Nordic countries,<br />
although its economic significance has declined<br />
in parallel with the increase of the service sector, as<br />
has been the case in most other <strong>European</strong> countries.<br />
In Denmark <strong>and</strong> Finl<strong>and</strong>, more than half of the<br />
arable l<strong>and</strong> is used for grain production, in Denmark<br />
65%, in Finl<strong>and</strong> 55% but in Sweden 42%. Icel<strong>and</strong>,<br />
being mountainous <strong>and</strong> volcanic has scarce arable<br />
l<strong>and</strong>. The main agricultural activity in Icel<strong>and</strong> is<br />
sheep farming <strong>and</strong> dairy production. The importance<br />
of forestry <strong>and</strong> paper production is illustrated<br />
by the fact that more than half of the area in Sweden<br />
<strong>and</strong> Finl<strong>and</strong>, <strong>and</strong> one fourth of the area in Norway<br />
are covered by forest. Forestry is still a major<br />
industry in Finl<strong>and</strong> <strong>and</strong> Sweden <strong>and</strong> to a lesser<br />
extent in Norway. Fishing has for a long time been<br />
an important industry in Norway <strong>and</strong> in Icel<strong>and</strong> <strong>and</strong><br />
still is, especially in certain regions. Oil production<br />
by the Norwegians in the North Sea started on a<br />
larger scale in the mid 1970s.<br />
Hydro- <strong>and</strong> geothermal power are major sources<br />
of energy in the Nordic countries, as compared to<br />
other OECD countries. In Icel<strong>and</strong> <strong>and</strong> Norway<br />
hydro-geothermal power constitute a major share<br />
of the overall energy supply, whereas Denmark<br />
depends almost entirely on thermal power generated<br />
from coal, oil <strong>and</strong> gas. Icel<strong>and</strong> depends almost
Acta Oncol Downloaded from informahealthcare.com by 212.35.100.66 on 04/06/11<br />
For personal use only.<br />
Tons<br />
20<br />
15<br />
10<br />
5<br />
0<br />
Denmark Finl<strong>and</strong> Icel<strong>and</strong><br />
Norway Sweden<br />
Figure 3. CO 2 emission in tons per capita in the Nordic countries<br />
in 2004 [20].<br />
entirely upon hydropower resources for its production<br />
of electricity. Nuclear power is Sweden’s most<br />
important source of energy, in Finl<strong>and</strong> it provides<br />
18% of the energy supply. With their oil fields in the<br />
North Sea, Denmark <strong>and</strong> especially Norway have a<br />
very large production of oil <strong>and</strong> gas [13]. Iron<br />
mining has been important in Sweden <strong>and</strong> to a<br />
lesser extent in Norway, where on the other h<strong>and</strong>,<br />
the cheap supply of energy has formed the basis for,<br />
e.g., the smelting of aluminium, both in Norway [1]<br />
<strong>and</strong> in Icel<strong>and</strong>.<br />
In agreement with the Kyoto Protocol, EU nations<br />
have agreed to cut the emission of carbon dioxide to<br />
8% below the level in 1990. Emission of carbon<br />
dioxide varies across the Nordic countries (Figure 3)<br />
[20]. In Denmark, Finl<strong>and</strong> <strong>and</strong> Norway, the emission<br />
of greenhouse-gases in 2003 was still 7 8%<br />
above the 1990 level while the emission was lower in<br />
Sweden <strong>and</strong> especially in Icel<strong>and</strong> [13].<br />
Living conditions<br />
The gross domestic product has increased in all<br />
Nordic countries <strong>and</strong> is among the highest in the<br />
world. The population of the Nordic countries<br />
is now largely urbanised. The share of one- <strong>and</strong><br />
two-family houses out of the entire building stock<br />
is highest in Denmark (almost 60%) <strong>and</strong> A˚ l<strong>and</strong><br />
(almost 70%), lowest in Sweden with 45%. Norway<br />
<strong>and</strong> Icel<strong>and</strong> have the highest percentage of large<br />
dwellings with five rooms or more plus kitchen [13].<br />
Private ownership of dwellings is common.<br />
In 1970 Sweden had the highest number per<br />
capita of cars (0.31), telephones (0.58) <strong>and</strong> televisions<br />
(0.32) in the Nordic countries. In Finl<strong>and</strong> the<br />
numbers were only 0.19; 0.30 <strong>and</strong> 0.24 [21]. In<br />
2005 Icel<strong>and</strong> had the highest density of private cars<br />
with 0.60 cars per capita, followed by Sweden with<br />
<strong>Occupation</strong> <strong>and</strong> <strong>cancer</strong> in Nordic countries 651<br />
0.46, Finl<strong>and</strong> 0.45, Norway 0.43, <strong>and</strong> Denmark<br />
0.35 per capita [13].<br />
Along with the Netherl<strong>and</strong>s, the Nordic countries<br />
rank with the highest digital literacy as reflected by<br />
the percentage of individuals aged 16 to 74 using the<br />
internet regularly [22]. The proportion of households<br />
in 2005 with access to internet was 75% in<br />
Denmark, 54% in Finl<strong>and</strong>, 84% in Icel<strong>and</strong>, 64% in<br />
Norway, <strong>and</strong> 73% in Sweden [14]. The Nordic<br />
populations were the first ones to adapt large scale<br />
use of mobile phones.<br />
Food consumption<br />
Across the Nordic countries, there were important<br />
differences in the average consumption of the main<br />
food components in 1970 [23]. The average milk<br />
consumption in Finl<strong>and</strong> was 263 kg per person per<br />
year whereas the consumption in the other countries<br />
varied from 172 to 193 kg per person. Denmark had<br />
a high consumption of meat <strong>and</strong> offals with 84 kg per<br />
person, or close to a quarter of a kilogram per person<br />
per day. The consumption of meat <strong>and</strong> offals in the<br />
other countries was between 43 <strong>and</strong> 56 kg per<br />
person. Fish consumption was highest in Norway<br />
(40 kg per person) <strong>and</strong> lowest in Finl<strong>and</strong> (13 kg per<br />
person). The consumption of vegetables, fruit <strong>and</strong><br />
berries in Sweden in 1970 was 122 kg per person,<br />
twice as much as in Finl<strong>and</strong>, with the consumption<br />
in Denmark <strong>and</strong> Norway being in between.<br />
In parallel with the economic development, dietary<br />
habits have changed in all Nordic countries. The<br />
consumption of fat <strong>and</strong> sugar has increased, while<br />
the consumption of food items rich in carbohydrate<br />
has decreased [24]. The consumption of low-fat<br />
milk <strong>and</strong> margarine has increased, while the total<br />
fat consumption has decreased. There has been a<br />
gradual increase in the consumption of fruit <strong>and</strong><br />
vegetables in all countries. Consumption of potatoes<br />
was high in all countries in 1970, ranging from 73<br />
to 89 kg per person [23]. Except for in Sweden,<br />
consumption of potatoes has decreased in later<br />
decades [24]. Until the 1980s meat consumption<br />
increased, but has, except for in Denmark, been<br />
stable since then. The lowest consumption of meat<br />
has continuously been in Norway, where in 1990 the<br />
mean intake per inhabitant was 54 kg, <strong>and</strong> highest in<br />
Denmark, with 105 kg per inhabitant (Table 2) [25].<br />
Overall dietary fat intake has decreased in Finl<strong>and</strong>,<br />
Norway, <strong>and</strong> Sweden, but not in Denmark [24].<br />
In 2005, Denmark was the Nordic record holder<br />
of the consumption of beef <strong>and</strong> veal (28 kg per<br />
person in 1970) pork (58 kg), poultry (23 kg), <strong>and</strong><br />
cheese (24 kg) [13]. Consumption of lamb <strong>and</strong><br />
sheep was the highest in Icel<strong>and</strong> (23 kg per person).<br />
Icel<strong>and</strong>ers <strong>and</strong> Norwegians consumed by far more
Acta Oncol Downloaded from informahealthcare.com by 212.35.100.66 on 04/06/11<br />
For personal use only.<br />
652 E. Pukkala et al.<br />
Table 2. Food consumption (kg per person) in 1990 in the<br />
Nordic countries [25].<br />
Denmark Finl<strong>and</strong> Icel<strong>and</strong> Norway Sweden<br />
Flour 75 78 . 79 69<br />
Potatoes (1) 65 64 50 70 84<br />
Vegetables,<br />
crucif<br />
69 (2,3) 54 31 54 54<br />
Fruit, berries,<br />
nuts<br />
54 91 38 79 94<br />
Meat 105 67 71 54 61<br />
Egg 14 11 11 11 13<br />
Milk 121 178 191 172 129<br />
Cheese 15 13 10 13 17<br />
Butter 9 8 5 3 5<br />
Margarine (4) 15 8 . 12 11<br />
Sugar, honey 37 35 55 41 43<br />
. Numbers are missing.<br />
(1) Potato products have been counted as fresh potatoes.<br />
(2) Numbers from 1985.<br />
(3) Excluding marmalade, juice, dried fruits.<br />
(4) Including light margarine calculated at 80% fat.<br />
fish than the other Nordic people, while the Icel<strong>and</strong>ers<br />
accounted for the lowest consumption of<br />
vegetables.<br />
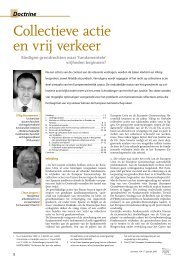
Alcohol consumption<br />
The average consumption of alcohol has varied over<br />
time <strong>and</strong> between countries (Figure 4) [26]. A<br />
general increase has been seen in all countries except<br />
Denmark in the later years.<br />
The proportion of abstainers among adult men in<br />
1985 ranged from 3% in Denmark to 23% in<br />
Sweden, whereas the proportions of abstainers<br />
Litres<br />
14<br />
12<br />
10<br />
8<br />
6<br />
4<br />
2<br />
0<br />
1967<br />
1969<br />
1971<br />
1973<br />
1975<br />
1977<br />
1979<br />
1981<br />
1983<br />
1985<br />
1987<br />
1989<br />
1991<br />
1993<br />
1995<br />
1997<br />
1999<br />
2001<br />
2003<br />
2005<br />
Year<br />
Denmark<br />
Finl<strong>and</strong><br />
Icel<strong>and</strong><br />
Norway<br />
Sweden<br />
Figure 4. Alcohol consumption in litres of pure alcohol in the<br />
Nordic countries [26].<br />
%<br />
%<br />
100<br />
80<br />
60<br />
40<br />
20<br />
0<br />
100<br />
80<br />
60<br />
40<br />
20<br />
0<br />
Men<br />
1965 1985 1965 1985 1965 1985 1965 1985 1965 1985<br />
Denmark Finl<strong>and</strong> Icel<strong>and</strong> Norway Sweden<br />
Abstainers Light 80 g/day<br />
Women<br />
1965 1985 1965 1985 1965 1985 1965 1985 1965 1985<br />
Denmark Finl<strong>and</strong> Icel<strong>and</strong> Norway Sweden<br />
Abstainers Light 80 g/day<br />
Figure 5. Drinking habits in 1965 <strong>and</strong> 1985 in the Nordic<br />
countries. By gender [27].<br />
among adult women ranged from 7% in Denmark<br />
to 37% in Sweden [27] (Figure 5).<br />
Tobacco use<br />
Tobacco consumption in Denmark was higher than<br />
in the other Nordic countries already in 1920 [28].<br />
In 1970 on average 68% of men <strong>and</strong> 47% of women<br />
in Denmark were smokers [29]. The numbers were<br />
54% for men <strong>and</strong> 37% for women in Norway in<br />
1973 1977 [30]. In Sweden, about 56% of men<br />
smoked in 1968, whereas the proportion of smokers<br />
in women varied from 46% in the 15 24 years old to<br />
17% in the 55 64 years old [31]. In Finl<strong>and</strong>,<br />
practically all tobacco consumption until the early<br />
1960s was attributable to men; thereafter the prevalence<br />
of smokers among men was halved to about<br />
30% <strong>and</strong> among women increased to about 30%<br />
[32].<br />
Smoking has decreased in all Nordic countries<br />
during the last decades (Figure 6) but direct<br />
comparison between the Nordic countries is somewhat<br />
difficult as the age-span in the official statistics
Acta Oncol Downloaded from informahealthcare.com by 212.35.100.66 on 04/06/11<br />
For personal use only.<br />
%<br />
%<br />
80<br />
70<br />
60<br />
50<br />
40<br />
30<br />
20<br />
10<br />
0<br />
80<br />
70<br />
60<br />
50<br />
40<br />
30<br />
20<br />
10<br />
0<br />
1965<br />
1965<br />
1970<br />
1970<br />
1975<br />
1975<br />
1980<br />
1980<br />
Men<br />
varies from 13 in Denmark, 15 64 in Finl<strong>and</strong>, 15<br />
79 in Icel<strong>and</strong>, 16 74 in Norway <strong>and</strong> 16 84 in<br />
Sweden [13].<br />
Both in 1965 <strong>and</strong> 1985, there were more<br />
male than female ever smokers, <strong>and</strong> the proportion<br />
among men decreased consistently over time<br />
(Figure 7) [33]. Among women the proportion<br />
of ever smokers remained largely unchanged over<br />
the period 1965 1985. The percentage of smokers<br />
declines with the educational level in all the Nordic<br />
countries [34].<br />
In Sweden, snuff-taking has for a long time been<br />
more common than in the other Nordic countries.<br />
Until 1995 it was almost exclusively men who took<br />
snuff, but in recent years women have also started to<br />
do so. In 2004 2005 27% of men (16 84 years) <strong>and</strong><br />
5% of women in Sweden took snuff [35]. The<br />
proportion of snuff-takers has increased in Sweden<br />
by 6% since the end of the 1980s until 2004 2005.<br />
In Norway snuff-taking is a new habit, introduced<br />
during the 1990s parallel with the decreasing smoking<br />
prevalence. In 2005 14% of Norwegian men<br />
1985<br />
Year<br />
Women<br />
1985<br />
Year<br />
1990<br />
1990<br />
1995<br />
1995<br />
Denmark<br />
Finl<strong>and</strong><br />
Icel<strong>and</strong><br />
Norway<br />
Sweden<br />
2000<br />
2000<br />
2005<br />
Denmark<br />
Finl<strong>and</strong><br />
Icel<strong>and</strong><br />
Norway<br />
Sweden<br />
Figure 6. Proportion of daily smokers in the Nordic countries.<br />
Men <strong>and</strong> women [14].<br />
2005<br />
%<br />
%<br />
100<br />
80<br />
60<br />
40<br />
20<br />
0<br />
100<br />
80<br />
60<br />
40<br />
20<br />
0<br />
<strong>Occupation</strong> <strong>and</strong> <strong>cancer</strong> in Nordic countries 653<br />
Men<br />
19651985 19651985 19651985 19651985 19651985<br />
Denmark Finl<strong>and</strong> Icel<strong>and</strong> Norway Sweden<br />
Never Former<br />
Current moderate Current heavy<br />
Women<br />
19651985 19651985 19651985 19651985 19651985<br />
Denmark Finl<strong>and</strong> Icel<strong>and</strong> Norway Sweden<br />
Never Former<br />
Current moderate Current heavy<br />
Figure 7. Smoking habits in 1965 <strong>and</strong> 1985 in the Nordic<br />
countries. By gender [33].<br />
aged 16 24 years <strong>and</strong> 10% of men aged 25 44 years<br />
used snuff on a regular basis [36]. The respective<br />
proportions among women were 4% <strong>and</strong> 2%.<br />
Health <strong>and</strong> health care<br />
Life expectancy in the five Nordic countries is<br />
among the highest in the world <strong>and</strong> has risen during<br />
the last decades (Table 3).<br />
Finnish women <strong>and</strong> men have, in the period<br />
between 1960 <strong>and</strong> 2005, on average gained about<br />
Table 3. Life expectancy at birth (in years) in the Nordic<br />
countries 1960 <strong>and</strong> 2005 [14].<br />
Women Men<br />
1960 2005 1960 2005<br />
Denmark 74.4 80.2 70.4 75.6<br />
Finl<strong>and</strong> 72.5 82.3 65.5 75.5<br />
Icel<strong>and</strong> 75.5 83.1 70.7 79.2<br />
Norway 75.8 82.5 71.3 77.7<br />
Sweden 74.9 82.8 71.2 78.4
Acta Oncol Downloaded from informahealthcare.com by 212.35.100.66 on 04/06/11<br />
For personal use only.<br />
654 E. Pukkala et al.<br />
/ 1000<br />
20<br />
15<br />
10<br />
5<br />
Denmark<br />
Finl<strong>and</strong><br />
Icel<strong>and</strong><br />
Norway<br />
Sweden<br />
0<br />
1960 1970 1980<br />
Year<br />
1990 2000<br />
Figure 8. Infant mortality per 1 000 live births in the Nordic<br />
countries in 1960 2004 [37].<br />
10 years in life expectancy, <strong>and</strong> all other Nordic<br />
populations 5 to 9 years. Icel<strong>and</strong>ic men could expect<br />
to live longer than any other men included in OECD<br />
statistics in 2005. The differences in life expectancy<br />
between the Nordic countries are mostly due to<br />
mortality differences in adult life. Infant mortality in<br />
the Nordic countries is low (Figure 8) [37].<br />
In the Nordic countries, the health service is<br />
financed through taxes or through compulsory<br />
health insurance schemes to a large extent. There<br />
are well-established primary health care systems<br />
<strong>and</strong> well-developed hospital services. Employees on<br />
sick leave either receive their salary or are compensated<br />
by special cash allowances. The self-employed<br />
ensure themselves.<br />
In all of the Nordic countries social assistance is<br />
granted if all other support options have been<br />
exhausted <strong>and</strong> all citizens are guaranteed a certain<br />
level of income at retirement <strong>and</strong> disability [13].<br />
<strong>Occupation</strong>al history of the study population<br />
The population included in the present study was<br />
born between 1896 <strong>and</strong> 1960 (see Materials <strong>and</strong><br />
methods). People in the oldest birth cohorts typically<br />
started working around the age of 15, in the period<br />
between 1910 <strong>and</strong> 1920. Due to the increasing<br />
duration of education, many persons in the youngest<br />
birth cohorts started their working careers around<br />
the age of 25 or even higher. The normal time for<br />
retirement in the Nordic countries has been between<br />
65 <strong>and</strong> 70 years. Thus, persons included in this<br />
study have participated in the labour market from<br />
the years before World War I until after the turn of<br />
the millennium, covering a period of enormous<br />
changes in the types of economic activities <strong>and</strong> the<br />
structure of the labour force in the Nordic countries,<br />
as well as in living <strong>and</strong> working conditions.<br />
%<br />
%<br />
%<br />
40<br />
35<br />
30<br />
25<br />
20<br />
15<br />
10<br />
5<br />
a. Agriculture, forestry, hunting <strong>and</strong> fishing<br />
Denmark<br />
Finl<strong>and</strong><br />
Icel<strong>and</strong><br />
Norway<br />
Sweden<br />
0<br />
1960 1970 1980 1990<br />
Year<br />
1995 2000 2005<br />
40<br />
35<br />
30<br />
25<br />
20<br />
15<br />
10<br />
5<br />
b. Mining, manufacturing, electricity <strong>and</strong> water<br />
Denmark<br />
Finl<strong>and</strong><br />
Icel<strong>and</strong><br />
Norway<br />
Sweden<br />
0<br />
1960 1970 1980 1990<br />
Year<br />
1995 2000 2005<br />
45<br />
40<br />
35<br />
30<br />
25<br />
20<br />
c. Service sector<br />
15<br />
Denmark<br />
10<br />
Finl<strong>and</strong><br />
Icel<strong>and</strong><br />
5<br />
Norway<br />
0<br />
Sweden<br />
1960 1970 1980 1990<br />
Year<br />
1995 2000 2005<br />
Figure 9. Proportion of work force by sector in the Nordic<br />
countries, both genders combined [12,38,39].<br />
One of the main changes has been the decline in<br />
the proportion of the population working in agriculture,<br />
forestry, hunting <strong>and</strong> fishing. In 1900 the<br />
labour force in all the Nordic countries was largely<br />
working in the agricultural sector. The reduction of<br />
workers in agriculture came latest to Finl<strong>and</strong>. As<br />
much as 63% of Finnish men worked in agriculture<br />
in 1930, a much larger proportion than in the<br />
other countries. In 1960 the proportion of persons<br />
(men <strong>and</strong> women combined) in agriculture were
Acta Oncol Downloaded from informahealthcare.com by 212.35.100.66 on 04/06/11<br />
For personal use only.<br />
%<br />
90<br />
80<br />
70<br />
60<br />
50<br />
40<br />
Denmark<br />
Finl<strong>and</strong><br />
Icel<strong>and</strong><br />
Norway<br />
Sweden<br />
1968<br />
1970<br />
1972<br />
1974<br />
1976<br />
1978<br />
1980<br />
1982<br />
1984<br />
1986<br />
1988<br />
1990<br />
1992<br />
1994<br />
1996<br />
1998<br />
2000<br />
2002<br />
2004<br />
2006<br />
YEAR<br />
Figure 10. Percentage of economically active women in the<br />
Nordic countries [40].<br />
18% in Denmark, 36% in Finl<strong>and</strong>, 22% in Icel<strong>and</strong>,<br />
20% in Norway, <strong>and</strong> 14% in Sweden (Figure 9a)<br />
[12,38,39]. Around 2005, only 2 6% in each<br />
country were occupied in the primary sector. Still,<br />
meat <strong>and</strong> dairy products in Denmark <strong>and</strong> fish <strong>and</strong><br />
fish products in Icel<strong>and</strong> <strong>and</strong> Norway have remained<br />
important export products.<br />
<strong>Occupation</strong> <strong>and</strong> <strong>cancer</strong> in Nordic countries 655<br />
Around 1900, only 11% of the labour force in<br />
Finl<strong>and</strong> was employed in the industrial sector,<br />
compared to 26% in Norway <strong>and</strong> 29% in Sweden.<br />
In pre-WWII Denmark, small scale industrial<br />
enterprises producing for the home market were<br />
common. Industrial development related to, e.g.,<br />
steel, copper, <strong>and</strong> timber came earliest to Sweden.<br />
Following the war, Sweden also had the advantage of<br />
an intact industrial base <strong>and</strong> its natural resources in<br />
the expansion of its industry. In Finl<strong>and</strong>, there was<br />
rapid growth specifically in the metal industry after<br />
WWII due to peace requirements after the war.<br />
Cheap hydro-electric power formed the basis for<br />
the early development of large industries in Norway<br />
(e.g. aluminium <strong>and</strong> fertilizer industry). In Norway,<br />
the maximum proportion of employees in the<br />
industrial sector (29%) was in 1970 (Figure 9b).<br />
From the 1970s on, economic growth in Norway has<br />
largely been based on the production of North Sea<br />
oil, but only a small proportion of the labour force is<br />
directly engaged in this. The substantial economic<br />
growth in the post war period in Icel<strong>and</strong> was driven<br />
mainly by industrialisation of the fishing sector.<br />
Around 2005, 3% of the labour force was employed<br />
in fishing.<br />
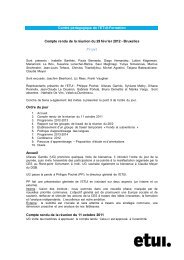
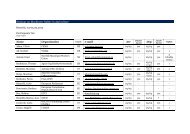
Figure 11. Time windows of follow-up of the study cohort defined by year of birth <strong>and</strong> age, by country. Bold vertical lines indicate time of<br />
baseline census used for allocation of the occupational category.
Acta Oncol Downloaded from informahealthcare.com by 212.35.100.66 on 04/06/11<br />
For personal use only.<br />
656 E. Pukkala et al.<br />
The tertiary sector includes public <strong>and</strong> private<br />
service work as well as wholesale <strong>and</strong> retail trade,<br />
restaurants <strong>and</strong> hotels, finance, insurance, real estate<br />
<strong>and</strong> business service. In all Nordic countries, employment<br />
in the tertiary sector has increased from<br />
comprising 15 20% of the labour force in 1960 to<br />
30 40% in 2005 (Figure 9c). Another important<br />
change from the 1960s was the increasing labour<br />
market participation of women (Figure 10) [40].<br />
The activity rates have been increasing steadily in all<br />
Nordic countries up to 73 84% in 2005, i.e., not<br />
much lower than among the men. These major<br />
changes seen from 1960 to 1980 coincided with the<br />
growth of the welfare states, urbanisation, a decrease<br />
in the agricultural sector <strong>and</strong> a growing service<br />
sector. The growth of the female labour force<br />
participation came later in Icel<strong>and</strong> <strong>and</strong> Norway<br />
than in Denmark <strong>and</strong> Sweden, while the level was<br />
high in Finl<strong>and</strong> already in 1960.<br />
Material <strong>and</strong> methods<br />
Study population<br />
The study base consists of persons participating<br />
in any computerised population census in the<br />
Nordic countries in 1990 or earlier (Figure 11). In<br />
Denmark, the 1970 census took place on November<br />
9. In Finl<strong>and</strong> the 1970, 1980 <strong>and</strong> 1990 censuses<br />
took place on December 31 of the census year. In<br />
Icel<strong>and</strong> the census took place on January 31, 1981.<br />
In Norway the 1960, 1970 <strong>and</strong> 1980 censuses took<br />
place on November 1. In Sweden the 1960, 1970,<br />
<strong>and</strong> 1990 censuses took place on November 1, while<br />
the 1980 census took place on September 15. The<br />
study cohort included people aged 30 64 years still<br />
alive <strong>and</strong> living in the country on January 1 in the<br />
year following the census. The cohort includes 14.9<br />
million persons: 2.0 million from Denmark, 3.4<br />
million from Finl<strong>and</strong>, 0.1 million from Icel<strong>and</strong>, 2.6<br />
million from Norway <strong>and</strong> 6.8 million from Sweden.<br />
In the Icel<strong>and</strong>ic census of 1981 it was compulsory<br />
for all individuals born 1964 or before to fill<br />
out the self-administered questionnaire on personal<br />
questions. In the other countries, the heads of<br />
households had to fill out self-administered questionnaires<br />
for all members of the household <strong>and</strong> for<br />
the dwelling.<br />
A system of giving unique personal identity<br />
codes to all residents was introduced in Sweden<br />
in 1947, in Icel<strong>and</strong> in 1953, in Norway in 1964<br />
(but including all persons alive in 1960), in Finl<strong>and</strong><br />
in 1967, <strong>and</strong> in Denmark in 1968. This personal<br />
identity code, name, address, marital status, education,<br />
economic activity, occupation, <strong>and</strong> industry<br />
were recorded for each person. All questionnaires<br />
were centrally coded <strong>and</strong> computerised in the<br />
national statistical offices.<br />
Economic activity<br />
In Denmark all persons who were gainfully employed<br />
at the time of the census or were temporarily absent<br />
from work due to illness, unemployment, vacation,<br />
or military service were classified as economically<br />
active. A fairly similar definition was used in Sweden.<br />
In Finl<strong>and</strong>, only people who at the time of the<br />
census were gainfully employed for at least half of<br />
the industry’s normal working hours or were temporarily<br />
absent were considered economically active.<br />
In Icel<strong>and</strong>, those who were gainfully employed the<br />
week before the day of the census, January 31, 1981<br />
or were temporarily absent from work due to illness<br />
or vacation that week, were classified as economically<br />
active.<br />
In Norway, only persons who reported at least 100<br />
hours of gainful employment during the last 12<br />
months before the census or were temporarily absent<br />
were classified as economically active in the censuses<br />
of 1970 <strong>and</strong> 1980. In 1960, no specific requirement<br />
was set for the number of working hours, <strong>and</strong><br />
occupational activity was defined only as having a<br />
main occupation. In addition, the work of married<br />
women in family businesses, e.g., in farming, was<br />
not counted as occupational activity. This has been<br />
suggested to account for about 29 000 women [41].<br />
<strong>Occupation</strong><br />
The basis of the coding of occupations was free<br />
text information on education, occupation, industry,<br />
<strong>and</strong> name <strong>and</strong> address of employer at the time<br />
of the census. In Finl<strong>and</strong>, Norway <strong>and</strong> Sweden,<br />
occupation was coded according to national adaptations<br />
of the Nordic <strong>Occupation</strong>al Classification,<br />
usually abbreviated to NYK [42]. NYK is a Nordic<br />
adaptation of the International St<strong>and</strong>ard Classification<br />
of <strong>Occupation</strong>s (ISCO) from 1958 [43]. The<br />
first digit of NYK, as well as ISCO 1958 codes,<br />
indicates major occupational categories, two digits<br />
level about 70 minor occupational categories, <strong>and</strong><br />
three digits level more than 300 specific occupations.<br />
The national code values may differ, but the<br />
coding principle is similar in Finl<strong>and</strong>, Norway <strong>and</strong><br />
Sweden.<br />
<strong>Occupation</strong> was coded in Icel<strong>and</strong> according to a<br />
national adaptation of ISCO-68 [44]. For the<br />
present study, a conversion was made to ISCO-58<br />
by instructions from the International Labour Organisation<br />
given in the ISCO 1968 manual.<br />
In Denmark, occupation was coded according to a<br />
special national nomenclature with a distinction
Acta Oncol Downloaded from informahealthcare.com by 212.35.100.66 on 04/06/11<br />
For personal use only.<br />
between self-employed persons, family workers,<br />
salaried employees, skilled workers, <strong>and</strong> unskilled<br />
workers a total of 218 codes were possible. Entities<br />
similar to those used in NYK were formed by<br />
combining these occupational codes with the 245<br />
codes for industry.<br />
For the present study, the original national<br />
occupation codes were converted to a common<br />
classification with 53 relatively specific, but not too<br />
small, occupational categories, <strong>and</strong> an additional<br />
category of economically inactive persons (Appendix<br />
1, available in the online version of the journal.<br />
Please find this material with the direct link to the<br />
article: http://www.informaworld.com/10.1080/0284<br />
1860902913546). Descriptions of work included in<br />
each of the categories are provided in Appendix 2.<br />
The numbers of persons in the study by gender,<br />
country <strong>and</strong> occupational category are shown in<br />
Appendix 3.<br />
Follow-up for <strong>cancer</strong> incidence<br />
A person entered the cohort on January 1 of the year<br />
after the first available census where s/he participated,<br />
provided that s/he was 30-64 years old./he<br />
participated, provided that s/he 30 64 years old.<br />
Person-years were then counted until the date of<br />
emigration, death or to December 31 of the following<br />
years: in Denmark 2003, in Finl<strong>and</strong> 2005, in<br />
Icel<strong>and</strong> 2004, in Norway 2003, <strong>and</strong> in Sweden 2005<br />
(Figure 11). The source of the data on dates of death<br />
<strong>and</strong> emigration in all countries was the Central<br />
Population Register. The numbers of person years<br />
by gender, country <strong>and</strong> occupational category are<br />
shown in Appendix 4.<br />
The <strong>cancer</strong> registration in Denmark is based on<br />
notifications from clinical hospital departments,<br />
supplemented with notifications from practising<br />
specialists in dermatology <strong>and</strong> gynaecology, <strong>and</strong><br />
with autopsy reports from pathology departments.<br />
Throughout the period, the notifications were<br />
supplemented with information on <strong>cancer</strong> cases<br />
reported on death certificates. From 1988 onwards<br />
linkage was also made with the Hospital Discharge<br />
Register, <strong>and</strong> from 2002 onwards also with the<br />
Pathology Register. In 1971 1977 the <strong>cancer</strong> cases<br />
were coded according to an extended version of<br />
the International Classification on Diseases, version<br />
7, (ICD-7) [45], <strong>and</strong> from 1978 onwards according<br />
to the International Classification on Diseases for<br />
Oncology, version 1 (ICD-O-1) [46].<br />
Cancer registration in Finl<strong>and</strong> started in 1953<br />
<strong>and</strong> the reporting has been compulsory since 1961.<br />
Registration of new cases of <strong>cancer</strong> is based on<br />
reports from clinical <strong>and</strong> pathological departments,<br />
private clinics, general practitioners, <strong>and</strong> informa-<br />
<strong>Occupation</strong> <strong>and</strong> <strong>cancer</strong> in Nordic countries 657<br />
tion from the causes of death registry. The incident<br />
<strong>cancer</strong> cases were coded for topography according to<br />
the ICD-7 [45] <strong>and</strong> for morphology according to<br />
MOTNAC 1951 [47], both nomenclatures extended<br />
to correspond to the practical new needs of<br />
classification.<br />
In Icel<strong>and</strong>, <strong>cancer</strong> registration has from the start<br />
(1955) been based on information from all pathology<br />
laboratories in the country. This information<br />
is complemented by information from cytology<br />
<strong>and</strong> haematology laboratories, by notifications from<br />
hospitals <strong>and</strong> health centres <strong>and</strong> by death certificates.<br />
Topography was coded according to ICD-7<br />
[45] <strong>and</strong> morphology according to ICD-O-1 [46].<br />
Cancer registration in Norway has been based on<br />
compulsory reporting of new cases of <strong>cancer</strong> from<br />
clinical <strong>and</strong> pathological departments, private clinics,<br />
general practitioners <strong>and</strong> information from the causes<br />
of death registry since 1953. The pathology reports<br />
provide histological, cytological or autopsy information.<br />
Since 1998, the Patient Administrative Data<br />
(PAD) system in hospitals has been used as an<br />
additional source of information. Cancer cases diagnosed<br />
before 1993 are coded according to ICD-7.<br />
From 1993 ICD-O-2 has been used, with a semiautomatic<br />
conversion back to ICD-7 codes, which<br />
have been used in the classification of <strong>cancer</strong> in the<br />
present study. MOTNAC was used for the coding of<br />
morphology until 1993, but was then replaced by<br />
ICD-O-2.<br />
The <strong>cancer</strong> registration in Sweden in 1958 1982<br />
was based on reports from hospital clinicians <strong>and</strong><br />
from hospital pathologists. Private practitioners have<br />
been required to report <strong>cancer</strong> cases since 1983.<br />
Notifications were collected <strong>and</strong> centrally coded in<br />
Stockholm until 1984, when the coding was fully<br />
decentralised to the six oncology centres (founded<br />
during the period 1976 to 1984) The coding is done<br />
simultaneously in several versions; 1958 until now in<br />
ICD-7, 1987 until now in ICD-9, 1993 until now<br />
ICD-O-2, <strong>and</strong> 2005 until now in ICD-O-3. The<br />
histology has been coded with three digits according<br />
to the statistical codes for human tumours by<br />
the WHO from 1956 [48]. Unlike the other Nordic<br />
countries, Sweden does not register <strong>cancer</strong> cases<br />
based on death certificate only, <strong>and</strong> does not trace<br />
back missing cases that could be identified via death<br />
certificates.<br />
Combined <strong>cancer</strong> incidence<br />
The <strong>cancer</strong> cases have been grouped into 49 main<br />
categories <strong>and</strong> 27 diagnostic sub groups based on<br />
the national topography <strong>and</strong> morphology coding<br />
systems (Appendix 5 <strong>and</strong> 6).
Acta Oncol Downloaded from informahealthcare.com by 212.35.100.66 on 04/06/11<br />
For personal use only.<br />
658 E. Pukkala et al.<br />
Minor differences have occurred over time <strong>and</strong><br />
between countries in the definition <strong>and</strong> coding of<br />
multiple primary tumours. In the present study only<br />
the first incident <strong>cancer</strong> within a given diagnostic<br />
group of this particular type was included in the<br />
Danish <strong>and</strong> Icel<strong>and</strong>ic data. In the tabulation of<br />
‘‘All sites’’, only the first <strong>cancer</strong> of any type<br />
diagnosed within a persons risk period was included<br />
in Denmark <strong>and</strong> the first <strong>cancer</strong> diagnosed within<br />
each diagnostic group in Icel<strong>and</strong>. This method<br />
creates slight incomparability of absolute risk estimates<br />
between Denmark <strong>and</strong> Icel<strong>and</strong> <strong>and</strong> the other<br />
Nordic countries, but has virtually no effect on<br />
relative risk estimates.<br />
The incident <strong>cancer</strong> cases included in the present<br />
study involve all invasive <strong>cancer</strong>s <strong>and</strong> also benign<br />
brain tumours. The non-melanoma skin <strong>cancer</strong>s were<br />
excluded from the ‘‘All sites’’ category because basal<br />
cell carcinomas of the skin could not be separated<br />
from the group ‘‘Other skin <strong>cancer</strong>s’’ (primarily<br />
squamous cell carcinomas) in the Danish data. Close<br />
to 3 million primary incident <strong>cancer</strong> cases are<br />
included in the present study; 570 000 from Denmark,<br />
500 000 from Finl<strong>and</strong>, 15 000 from Icel<strong>and</strong>,<br />
560 000 from Norway, <strong>and</strong> 1.3 million from Sweden.<br />
St<strong>and</strong>ardised incidence ratio<br />
The relative level of the <strong>cancer</strong> incidence of an<br />
occupational category is described by the st<strong>and</strong>ardised<br />
incidence ratio (SIR), with the <strong>cancer</strong> incidence<br />
rates for the entire national study populations<br />
used as reference rates. For each country, gender<br />
<strong>and</strong> occupational category, the observed number<br />
of <strong>cancer</strong> cases <strong>and</strong> person years were stratified<br />
into eight 5-year attained age categories; 30 34;<br />
35 39; ...,85 years; <strong>and</strong> 5-year calendar periods<br />
(Figure 11).<br />
For a given gender (g), the SIR for a given<br />
occupational category (o) in a given country (c) is<br />
then calculated as<br />
where Obs observed number of <strong>cancer</strong> cases; PY<br />
person years; a age; p period. The denominator<br />
in the equation is the expected number of <strong>cancer</strong><br />
cases for the given gender, occupational category<br />
<strong>and</strong> country. The SIR for the five countries together<br />
is calculated from the numerator <strong>and</strong> the denominator<br />
sums across the countries.<br />
For each SIR the exact 95% confidence interval<br />
(CI) was defined assuming a Poisson distribution of<br />
the observed number of cases.<br />
Method of presentation<br />
The observed numbers of <strong>cancer</strong> cases <strong>and</strong> the<br />
SIRs for each Nordic country, <strong>and</strong> the respective<br />
information for the five countries combined together<br />
with the 95% confidence interval for the SIR are<br />
presented in tables for each diagnostic group <strong>and</strong><br />
gender. Each of the 54 occupational categories is one<br />
row in a table. Such tabulations for some of<br />
the very rare <strong>cancer</strong> categories <strong>and</strong> for subsites<br />
or histological sub-categories are, however, available<br />
only in electronic format (http://astra.<strong>cancer</strong>.fi/<br />
NOCCA)<br />
In cells where the observed numbers of <strong>cancer</strong>s<br />
are zero, the expected numbers of <strong>cancer</strong> cases are<br />
presented in squared brackets. All SIRs for which<br />
the upper limit of the confidence interval is below<br />
1.0 are printed in green, <strong>and</strong> all SIRs for which the<br />
lower limit of the confidence interval is above 1.0 are<br />
printed in red.<br />
On the webpage (http://astra.<strong>cancer</strong>.fi/NOCCA/<br />
Incidence/results-by-occupation) there are also similar<br />
tabulations for each of the 54 occupational<br />
categories, <strong>and</strong> gender where all <strong>cancer</strong> categories<br />
are presented. The results are also available in Excel<br />
format allowing the reader to combine columns from<br />
several tables, <strong>and</strong> in a semicolon separated text file<br />
suitable for importing data to various software.<br />
Whenever data are available on <strong>cancer</strong> incidence<br />
in the combined Nordic <strong>cancer</strong> incidence statistical<br />
tool NORDCAN, the site, gender <strong>and</strong> country<br />
specific incidence trends (smoothed with the Lowess<br />
method) are shown in graphs preceding the<br />
occupation-specific results [49].<br />
Results: Cancer incidence by <strong>cancer</strong> site<br />
Lip <strong>cancer</strong><br />
The incidence of lip <strong>cancer</strong> in the Nordic countries<br />
was five to ten times higher in men than in women<br />
still in the 1980s, but due to a strong decrease among<br />
males, the difference is now small (Figure 12). The<br />
rates have been highest in Finl<strong>and</strong>, twice as high<br />
as in Sweden.<br />
In the present study the highest SIR among men<br />
was observed among fishermen (SIR 2.27, 95% CI<br />
2.05 2.51). Other high SIRs that were elevated in<br />
several countries were seen among farmers, gardeners,<br />
forestry workers, miners (many of whom work in<br />
open quarries) <strong>and</strong> miscellaneous construction<br />
workers (Table 4). The SIR was lowest (0.28,
Acta Oncol Downloaded from informahealthcare.com by 212.35.100.66 on 04/06/11<br />
For personal use only.<br />
0.16 0.46) among the physicians, followed by artistic<br />
workers, printers <strong>and</strong> waiters.<br />
In women, there were no occupations with systematically<br />
increased or decreased SIRs in all countries<br />
(Table 5). Female farmers had a significantly<br />
decreased risk of lip <strong>cancer</strong> in Denmark <strong>and</strong><br />
Sweden.<br />
Comment. All eight occupations with significant<br />
SIRs 1.20 in males include a major part of outdoor<br />
work, while the lowest SIRs are in indoor occupations.<br />
This fits well with earlier findings indicating<br />
/ 100 000<br />
8<br />
6<br />
4<br />
2<br />
0<br />
Men<br />
Denmark<br />
Finl<strong>and</strong><br />
Icel<strong>and</strong><br />
Norway<br />
Sweden<br />
1945 1960 1975 1990 2005<br />
that men living in rural areas <strong>and</strong> in particular those<br />
employed in outdoor occupations such as fishermen<br />
<strong>and</strong> farmers have the highest risk of lip <strong>cancer</strong><br />
[50 52]. The risk has been ascribed to exposure to<br />
sunlight <strong>and</strong> smoking [53]. The pattern of high-risk<br />
occupations of lip <strong>cancer</strong> is very different from<br />
/ 100 000<br />
the respective pattern of lung <strong>cancer</strong>. This is in<br />
accordance with the observation that smoking is a<br />
major risk factor of lip <strong>cancer</strong> only in interaction<br />
with outdoor exposure [53]. The strong decrease in<br />
lip <strong>cancer</strong> incidence rates is in accordance with the<br />
decreasing proportion of farmers in the Nordic<br />
countries.<br />
The small numbers of female lip <strong>cancer</strong> do not<br />
allow conclusions of occupational pattern among<br />
them. The low SIRs among female farmers indicate<br />
that women on farms have had less outdoor work<br />
than men.<br />
8<br />
6<br />
4<br />
2<br />
0<br />
Women<br />
Denmark<br />
Finl<strong>and</strong><br />
Icel<strong>and</strong><br />
Norway<br />
Sweden<br />
1945 1960 1975 1990 2005<br />
Figure 12. Age st<strong>and</strong>ardised (World) incidence rates for lip <strong>cancer</strong> 1943 2005, by country <strong>and</strong> gender. Modified from NORDCAN [49].<br />
/ 100 000<br />
2<br />
1<br />
Denmark<br />
Finl<strong>and</strong><br />
Icel<strong>and</strong><br />
Norway<br />
Sweden<br />
Men<br />
0<br />
1945 1960 1975 1990 2005<br />
/ 100 000<br />
Tongue <strong>cancer</strong><br />
Cancer of the tongue is rare, but incidence rates in<br />
men have approximately doubled from 1960 to 2003<br />
(Figure 13). Rates were lowest in Icel<strong>and</strong> <strong>and</strong>,<br />
during the last 10 years, highest in Denmark. Among<br />
women, rates are approximately half of that among<br />
2<br />
1<br />
<strong>Occupation</strong> <strong>and</strong> <strong>cancer</strong> in Nordic countries 659<br />
Denmark<br />
Finl<strong>and</strong><br />
Icel<strong>and</strong><br />
Norway<br />
Sweden<br />
Women<br />
0<br />
1945 1960 1975 1990 2005<br />
Figure 13. Age st<strong>and</strong>ardised (World) incidence rates for <strong>cancer</strong> of the tongue 1943 2005, by country <strong>and</strong> gender. Modified from<br />
NORDCAN [49].
Acta Oncol Downloaded from informahealthcare.com by 212.35.100.66 on 04/06/11<br />
For personal use only.<br />
660 E. Pukkala et al.<br />
Table 4. Observed number of lip <strong>cancer</strong> among men in the Nordic countries <strong>and</strong> st<strong>and</strong>ardised incidence ratios 1961 2005, by country <strong>and</strong><br />
occupational category.<br />
Denmark Finl<strong>and</strong> Icel<strong>and</strong> Norway Sweden Total<br />
No <strong>Occupation</strong>al category Obs SIR Obs SIR Obs SIR Obs SIR Obs SIR Obs SIR 95% CI<br />
1 Technical workers, etc 74 0.44 78 0.49 1 1.16 43 0.47 290 0.66 486 0.56 0.52*0.62<br />
2 Laboratory assistants 1 0.30 3 0.81 [0.17] 0.00 3 0.62 2 1.51 9 0.68 0.31*1.28<br />
3 Physicians 1 0.07 [8.94] 0.00 [0.38] 0.00 5 0.37 10 0.52 16 0.28 0.16*0.46<br />
4 Dentists 1 0.24 [2.00] 0.00 [0.08] 0.00 6 0.98 6 0.59 13 0.58 0.31*0.99<br />
5 Nurses 1 5.29 [0.29] 0.00 [0.00] 0.00 1 2.61 [0.52] 0.00 2 1.44 0.17*5.21<br />
6 Assistant nurses 4 1.01 1 4.68 [0.04] 0.00 1 0.40 4 0.59 10 0.75 0.36*1.37<br />
7 ‘‘Other health workers’’ 2 0.16 6 0.62 [0.10] 0.00 1 0.19 15 0.86 24 0.54 0.34*0.80<br />
8 Teachers 33 0.44 26 0.38 1 0.74 31 0.44 45 0.42 136 0.42 0.36*0.50<br />
9 Religious workers etc 14 0.43 9 0.26 [0.94] 0.00 15 0.39 44 0.53 82 0.43 0.34*0.54<br />
10 Artistic workers 3 0.31 3 0.22 [0.26] 0.00 4 0.35 10 0.37 20 0.32 0.20*0.50<br />
11 Journalists 2 0.44 1 0.15 1 6.78 3 0.62 5 0.39 12 0.41 0.21*0.72<br />
12 Administrators 74 0.38 39 0.36 1 0.37 71 0.50 94 0.49 279 0.44 0.39*0.49<br />
13 Clerical workers 33 0.40 46 0.60 2 0.66 45 0.43 113 0.57 239 0.52 0.45*0.59<br />
14 Sales agents 27 0.62 51 0.48 2 1.32 65 0.51 157 0.55 302 0.54 0.48*0.60<br />
15 Shop workers 90 0.46 25 0.62 1 0.97 31 0.69 51 0.58 198 0.54 0.47*0.62<br />
16 Farmers 621 1.56 952 1.53 10 2.18 578 1.45 978 1.68 3 139 1.57 1.51*1.62<br />
17 Gardeners 69 1.25 120 1.53 [0.15] 0.00 133 1.44 355 1.76 677 1.58 1.47*1.71<br />
18 Fishermen 57 3.33 14 1.79 1 0.51 232 1.92 80 3.65 384 2.27 2.05*2.51<br />
19 Forestry workers 18 2.22 124 1.35 [0.02] 0.00 114 1.58 189 1.29 445 1.40 1.27*1.53<br />
20 Miners <strong>and</strong> quarry workers 3 1.27 21 1.44 [0.03] 0.00 29 1.56 45 1.28 98 1.39 1.13*1.69<br />
21 Seamen 28 1.58 23 1.25 [0.62] 0.00 92 1.06 42 1.42 185 1.21 1.05*1.40<br />
22 Transport workers 34 0.82 44 0.76 [1.44] 0.00 35 0.74 91 0.95 204 0.84 0.73*0.96<br />
23 Drivers 199 1.54 156 0.91 2 1.06 127 1.00 262 1.14 746 1.13 1.05*1.22<br />
24 Postal workers 22 0.86 9 0.34 [0.27] 0.00 19 0.73 32 0.61 82 0.63 0.50*0.78<br />
25 Textile workers 12 0.50 15 0.78 [0.50] 0.00 22 0.75 48 0.74 97 0.70 0.57*0.86<br />
26 Shoe <strong>and</strong> leather workers 2 0.34 3 0.35 [0.11] 0.00 10 0.76 17 0.62 32 0.58 0.39*0.82<br />
27 Smelting workers 44 0.87 29 1.02 1 1.54 40 1.03 81 0.81 195 0.89 0.78*1.03<br />
28 Mechanics 113 0.81 94 0.57 [1.67] 0.00 118 0.68 376 0.90 701 0.78 0.73*0.84<br />
29 Plumbers 9 0.73 20 0.73 [0.30] 0.00 13 0.67 38 0.79 80 0.74 0.59*0.92<br />
30 Welders 12 0.53 [0.10] 0.00 26 1.27 47 0.93 85 0.91 0.72*1.12<br />
31 Electrical workers 19 0.59 50 0.75 1 1.05 70 0.93 132 0.97 272 0.87 0.77*0.98<br />
32 Wood workers 100 1.01 216 1.06 2 1.83 248 1.15 321 1.02 887 1.06 0.99*1.13<br />
33 Painters 18 0.57 30 0.73 [0.41] 0.00 24 0.65 45 0.51 117 0.59 0.49*0.71<br />
34 ‘‘Other construction workers’’ 255 2.05 162 1.21 3 1.49 58 1.39 248 1.46 726 1.54 1.43*1.65<br />
35 Bricklayers 42 1.18 18 0.84 26 1.19 31 0.75 117 0.98 0.81*1.17<br />
36 Printers 5 0.23 7 0.44 [0.31] 0.00 6 0.29 18 0.41 36 0.35 0.25*0.49<br />
37 Chemical process workers 24 1.14 29 1.00 1 4.70 62 1.22 86 1.12 202 1.14 0.99*1.31<br />
38 Food workers 64 0.95 20 0.94 3 1.60 46 0.82 57 0.77 190 0.86 0.75*0.99<br />
39 Beverage workers 10 1.28 [1.51] 0.00 [0.03] 0.00 [0.39] 0.00 6 1.33 16 1.12 0.64*1.82<br />
40 Tobacco workers 2 1.45 1 4.23 [0.00] 0.00 1 1.08 [0.31] 0.00 4 1.40 0.38*3.59<br />
41 Glass makers etc 52 1.30 28 0.92 [0.32] 0.00 21 0.82 106 1.32 207 1.17 1.02*1.34<br />
42 Packers 42 1.18 81 1.20 [1.08] 0.00 71 0.83 161 1.05 355 1.03 0.93*1.15<br />
43 Engine operators 55 1.54 88 1.08 [1.22] 0.00 42 0.99 131 1.14 316 1.15 1.03*1.28<br />
44 Public safety workers 20 0.58 30 0.61 2 2.13 25 0.72 46 0.72 123 0.67 0.56*0.80<br />
45 Cooks <strong>and</strong> stewards 2 0.82 [2.53] 0.00 [0.39] 0.00 15 1.05 9 0.82 26 0.85 0.56*1.25<br />
46 Domestic assistants [0.03] 0.00 [0.22] 0.00 [0.00] 0.00 [0.10] 0.00 [0.68] 0.00 [1.02] 0.00 0.00*3.61<br />
47 Waiters [4.95] 0.00 1 0.43 [0.03] 0.00 3 0.46 3 0.53 7 0.36 0.14*0.74<br />
48 Building caretakers 33 0.92 34 0.75 1 2.02 15 0.82 71 1.21 154 0.97 0.83*1.14<br />
49 Chimney sweeps 1 1.14 6 1.78 [1.84] 0.00 4 1.07 11 1.12 0.56*2.00<br />
50 Hairdressers 3 0.29 [0.92] 0.00 [0.05] 0.00 3 0.56 7 0.47 13 0.41 0.22*0.70<br />
51 Launderers 2 0.39 1 1.11 [0.05] 0.00 3 0.93 4 0.38 10 0.50 0.24*0.93<br />
52 Military personnel 4 0.24 8 0.61 19 0.76 35 0.95 66 0.72 0.55*0.91<br />
53 ‘‘Other workers’’ 132 1.25 53 0.98 3 0.76 238 1.42 251 1.34 677 1.31 1.21*1.41<br />
54 Economically inactive 169 1.68 444 1.28 6 2.24 87 0.95 261 0.94 967 1.18 1.11*1.26<br />
1 54 All categories 2 645 1.00 3 231 1.00 45 1.00 2 996 1.00 5 560 1.00 14 477 1.00 Ref.<br />
Obs observed number of cases; SIR st<strong>and</strong>ardised incidence ratio; 95% CI 95% confidence interval.
Acta Oncol Downloaded from informahealthcare.com by 212.35.100.66 on 04/06/11<br />
For personal use only.<br />
Table 5. Observed number of lip <strong>cancer</strong> among women in the Nordic countries <strong>and</strong> st<strong>and</strong>ardised incidence ratios 1961 2005, by country<br />
<strong>and</strong> occupational category.<br />
Denmark Finl<strong>and</strong> Icel<strong>and</strong> Norway Sweden Total<br />
No <strong>Occupation</strong>al category Obs SIR Obs SIR Obs SIR Obs SIR Obs SIR Obs SIR 95% CI<br />
1 Technical workers, etc [1.17] 0.00 4 1.33 [0.02] 0.00 1 1.63 6 1.08 11 1.06 0.53*1.90<br />
2 Laboratory assistants [0.82] 0.00 1 0.54 [0.03] 0.00 [0.77] 0.00 1 0.64 2 0.40 0.05*1.44<br />
3 Physicians [0.41] 0.00 1 1.49 [0.00] 0.00 [0.31] 0.00 1 0.79 2 0.75 0.09*2.72<br />
4 Dentists [0.35] 0.00 [1.17] 0.00 [0.00] 0.00 [0.26] 0.00 1 1.00 1 0.36 0.01*2.00<br />
5 Nurses 6 0.83 12 1.28 [0.13] 0.00 5 0.83 21 1.24 44 1.11 0.81*1.49<br />
6 Assistant nurses 12 2.44 11 0.96 [0.18] 0.00 7 1.17 34 1.17 64 1.24 0.95*1.58<br />
7 ‘‘Other health workers’’ 2 0.48 7 0.82 [0.04] 0.00 8 1.35 18 1.82 35 1.23 0.86*1.71<br />
8 Teachers 15 1.68 14 0.70 [0.22] 0.00 7 0.62 36 0.95 72 0.92 0.72*1.16<br />
9 Religious workers etc 1 0.83 5 0.77 [0.03] 0.00 3 1.05 8 0.64 17 0.74 0.43*1.18<br />
10 Artistic workers 1 1.53 [1.41] 0.00 [0.03] 0.00 [0.86] 0.00 2 0.83 3 0.56 0.12*1.64<br />
11 Journalists [0.13] 0.00 1 1.01 [0.01] 0.00 [0.23] 0.00 2 1.79 3 1.22 0.25*3.55<br />
12 Administrators 2 0.53 5 1.58 1 38.52 1 0.35 6 1.08 15 0.97 0.54*1.60<br />
13 Clerical workers 34 0.97 46 0.76 [0.68] 0.00 24 0.68 108 1.17 212 0.94 0.83*1.08<br />
14 Sales agents 2 5.96 9 0.81 [0.08] 0.00 6 1.14 12 0.89 29 0.96 0.64*1.38<br />
15 Shop workers 20 0.81 31 0.80 [0.48] 0.00 36 1.19 59 1.02 146 0.96 0.81*1.13<br />
16 Farmers 7 0.39 40 1.25 [0.40] 0.00 21 0.96 [5.37] 0.00 68 0.88 0.68*1.12<br />
17 Gardeners 2 0.88 102 1.18 [0.01] 0.00 16 1.24 16 1.07 136 1.17 0.99*1.38<br />
18 Fishermen [0.09] 0.00 [0.17] 0.00 [0.01] 0.00 1 6.40 [0.05] 0.00 1 2.09 0.05*11.65<br />
19 Forestry workers [0.02] 0.00 [0.31] 0.00 [0.00] 0.00 [0.23] 0.00 [0.33] 0.00 [0.90] 0.00 0.00*4.12<br />
20 Miners <strong>and</strong> quarry workers [0.00] 0.00 [0.15] 0.00 [0.00] 0.00 [0.01] 0.00 [0.08] 0.00 [0.24] 0.00 0.00*15.42<br />
21 Seamen [0.02] 0.00 [0.04] 0.00 [0.01] 0.00 [0.07] 0.00 0.00*55.30<br />
22 Transport workers [0.02] 0.00 1 0.45 [0.02] 0.00 [0.16] 0.00 3 3.33 4 1.20 0.33*3.06<br />
23 Drivers 1 1.67 [0.77] 0.00 [0.01] 0.00 [0.61] 0.00 3 1.36 4 0.95 0.26*2.44<br />
24 Postal workers 2 1.55 6 0.49 [0.16] 0.00 12 1.74 16 0.99 36 0.98 0.68*1.35<br />
25 Textile workers 5 0.62 29 1.00 [0.34] 0.00 7 0.61 38 1.11 79 0.95 0.76*1.19<br />
26 Shoe <strong>and</strong> leather workers [0.58] 0.00 3 0.85 [0.02] 0.00 [0.80] 0.00 [2.58] 0.00 3 0.40 0.08*1.17<br />
27 Smelting workers [0.14] 0.00 [0.85] 0.00 [0.00] 0.00 [0.09] 0.00 [0.68] 0.00 [1.75] 0.00 0.00*2.10<br />
28 Mechanics 1 0.74 3 0.90 [0.00] 0.00 [0.96] 0.00 4 0.58 8 0.64 0.28*1.26<br />
29 Plumbers [0.02] 0.00 [0.01] 0.00 [0.01] 0.00 [0.01] 0.00 [0.04] 0.00 0.00*93.16<br />
30 Welders [0.21] 0.00 [0.00] 0.00 [0.07] 0.00 [0.26] 0.00 [0.54] 0.00 0.00*6.86<br />
31 Electrical workers 1 0.53 2 1.20 [0.00] 0.00 2 1.96 2 0.52 7 0.83 0.34*1.72<br />
32 Wood workers [0.64] 0.00 8 1.05 [0.00] 0.00 [0.35] 0.00 2 1.75 10 1.03 0.49*1.89<br />
33 Painters [0.02] 0.00 2 2.41 [0.00] 0.00 [0.08] 0.00 [0.31] 0.00 2 1.61 0.20*5.82<br />
34 ‘‘Other construction workers’’ [0.02] 0.00 6 1.79 [0.00] 0.00 [0.03] 0.00 [0.04] 0.00 6 1.74 0.64*3.79<br />
35 Bricklayers [0.00] 0.00 [0.10] 0.00 [0.00] 0.00 [0.00] 0.00 [0.11] 0.00 0.00*34.41<br />
36 Printers 1 1.38 3 0.88 [0.03] 0.00 2 2.12 4 1.39 10 1.25 0.60*2.31<br />
37 Chemical process workers [1.16] 0.00 4 2.15 [0.01] 0.00 2 2.38 1 0.43 7 1.13 0.45*2.33<br />
38 Food workers 4 0.70 9 0.89 1 1.58 10 1.80 8 1.14 32 1.10 0.75*1.56<br />
39 Beverage workers [0.51] 0.00 [0.59] 0.00 [0.00] 0.00 [0.05] 0.00 1 2.27 1 0.63 0.02*3.49<br />
40 Tobacco workers 2 2.81 [0.34] 0.00 [0.19] 0.00 [0.27] 0.00 2 1.33 0.16*4.80<br />
41 Glass makers etc [1.35] 0.00 8 1.20 [0.02] 0.00 3 1.67 10 1.63 21 1.31 0.81*2.01<br />
42 Packers 1 2.52 16 1.34 [0.07] 0.00 5 1.15 6 0.65 28 1.07 0.71*1.55<br />
43 Engine operators [0.01] 0.00 5 2.76 [0.00] 0.00 [0.06] 0.00 1 1.76 6 2.45 0.90*5.33<br />
44 Public safety workers [0.04] 0.00 1 2.45 [0.01] 0.00 [0.58] 0.00 1 1.33 2 1.11 0.13*4.02<br />
45 Cooks <strong>and</strong> stewards [0.02] 0.00 13 0.96 [0.26] 0.00 7 1.09 8 0.58 28 0.82 0.55*1.19<br />
46 Domestic assistants 18 1.96 16 1.24 [0.08] 0.00 20 1.22 37 1.04 91 1.23 0.99*1.51<br />
47 Waiters 2 1.37 2 0.19 [0.02] 0.00 7 1.05 15 1.05 26 0.79 0.52*1.16<br />
48 Building caretakers 30 1.14 59 1.22 [0.51] 0.00 21 0.73 45 1.23 155 1.10 0.94*1.29<br />
49 Chimney sweeps [0.00] 0.00 [0.02] 0.00 [0.00] 0.00 [0.00] 0.00 [0.03] 0.00 0.00*125.55<br />
50 Hairdressers 1 0.62 2 0.52 [0.02] 0.00 [1.70] 0.00 6 1.01 9 0.69 0.31*1.30<br />
51 Launderers 2 0.67 3 0.72 [0.08] 0.00 3 1.20 5 0.67 13 0.75 0.40*1.29<br />
52 Military personnel [0.01] 0.00 [0.02] 0.00 [0.01] 0.00 [0.02] 0.00 [0.06] 0.00 0.00*59.73<br />
53 ‘‘Other workers’’ 11 1.48 13 0.93 [0.47] 0.00 13 0.88 20 1.23 57 1.08 0.81*1.39<br />
54 Economically inactive 208 1.01 365 1.01 5 2.71 204 1.04 718 0.96 1 500 0.99 0.94*1.04<br />
1 54 All categories 394 1.00 868 1.00 7 1.00 454 1.00 1 285 1.00 3 008 1.00 Ref.<br />
Obs observed number of cases; SIR st<strong>and</strong>ardised incidence ratio; 95% CI 95% confidence interval.<br />
<strong>Occupation</strong> <strong>and</strong> <strong>cancer</strong> in Nordic countries 661
Acta Oncol Downloaded from informahealthcare.com by 212.35.100.66 on 04/06/11<br />
For personal use only.<br />
662 E. Pukkala et al.<br />
men. A small increase has been seen during the<br />
period.<br />
Consistently high SIRs for men were observed<br />
among waiters (SIR 4.43, 3.18 6.01), beverage<br />
manufacturing workers, cooks <strong>and</strong> stewards, hairdressers,<br />
<strong>and</strong> artistic workers (Table 6). The Nordic<br />
combined SIR was elevated for journalists, based<br />
on elevations in Finl<strong>and</strong>, Norway <strong>and</strong> Sweden. Seamen<br />
had elevated risks in Denmark <strong>and</strong> Norway.<br />
Low SIRs were observed among male farmers (0.51,<br />
0.45 0.57), gardeners, forestry workers, teachers<br />
<strong>and</strong> fishermen.<br />
High SIRs among women were seen in artistic<br />
workers (driven by 4 cases in Denmark) <strong>and</strong> waiters<br />
(Table 7). Clerical workers also had a significant<br />
excess, driven by Sweden <strong>and</strong> Denmark. In Sweden<br />
there were seven cases of tongue <strong>cancer</strong> among<br />
chemical process workers (which was not observed<br />
among males). Consistently low SIRs were observed<br />
among nurses (0.69, 0.49 0.95) <strong>and</strong> launderers<br />
<strong>and</strong> dry cleaning workers (0.50, 0.24 0.93).<br />
Comment. Both tobacco <strong>and</strong> alcohol are established<br />
risk factors, while the consumption of fruit <strong>and</strong>/or<br />
vegetables has frequently been seen to reduce risk<br />
[50]. Infection with human papilloma virus entails<br />
an increased risk. There are no established occupational<br />
risk factors for <strong>cancer</strong> of the tongue, although<br />
it cannot be excluded that exposure to inhaled<br />
organic or inorganic dust may play a role. The<br />
high risk groups identified in the present study are<br />
mostly groups where smoking <strong>and</strong> drinking prevalence<br />
also has been shown to be high.. For male<br />
hairdressers <strong>and</strong> female chemical process workers,<br />
it is possible that occupational exposures contribute<br />
to risk.<br />
/ 100 000<br />
2<br />
1.5<br />
1<br />
.5<br />
Denmark<br />
Finl<strong>and</strong><br />
Icel<strong>and</strong><br />
Norway<br />
Sweden<br />
Men<br />
0<br />
1945 1960 1975 1990 2005<br />
/ 100 000<br />
Cancer of the salivary gl<strong>and</strong>s<br />
Cancer in the salivary gl<strong>and</strong>s, mainly seen in the<br />
parotid gl<strong>and</strong>, is rare. The rates have been stable<br />
through the period both among men <strong>and</strong> women,<br />
with the exception of higher rates seen among Danish<br />
men <strong>and</strong> women during the 1960s (Figure 14).<br />
At the combined Nordic level no male occupation<br />
had a significantly elevated risk. At the national level,<br />
physicians in Norway (SIR 2.91, 95% CI 1.26 5.73)<br />
<strong>and</strong> dentists in Denmark (4.61, 1.26 11.81) had<br />
high SIRs. Forestry workers, wood workers, <strong>and</strong><br />
smelter <strong>and</strong> metal foundry workers all had low risks<br />
(Table 8).<br />
Among women, clerical workers had a combined<br />
SIR of 1.14 (1.02 1.28), driven by the large number<br />
of cases in Sweden. Consistently low SIRs were seen<br />
in the group of other health <strong>and</strong> medical workers<br />
(Table 9).<br />
Comment. Therapeutic <strong>and</strong> diagnostic radiation <strong>and</strong><br />
UV radiation to the head <strong>and</strong> neck are established<br />
risk factors for <strong>cancer</strong> of the salivary gl<strong>and</strong>s [50].<br />
Alcohol, tobacco, <strong>and</strong> viral infections play a minor<br />
role, if any. The observed occupational variations in<br />
risk are most probably due to chance.<br />
Cancer of the oral cavity<br />
In both men <strong>and</strong> women, <strong>cancer</strong> of the mouth<br />
has increased by approximately 50% in Finl<strong>and</strong>,<br />
Norway <strong>and</strong> Sweden, <strong>and</strong> with 200% in Denmark<br />
(Figure 15).<br />
Among men, elevated risks were seen for waiters<br />
(SIR 5.05, 95% CI 3.91 6.41), cooks <strong>and</strong> stewards,<br />
seamen, journalists <strong>and</strong> artistic workers. Low risks<br />
were observed for farmers (0.55, 0.50 0.60), gardeners,<br />
teachers <strong>and</strong> forestry workers (Table 10).<br />
2<br />
1.5<br />
1<br />
.5<br />
Denmark<br />
Finl<strong>and</strong><br />
Icel<strong>and</strong><br />
Norway<br />
Sweden<br />
Women<br />
0<br />
1945 1960 1975 1990 2005<br />
Figure 14. Age st<strong>and</strong>ardised (World) incidence rates for <strong>cancer</strong> of the salivary gl<strong>and</strong>s 1943 2005, by country <strong>and</strong> gender. Modified from<br />
NORDCAN [49].
Acta Oncol Downloaded from informahealthcare.com by 212.35.100.66 on 04/06/11<br />
For personal use only.<br />
Table 6. Observed number of <strong>cancer</strong> of the tongue among men in the Nordic countries <strong>and</strong> st<strong>and</strong>ardised incidence ratios 1961 2005, by<br />
country <strong>and</strong> occupational category.<br />
Denmark Finl<strong>and</strong> Icel<strong>and</strong> Norway Sweden Total<br />
No <strong>Occupation</strong>al category Obs SIR Obs SIR Obs SIR Obs SIR Obs SIR Obs SIR 95% CI<br />
1 Technical workers, etc 46 0.74 59 0.85 [0.56] 0.00 40 0.76 191 0.87 336 0.83 0.75*0.92<br />
2 Laboratory assistants 2 1.65 4 2.21 [0.11] 0.00 1 0.42 2 1.30 9 1.28 0.58*2.42<br />
3 Physicians 3 0.63 4 1.00 [0.20] 0.00 8 1.26 12 1.13 27 1.04 0.68*1.51<br />
4 Dentists 1 0.65 3 3.72 [0.05] 0.00 3 1.07 9 1.84 16 1.59 0.91*2.57<br />
5 Nurses [0.08] 0.00 [0.32] 0.00 [0.00] 0.00 [0.44] 0.00 [1.00] 0.00 [1.85] 0.00 0.00*2.00<br />
6 Assistant nurses 1 0.65 [0.32] 0.00 [0.03] 0.00 [1.01] 0.00 5 1.24 6 0.87 0.32*1.88<br />
7 ‘‘Other health workers’’ 1 0.24 2 0.55 [0.06] 0.00 4 1.61 8 0.93 15 0.79 0.44*1.31<br />
8 Teachers 17 0.61 18 0.66 1 1.30 14 0.37 46 0.77 96 0.63 0.51*0.76<br />
9 Religious workers etc 11 1.10 17 1.02 [0.51] 0.00 15 0.82 44 0.91 87 0.93 0.74*1.15<br />
10 Artistic workers 9 2.79 9 1.69 1 7.11 9 1.74 28 2.07 56 2.05 1.55*2.66<br />
11 Journalists 1 0.62 7 2.73 [0.08] 0.00 3 1.26 13 2.04 24 1.84 1.18*2.75<br />
12 Administrators 71 1.12 40 1.01 2 1.66 72 1.17 93 1.20 278 1.14 1.02*1.29<br />
13 Clerical workers 23 0.78 20 0.81 2 1.42 61 1.33 89 1.04 195 1.04 0.90*1.20<br />
14 Sales agents 16 1.01 40 1.08 1 1.42 58 1.12 165 1.30 280 1.21 1.07*1.35<br />
15 Shop workers 66 1.06 27 1.57 [0.51] 0.00 21 0.96 59 1.45 173 1.21 1.05*1.41<br />
16 Farmers 36 0.33 107 0.77 3 1.52 58 0.46 79 0.44 283 0.51 0.45*0.57<br />
17 Gardeners 11 0.71 15 0.64 [0.07] 0.00 20 0.62 36 0.51 82 0.58 0.46*0.71<br />
18 Fishermen 4 0.65 1 0.52 2 1.44 27 0.65 6 0.80 40 0.68 0.49*0.93<br />
19 Forestry workers [2.21] 0.00 26 0.94 [0.01] 0.00 16 0.69 20 0.38 62 0.59 0.45*0.76<br />
20 Miners <strong>and</strong> quarry workers [0.70] 0.00 4 0.87 [0.02] 0.00 7 0.97 12 0.88 23 0.88 0.56*1.32<br />
21 Seamen 17 2.33 5 0.79 [0.35] 0.00 72 1.86 14 1.14 108 1.66 1.38*2.01<br />
22 Transport workers 9 0.65 15 0.88 [0.65] 0.00 20 1.06 37 0.92 81 0.89 0.71*1.11<br />
23 Drivers 50 1.04 74 1.21 1 0.99 77 1.37 115 1.07 317 1.16 1.04*1.29<br />
24 Postal workers 7 0.69 11 1.21 [0.12] 0.00 12 1.15 25 1.08 55 1.04 0.78*1.35<br />
25 Textile workers 9 1.21 7 1.30 [0.21] 0.00 7 0.68 27 1.18 50 1.08 0.80*1.43<br />
26 Shoe <strong>and</strong> leather workers 2 1.16 1 0.43 [0.04] 0.00 7 1.66 11 1.28 21 1.24 0.77*1.90<br />
27 Smelting workers 19 0.98 5 0.58 [0.30] 0.00 13 0.87 41 1.08 78 0.96 0.76*1.20<br />
28 Mechanics 59 1.16 56 0.90 [1.00] 0.00 80 1.02 173 0.90 368 0.96 0.86*1.06<br />
29 Plumbers 5 1.06 11 1.04 [0.16] 0.00 9 0.96 21 0.95 46 0.98 0.72*1.31<br />
30 Welders 16 1.42 [0.06] 0.00 11 1.00 31 1.16 58 1.18 0.90*1.53<br />
31 Electrical workers 14 1.07 17 0.61 1 1.61 36 1.03 76 1.10 144 0.99 0.84*1.16<br />
32 Wood workers 25 0.75 40 0.71 1 1.86 64 0.78 78 0.66 208 0.72 0.63*0.82<br />
33 Painters 12 1.06 20 1.57 1 4.76 14 1.01 46 1.31 93 1.27 1.03*1.56<br />
34 ‘‘Other construction workers’’ 43 1.13 39 1.06 1 0.86 19 1.08 72 1.12 174 1.10 0.95*1.28<br />
35 Bricklayers 17 1.40 8 1.36 15 1.85 15 0.99 55 1.33 1.00*1.73<br />
36 Printers 9 1.07 6 0.89 [0.18] 0.00 16 1.72 27 1.32 58 1.28 0.98*1.66<br />
37 Chemical process workers 7 1.06 13 1.28 [0.10] 0.00 18 1.00 32 1.12 70 1.10 0.86*1.39<br />
38 Food workers 24 1.05 5 0.69 1 1.17 24 1.14 34 1.17 88 1.08 0.87*1.33<br />
39 Beverage workers 11 4.03 [0.45] 0.00 [0.01] 0.00 [0.36] 0.00 7 4.34 18 3.49 2.07*5.51<br />
40 Tobacco workers 2 5.35 [0.08] 0.00 [0.00] 0.00 [0.31] 0.00 1 7.14 3 3.31 0.68*9.67<br />
41 Glass makers etc 10 0.77 12 1.11 [0.16] 0.00 9 0.82 33 1.01 64 0.95 0.73*1.21<br />
42 Packers 15 1.38 27 1.30 [0.49] 0.00 49 1.56 82 1.44 173 1.44 1.24*1.67<br />
43 Engine operators 13 1.03 33 1.06 1 1.45 21 1.01 42 0.81 110 0.94 0.78*1.13<br />
44 Public safety workers 5 0.46 13 0.76 [0.47] 0.00 16 1.16 29 0.92 63 0.86 0.66*1.09<br />
45 Cooks <strong>and</strong> stewards 6 6.02 3 2.27 1 4.22 13 1.90 17 2.74 40 2.56 1.83*3.49<br />
46 Domestic assistants [0.01] 0.00 [0.06] 0.00 [0.00] 0.00 [0.07] 0.00 2 2.67 2 2.26 0.27*8.16<br />
47 Waiters 11 5.62 4 2.97 [0.03] 0.00 13 4.64 13 4.16 41 4.43 3.18*6.01<br />
48 Building caretakers 13 1.17 12 0.90 [0.19] 0.00 9 1.22 23 0.98 57 1.03 0.78*1.33<br />
49 Chimney sweeps 1 2.94 [0.99] 0.00 2 2.73 3 1.71 6 1.57 0.58*3.42<br />
50 Hairdressers 7 2.24 [0.30] 0.00 [0.03] 0.00 5 2.46 12 2.16 24 2.17 1.39*3.23<br />
51 Launderers [1.54] 0.00 1 3.28 [0.02] 0.00 [1.19] 0.00 3 0.76 4 0.57 0.16*1.46<br />
52 Military personnel 7 0.99 5 0.77 12 0.96 20 1.11 44 1.00 0.72*1.34<br />
53 ‘‘Other workers’’ 76 2.06 28 1.75 1 0.55 46 0.80 66 0.96 217 1.20 1.05*1.37<br />
54 Economically inactive 49 1.84 111 1.46 2 1.39 55 1.69 184 1.59 401 1.59 1.44*1.75<br />
1 54 All categories 873 1.00 1 001 1.00 23 1.00 1 201 1.00 2 329 1.00 5 427 1.00 Ref.<br />
Obs observed number of cases; SIR st<strong>and</strong>ardised incidence ratio; 95% CI 95% confidence interval.<br />
<strong>Occupation</strong> <strong>and</strong> <strong>cancer</strong> in Nordic countries 663
Acta Oncol Downloaded from informahealthcare.com by 212.35.100.66 on 04/06/11<br />
For personal use only.<br />
664 E. Pukkala et al.<br />
Table 7. Observed number of <strong>cancer</strong> of the tongue among women in the Nordic countries <strong>and</strong> st<strong>and</strong>ardised incidence ratios 1961 2005,<br />
by country <strong>and</strong> occupational category.<br />
Denmark Finl<strong>and</strong> Icel<strong>and</strong> Norway Sweden Total<br />
No <strong>Occupation</strong>al category Obs SIR Obs SIR Obs SIR Obs SIR Obs SIR Obs SIR 95% CI<br />
1 Technical workers, etc 5 3.01 3 0.59 [0.05] 0.00 [0.97] 0.00 3 0.42 11 0.73 0.37*1.31<br />
2 Laboratory assistants 1 0.81 2 0.72 [0.06] 0.00 1 0.86 1 0.41 5 0.65 0.21*1.52<br />
3 Physicians [0.55] 0.00 1 0.78 [0.01] 0.00 [0.48] 0.00 2 1.14 3 0.74 0.15*2.15<br />
4 Dentists [0.49] 0.00 3 2.41 [0.01] 0.00 2 4.91 1 0.79 6 1.76 0.65*3.83<br />
5 Nurses 9 0.93 9 0.64 [0.35] 0.00 8 0.86 12 0.56 38 0.69 0.49*0.95<br />
6 Assistant nurses 4 0.56 17 1.24 [0.49] 0.00 7 0.77 30 0.77 58 0.84 0.64*1.08<br />
7 ‘‘Other health workers’’ 6 1.08 10 0.90 [0.09] 0.00 6 0.66 12 0.91 34 0.87 0.60*1.22<br />
8 Teachers 13 1.04 33 1.32 1 1.70 18 1.02 58 1.15 123 1.16 0.97*1.38<br />
9 Religious workers etc 1 0.60 11 0.82 [0.09] 0.00 1 0.23 18 1.04 31 0.84 0.57*1.19<br />
10 Artistic workers 4 4.77 3 1.41 [0.07] 0.00 2 1.54 4 1.26 13 1.73 0.92*2.96<br />
11 Journalists [0.19] 0.00 1 0.75 [0.02] 0.00 2 5.73 1 0.67 4 1.18 0.32*3.03<br />
12 Administrators 4 0.80 3 0.66 [0.06] 0.00 6 1.38 4 0.54 17 0.80 0.46*1.27<br />
13 Clerical workers 67 1.34 98 1.19 1 0.52 58 1.08 149 1.27 373 1.22 1.10*1.35<br />
14 Sales agents 1 2.25 4 0.34 [0.20] 0.00 9 1.17 17 1.02 31 0.84 0.57*1.20<br />
15 Shop workers 34 1.02 48 1.14 2 1.61 42 0.96 78 1.16 204 1.09 0.95*1.25<br />
16 Farmers 10 0.42 24 0.94 2 2.19 36 1.19 5 0.71 77 0.88 0.70*1.10<br />
17 Gardeners 3 0.99 63 0.87 [0.03] 0.00 14 0.79 15 0.85 95 0.86 0.69*1.05<br />
18 Fishermen [0.12] 0.00 1 5.95 [0.03] 0.00 [0.23] 0.00 [0.06] 0.00 1 1.64 0.04*9.15<br />
19 Forestry workers [0.03] 0.00 [0.32] 0.00 [0.01] 0.00 1 3.12 [0.40] 0.00 1 0.93 0.02*5.16<br />
20 Miners <strong>and</strong> quarry workers [0.00] 0.00 [0.13] 0.00 [0.00] 0.00 [0.02] 0.00 [0.10] 0.00 [0.25] 0.00 0.00*14.66<br />
21 Seamen [0.04] 0.00 [0.00] 0.00 [0.05] 0.00 [0.01] 0.00 [0.11] 0.00 0.00*33.46<br />
22 Transport workers [0.03] 0.00 [2.00] 0.00 [0.03] 0.00 [0.25] 0.00 [1.11] 0.00 [3.43] 0.00 0.00*1.08<br />
23 Drivers 3 3.56 2 1.97 [0.02] 0.00 [0.92] 0.00 2 0.67 7 1.21 0.49*2.49<br />
24 Postal workers 2 1.14 12 0.96 [0.44] 0.00 6 0.57 22 1.13 42 0.94 0.68*1.27<br />
25 Textile workers 10 0.90 26 0.93 [0.80] 0.00 14 0.86 46 1.20 96 1.01 0.82*1.24<br />
26 Shoe <strong>and</strong> leather workers 1 1.21 2 0.58 [0.04] 0.00 2 1.74 [2.88] 0.00 5 0.60 0.19*1.40<br />
27 Smelting workers [0.20] 0.00 2 2.48 [0.00] 0.00 [0.14] 0.00 [0.87] 0.00 2 0.99 0.12*3.57<br />
28 Mechanics 1 0.50 [3.74] 0.00 [0.01] 0.00 2 1.42 10 1.16 13 0.82 0.44*1.41<br />
29 Plumbers [0.02] 0.00 [0.01] 0.00 [0.01] 0.00 [0.02] 0.00 [0.05] 0.00 0.00*68.22<br />
30 Welders [0.31] 0.00 [0.00] 0.00 [0.11] 0.00 1 2.78 1 1.29 0.03*7.17<br />
31 Electrical workers 2 0.71 4 1.57 [0.01] 0.00 1 0.67 1 0.21 8 0.68 0.30*1.35<br />
32 Wood workers 1 1.07 10 1.43 [0.01] 0.00 [0.52] 0.00 1 0.67 12 1.21 0.62*2.11<br />
33 Painters [0.04] 0.00 1 1.20 [0.00] 0.00 [0.11] 0.00 [0.39] 0.00 1 0.73 0.02*4.05<br />
34 ‘‘Other construction workers’’ 1 36.64 3 1.10 [0.00] 0.00 [0.05] 0.00 [0.06] 0.00 4 1.40 0.38*3.58<br />
35 Bricklayers [0.01] 0.00 [0.10] 0.00 [0.00] 0.00 [0.00] 0.00 [0.11] 0.00 0.00*34.93<br />
36 Printers 2 1.91 7 1.93 [0.06] 0.00 [1.41] 0.00 7 1.97 16 1.65 0.94*2.68<br />
37 Chemical process workers [1.64] 0.00 [1.82] 0.00 [0.03] 0.00 1 0.82 7 2.53 8 1.07 0.46*2.11<br />
38 Food workers 11 1.36 7 0.74 3 1.92 7 0.89 10 1.22 38 1.08 0.77*1.48<br />
39 Beverage workers 2 2.66 [0.52] 0.00 [0.00] 0.00 [0.07] 0.00 [0.52] 0.00 2 1.07 0.13*3.87<br />
40 Tobacco workers [1.04] 0.00 [0.30] 0.00 [0.28] 0.00 [0.32] 0.00 [1.93] 0.00 0.00*1.91<br />
41 Glass makers etc [1.99] 0.00 7 1.05 [0.04] 0.00 2 0.76 13 1.77 22 1.18 0.74*1.78<br />
42 Packers 2 3.54 13 1.11 1 6.62 7 1.12 12 1.09 35 1.18 0.82*1.64<br />
43 Engine operators [0.02] 0.00 1 0.52 [0.00] 0.00 [0.10] 0.00 [0.79] 0.00 1 0.35 0.01*1.96<br />
44 Public safety workers [0.06] 0.00 [0.48] 0.00 [0.03] 0.00 [0.80] 0.00 [1.09] 0.00 [2.47] 0.00 0.00*1.50<br />
45 Cooks <strong>and</strong> stewards [0.02] 0.00 12 0.89 [0.58] 0.00 11 1.21 16 0.98 39 0.99 0.70*1.35<br />
46 Domestic assistants 9 0.72 16 1.07 [0.17] 0.00 26 1.09 31 0.66 82 0.84 0.66*1.04<br />
47 Waiters 5 2.33 15 1.31 [0.07] 0.00 13 1.35 22 1.36 55 1.39 1.05*1.81<br />
48 Building caretakers 36 1.00 47 1.03 1 0.82 44 1.06 49 1.08 177 1.04 0.90*1.21<br />
49 Chimney sweeps [0.00] 0.00 [0.02] 0.00 [0.01] 0.00 [0.00] 0.00 [0.03] 0.00 0.00*115.41<br />
50 Hairdressers 4 1.79 4 0.90 [0.06] 0.00 4 1.60 10 1.39 22 1.34 0.84*2.03<br />
51 Launderers 1 0.25 1 0.28 [0.21] 0.00 1 0.28 7 0.83 10 0.50 0.24*0.93<br />
52 Military personnel [0.02] 0.00 1 19.70 [0.01] 0.00 [0.04] 0.00 1 8.19 0.21*45.61<br />
53 ‘‘Other workers’’ 13 1.26 21 1.46 2 1.65 18 0.84 17 0.84 71 1.05 0.82*1.33<br />
54 Economically inactive 262 0.97 291 0.97 4 1.00 296 1.02 845 0.97 1 698 0.98 0.94*1.03<br />
1 54 All categories 530 1.00 839 1.00 17 1.00 668 1.00 1 539 1.00 3 593 1.00 Ref.<br />
Obs observed number of cases; SIR st<strong>and</strong>ardised incidence ratio; 95% CI 95% confidence interval.
Acta Oncol Downloaded from informahealthcare.com by 212.35.100.66 on 04/06/11<br />
For personal use only.<br />
Table 8. Observed number of <strong>cancer</strong> of the salivary gl<strong>and</strong>s among men in the Nordic countries <strong>and</strong> st<strong>and</strong>ardised incidence ratios 1961<br />
2005, by country <strong>and</strong> occupational category.<br />
Denmark Finl<strong>and</strong> Icel<strong>and</strong> Norway Sweden Total<br />
No <strong>Occupation</strong>al category Obs SIR Obs SIR Obs SIR Obs SIR Obs SIR Obs SIR 95% CI<br />
1 Technical workers, etc 25 0.71 47 1.26 1 2.63 16 0.74 147 1.01 236 0.98 0.86*1.11<br />
2 Laboratory assistants [0.70] 0.00 1 1.06 [0.07] 0.00 1 0.98 1 1.23 3 0.85 0.17*2.47<br />
3 Physicians 1 0.34 1 0.46 [0.15] 0.00 8 2.91 8 1.16 18 1.21 0.72*1.91<br />
4 Dentists 4 4.61 [0.45] 0.00 [0.04] 0.00 1 0.81 2 0.61 7 1.19 0.48*2.45<br />
5 Nurses [0.04] 0.00 [0.15] 0.00 [0.00] 0.00 [0.15] 0.00 1 1.92 1 1.16 0.03*6.48<br />
6 Assistant nurses 2 2.37 1 7.02 [0.02] 0.00 [0.46] 0.00 2 0.79 5 1.25 0.41*2.92<br />
7 ‘‘Other health workers’’ 6 2.42 1 0.49 [0.05] 0.00 2 1.87 5 0.87 14 1.23 0.67*2.06<br />
8 Teachers 19 1.21 21 1.39 [0.55] 0.00 18 1.15 43 1.12 101 1.18 0.97*1.44<br />
9 Religious workers etc 5 0.77 12 1.40 [0.38] 0.00 6 0.76 34 1.11 57 1.06 0.80*1.37<br />
10 Artistic workers [1.99] 0.00 1 0.34 [0.10] 0.00 3 1.31 13 1.44 17 1.04 0.61*1.67<br />
11 Journalists 1 1.06 [1.42] 0.00 [0.06] 0.00 [1.02] 0.00 6 1.41 7 0.91 0.36*1.87<br />
12 Administrators 38 0.97 30 1.35 [1.04] 0.00 33 1.21 55 1.00 156 1.08 0.92*1.26<br />
13 Clerical workers 32 1.84 15 1.03 1 0.85 17 0.82 65 1.08 130 1.14 0.96*1.36<br />
14 Sales agents 3 0.33 17 0.80 1 1.72 26 1.10 107 1.22 154 1.08 0.92*1.27<br />
15 Shop workers 52 1.32 14 1.49 1 2.52 15 1.58 23 0.82 105 1.21 1.00*1.47<br />
16 Farmers 64 0.84 101 1.08 1 0.58 65 1.02 124 0.87 355 0.94 0.85*1.04<br />
17 Gardeners 4 0.37 12 0.84 [0.06] 0.00 14 0.88 56 1.04 86 0.91 0.73*1.12<br />
18 Fishermen 5 1.39 2 1.59 1 1.06 17 0.83 9 1.58 34 1.06 0.74*1.49<br />
19 Forestry workers 1 0.64 9 0.54 [0.01] 0.00 11 0.94 27 0.69 48 0.69 0.51*0.92<br />
20 Miners <strong>and</strong> quarry workers [0.47] 0.00 4 1.48 [0.01] 0.00 7 2.08 5 0.51 16 0.97 0.56*1.58<br />
21 Seamen 2 0.51 6 1.65 1 3.84 17 0.99 4 0.45 30 0.89 0.60*1.27<br />
22 Transport workers 5 0.60 13 1.26 [0.55] 0.00 9 1.02 45 1.56 72 1.26 0.99*1.59<br />
23 Drivers 27 0.98 30 0.86 2 2.59 22 0.88 73 1.00 154 0.96 0.82*1.12<br />
24 Postal workers 7 1.28 8 1.52 [0.10] 0.00 10 2.10 17 1.06 42 1.33 0.96*1.79<br />
25 Textile workers 5 1.04 3 0.89 [0.18] 0.00 9 1.78 20 1.16 37 1.21 0.85*1.67<br />
26 Shoe <strong>and</strong> leather workers 2 1.68 [1.47] 0.00 [0.04] 0.00 [2.12] 0.00 6 0.89 8 0.69 0.30*1.36<br />
27 Smelting workers 9 0.82 4 0.77 [0.25] 0.00 3 0.43 20 0.72 36 0.71 0.49*0.98<br />
28 Mechanics 23 0.78 36 1.03 1 1.37 25 0.72 129 0.98 214 0.92 0.81*1.06<br />
29 Plumbers 2 0.76 4 0.68 [0.12] 0.00 3 0.74 11 0.72 20 0.72 0.44*1.11<br />
30 Welders 3 0.51 [0.04] 0.00 8 1.73 9 0.51 20 0.71 0.44*1.10<br />
31 Electrical workers 8 1.13 11 0.73 1 2.28 18 1.16 59 1.28 97 1.15 0.94*1.41<br />
32 Wood workers 18 0.89 30 0.86 1 2.32 39 1.01 65 0.75 153 0.85 0.72*0.99<br />
33 Painters 4 0.61 10 1.31 [0.17] 0.00 2 0.31 23 0.91 39 0.85 0.60*1.16<br />
34 ‘‘Other construction workers’’ 25 0.99 20 0.88 2 2.30 4 0.51 44 0.94 95 0.92 0.74*1.12<br />
35 Bricklayers 12 1.64 1 0.27 6 1.56 9 0.81 28 1.08 0.72*1.56<br />
36 Printers 4 0.84 3 0.81 [0.13] 0.00 9 2.20 14 1.01 30 1.13 0.76*1.61<br />
37 Chemical process workers 4 0.94 6 1.03 [0.08] 0.00 7 0.81 19 0.91 36 0.91 0.64*1.26<br />
38 Food workers 14 1.01 2 0.47 [0.70] 0.00 9 0.91 28 1.33 53 1.06 0.80*1.39<br />
39 Beverage workers 1 0.60 1 3.77 [0.01] 0.00 [0.12] 0.00 2 1.68 4 1.22 0.33*3.14<br />
40 Tobacco workers [0.27] 0.00 [0.05] 0.00 [0.00] 0.00 [0.15] 0.00 [0.10] 0.00 [0.57] 0.00 0.00*6.49<br />
41 Glass makers etc 3 0.37 5 0.81 [0.12] 0.00 2 0.41 31 1.34 41 0.97 0.69*1.31<br />
42 Packers 10 1.38 8 0.64 [0.41] 0.00 14 0.94 36 0.86 68 0.89 0.69*1.12<br />
43 Engine operators 10 1.34 13 0.75 [0.51] 0.00 11 1.24 34 0.95 68 0.97 0.76*1.23<br />
44 Public safety workers 11 1.66 4 0.41 1 2.72 6 0.94 23 1.09 45 1.02 0.74*1.36<br />
45 Cooks <strong>and</strong> stewards 1 1.82 [0.69] 0.00 [0.17] 0.00 3 1.02 5 1.26 9 1.08 0.50*2.06<br />
46 Domestic assistants [0.01] 0.00 [0.04] 0.00 [0.00] 0.00 [0.03] 0.00 [0.41] 0.00 [0.48] 0.00 0.00*7.67<br />
47 Waiters 2 1.77 1 1.49 [0.02] 0.00 2 1.61 4 1.95 9 1.76 0.80*3.34<br />
48 Building caretakers 11 1.51 5 0.62 [0.17] 0.00 4 1.21 19 1.15 39 1.10 0.79*1.51<br />
49 Chimney sweeps [0.19] 0.00 [0.59] 0.00 [0.33] 0.00 1 0.83 1 0.43 0.01*2.40<br />
50 Hairdressers 4 1.95 [0.18] 0.00 [0.02] 0.00 [0.96] 0.00 3 0.73 7 0.96 0.39*1.98<br />
51 Launderers [1.02] 0.00 [0.18] 0.00 [0.02] 0.00 [0.56] 0.00 2 0.69 2 0.43 0.05*1.54<br />
52 Military personnel 3 0.81 4 1.16 6 1.07 11 0.90 24 0.96 0.62*1.43<br />
53 ‘‘Other workers’’ 26 1.16 16 1.66 1 0.66 32 1.15 52 1.03 127 1.14 0.95*1.35<br />
54 Economically inactive 27 1.20 61 1.18 2 1.95 13 0.84 91 1.13 194 1.13 0.98*1.30<br />
1 54 All categories 542 1.00 597 1.00 18 1.00 553 1.00 1 642 1.00 3 352 1.00 Ref.<br />
Obs observed number of cases; SIR st<strong>and</strong>ardised incidence ratio; 95% CI 95% confidence interval.<br />
<strong>Occupation</strong> <strong>and</strong> <strong>cancer</strong> in Nordic countries 665
Acta Oncol Downloaded from informahealthcare.com by 212.35.100.66 on 04/06/11<br />
For personal use only.<br />
666 E. Pukkala et al.<br />
Table 9. Observed number of <strong>cancer</strong> of the salivary gl<strong>and</strong>s among women in the Nordic countries <strong>and</strong> st<strong>and</strong>ardised incidence ratios 1961<br />
2005, by country <strong>and</strong> occupational category.<br />
Denmark Finl<strong>and</strong> Icel<strong>and</strong> Norway Sweden Total<br />
No <strong>Occupation</strong>al category Obs SIR Obs SIR Obs SIR Obs SIR Obs SIR Obs SIR 95% CI<br />
1 Technical workers, etc [1.35] 0.00 3 0.82 [0.05] 0.00 1 1.50 9 1.25 13 1.01 0.54*1.72<br />
2 Laboratory assistants [0.97] 0.00 3 1.53 [0.07] 0.00 2 2.46 1 0.44 6 0.98 0.36*2.14<br />
3 Physicians [0.46] 0.00 1 1.10 [0.01] 0.00 [0.34] 0.00 2 1.17 3 0.88 0.18*2.56<br />
4 Dentists [0.40] 0.00 [0.88] 0.00 [0.00] 0.00 1 3.51 2 1.60 3 1.06 0.22*3.11<br />
5 Nurses 8 1.00 7 0.70 1 3.53 8 1.24 22 1.03 46 1.00 0.73*1.33<br />
6 Assistant nurses 6 1.05 3 0.31 [0.36] 0.00 8 1.28 32 0.83 49 0.81 0.60*1.07<br />
7 ‘‘Other health workers’’ 2 0.43 4 0.50 [0.08] 0.00 5 0.79 9 0.69 20 0.63 0.38*0.97<br />
8 Teachers 7 0.69 15 0.84 [0.52] 0.00 10 0.82 52 1.07 84 0.94 0.75*1.17<br />
9 Religious workers etc [1.37] 0.00 12 1.26 [0.08] 0.00 5 1.69 11 0.66 28 0.91 0.61*1.32<br />
10 Artistic workers [0.71] 0.00 1 0.66 [0.06] 0.00 1 1.11 2 0.64 4 0.63 0.17*1.62<br />
11 Journalists [0.15] 0.00 1 1.05 [0.02] 0.00 [0.24] 0.00 1 0.68 2 0.71 0.09*2.55<br />
12 Administrators 4 0.95 2 0.62 [0.04] 0.00 2 0.68 8 1.12 16 0.91 0.52*1.48<br />
13 Clerical workers 45 1.10 58 0.99 2 1.34 42 1.11 145 1.23 292 1.14 1.02*1.28<br />
14 Sales agents [0.38] 0.00 9 1.08 [0.14] 0.00 6 1.14 15 0.90 30 0.98 0.66*1.39<br />
15 Shop workers 30 1.07 24 0.81 [0.88] 0.00 28 0.91 68 0.97 150 0.94 0.80*1.10<br />
16 Farmers 17 0.86 15 0.83 1 1.78 24 1.20 6 0.89 63 0.97 0.74*1.24<br />
17 Gardeners 5 1.96 53 1.03 [0.02] 0.00 15 1.26 22 1.21 95 1.13 0.92*1.39<br />
18 Fishermen [0.10] 0.00 1 8.40 [0.03] 0.00 [0.16] 0.00 [0.06] 0.00 1 2.14 0.05*11.93<br />
19 Forestry workers [0.03] 0.00 [0.22] 0.00 [0.00] 0.00 [0.22] 0.00 1 2.47 1 1.13 0.03*6.32<br />
20 Miners <strong>and</strong> quarry workers [0.00] 0.00 [0.09] 0.00 [0.01] 0.00 [0.10] 0.00 [0.21] 0.00 0.00*17.97<br />
21 Seamen [0.03] 0.00 [0.00] 0.00 [0.04] 0.00 [0.01] 0.00 [0.08] 0.00 0.00*45.06<br />
22 Transport workers [0.03] 0.00 [1.43] 0.00 [0.02] 0.00 [0.17] 0.00 1 0.85 1 0.35 0.01*1.97<br />
23 Drivers [0.69] 0.00 1 1.39 [0.01] 0.00 [0.63] 0.00 1 0.34 2 0.40 0.05*1.45<br />
24 Postal workers [1.46] 0.00 10 1.13 1 3.55 5 0.68 23 1.15 39 1.03 0.73*1.41<br />
25 Textile workers 12 1.30 15 0.75 [0.41] 0.00 9 0.78 31 0.77 67 0.82 0.64*1.05<br />
26 Shoe <strong>and</strong> leather workers [0.68] 0.00 2 0.82 [0.02] 0.00 1 1.21 3 0.97 6 0.85 0.31*1.85<br />
27 Smelting workers [0.16] 0.00 2 3.50 [0.00] 0.00 [0.10] 0.00 1 1.14 3 1.75 0.36*5.12<br />
28 Mechanics 4 2.47 3 1.13 [0.01] 0.00 1 0.99 5 0.56 13 0.92 0.49*1.57<br />
29 Plumbers [0.02] 0.00 [0.01] 0.00 [0.01] 0.00 [0.01] 0.00 [0.05] 0.00 0.00*79.95<br />
30 Welders [0.22] 0.00 [0.00] 0.00 [0.08] 0.00 1 2.83 1 1.54 0.04*8.60<br />
31 Electrical workers 1 0.44 [1.82] 0.00 [0.00] 0.00 [1.10] 0.00 1 0.20 2 0.20 0.02*0.71<br />
32 Wood workers [0.76] 0.00 5 1.01 [0.01] 0.00 1 2.75 1 0.67 7 0.92 0.37*1.90<br />
33 Painters [0.03] 0.00 [0.60] 0.00 [0.00] 0.00 [0.08] 0.00 1 2.52 1 0.91 0.02*5.05<br />
34 ‘‘Other construction workers’’ [0.02] 0.00 4 2.04 [0.00] 0.00 [0.03] 0.00 [0.05] 0.00 4 1.93 0.53*4.94<br />
35 Bricklayers [0.00] 0.00 [0.07] 0.00 [0.00] 0.00 [0.00] 0.00 [0.08] 0.00 0.00*47.70<br />
36 Printers [0.85] 0.00 3 1.16 [0.04] 0.00 [1.00] 0.00 4 1.09 7 0.86 0.35*1.77<br />
37 Chemical process workers 1 0.74 1 0.78 [0.01] 0.00 1 1.13 1 0.35 4 0.62 0.17*1.59<br />
38 Food workers 5 0.75 4 0.60 1 1.02 3 0.54 5 0.59 18 0.63 0.38*1.00<br />
39 Beverage workers 2 3.25 [0.37] 0.00 [0.00] 0.00 [0.05] 0.00 2 3.75 4 2.56 0.70*6.55<br />
40 Tobacco workers [0.85] 0.00 [0.21] 0.00 1 4.98 [0.33] 0.00 1 0.63 0.02*3.51<br />
41 Glass makers etc [1.60] 0.00 4 0.84 [0.03] 0.00 2 1.06 7 0.91 13 0.82 0.43*1.40<br />
42 Packers 1 2.15 6 0.72 [0.08] 0.00 5 1.13 9 0.79 21 0.85 0.52*1.30<br />
43 Engine operators [0.01] 0.00 1 0.73 [0.00] 0.00 [0.07] 0.00 [0.77] 0.00 1 0.45 0.01*2.50<br />
44 Public safety workers [0.05] 0.00 [0.34] 0.00 [0.02] 0.00 [0.53] 0.00 1 0.95 1 0.50 0.01*2.81<br />
45 Cooks <strong>and</strong> stewards [0.02] 0.00 11 1.14 1 3.25 6 0.96 18 1.08 36 1.10 0.77*1.52<br />
46 Domestic assistants 18 1.73 6 0.57 [0.08] 0.00 17 1.04 45 0.98 86 1.03 0.82*1.27<br />
47 Waiters 1 0.57 9 1.10 [0.04] 0.00 8 1.17 20 1.17 38 1.12 0.79*1.54<br />
48 Building caretakers 33 1.10 29 0.90 2 2.97 34 1.19 50 1.10 148 1.08 0.92*1.27<br />
49 Chimney sweeps [0.00] 0.00 [0.02] 0.00 [0.00] 0.00 [0.00] 0.00 [0.02] 0.00 0.00*153.18<br />
50 Hairdressers [1.80] 0.00 4 1.26 [0.05] 0.00 2 1.12 9 1.21 15 1.05 0.59*1.74<br />
51 Launderers 6 1.76 [2.51] 0.00 [0.09] 0.00 5 2.01 6 0.68 17 0.98 0.57*1.57<br />
52 Military personnel [0.02] 0.00 [0.03] 0.00 [0.01] 0.00 [0.03] 0.00 [0.10] 0.00 0.00*38.52<br />
53 ‘‘Other workers’’ 5 0.59 12 1.17 1 1.38 13 0.87 18 0.88 49 0.89 0.66*1.18<br />
54 Economically inactive 229 1.01 252 1.19 1 0.41 193 0.95 899 1.00 1 574 1.02 0.97*1.07<br />
1 54 All categories 442 1.00 596 1.00 11 1.00 465 1.00 1 571 1.00 3 085 1.00 Ref.<br />
Obs observed number of cases; SIR st<strong>and</strong>ardised incidence ratio; 95% CI 95% confidence interval.
Acta Oncol Downloaded from informahealthcare.com by 212.35.100.66 on 04/06/11<br />
For personal use only.<br />
/ 100 000<br />
4<br />
2<br />
0<br />
Denmark<br />
Finl<strong>and</strong><br />
Icel<strong>and</strong><br />
Norway<br />
Sweden<br />
Men<br />
1945 1960 1975 1990 2005<br />
Female journalists (2.82, 1.46 4.92), waiters, mechanics<br />
<strong>and</strong> iron metalworkers, launderers <strong>and</strong> dry<br />
cleaners, <strong>and</strong> the group packers, loaders <strong>and</strong> warehouse<br />
workers had elevated risks. Farmers, shoe <strong>and</strong><br />
leather workers, <strong>and</strong> shop managers <strong>and</strong> assistants<br />
were low risk groups among the women (Table 11).<br />
Comment. Tobacco <strong>and</strong> alcohol are the major risk<br />
factors for oral <strong>cancer</strong>, both separately <strong>and</strong> in<br />
combination [50]. Infection with human papilloma<br />
virus entails an increased risk [54], while a high<br />
consumption of fruit <strong>and</strong>/or vegetables reduces risk.<br />
Direct occupational exposures appear to have little<br />
effect [55].<br />
Pharyngeal <strong>cancer</strong><br />
The incidence of pharyngeal <strong>cancer</strong> has increased<br />
by 50 100% for men <strong>and</strong> been relatively stable for<br />
women in all countries, except in Denmark, where<br />
/ 100 000<br />
4<br />
2<br />
0<br />
Denmark<br />
Finl<strong>and</strong><br />
Icel<strong>and</strong><br />
Norway<br />
Sweden<br />
Women<br />
1945 1960 1975 1990 2005<br />
Figure 15. Age st<strong>and</strong>ardised (World) incidence rates for <strong>cancer</strong> of the oral cavity 1943 2005, by country <strong>and</strong> gender. Modified from<br />
NORDCAN [49].<br />
/ 100 000<br />
6<br />
4<br />
2<br />
Denmark<br />
Finl<strong>and</strong><br />
Icel<strong>and</strong><br />
Norway<br />
Sweden<br />
Men<br />
0<br />
1945 1960 1975 1990 2005<br />
/ 100 000<br />
rates have quadrupled among men <strong>and</strong> tripled<br />
among women (Figure 16).<br />
Risk was consistently high among male waiters<br />
(SIR 6.22, 95% CI 5.16 7.50), beverage manufacture<br />
workers, cooks <strong>and</strong> stewards, chimney sweeps,<br />
artistic workers, seamen <strong>and</strong> journalists. Male hairdressers<br />
in Norway <strong>and</strong> Sweden had elevated risks.<br />
The low risk occupational categories comprise farmers<br />
(0.41, 0.38 0.45), forestry workers, gardeners,<br />
teachers, <strong>and</strong> physicians (Table 12).<br />
Female tobacco workers, artistic workers <strong>and</strong><br />
waiters had elevated risks in some, but not all,<br />
countries. Low risks were seen among teachers<br />
(0.64, 0.51 0.80), other health <strong>and</strong> medical workers<br />
<strong>and</strong> farmers (Table 13).<br />
Subsite analyses of oropharynx (http://astra.<br />
<strong>cancer</strong>.fi/NOCCA/Incidence/oropharynx) <strong>and</strong> nasopharynx<br />
(http://astra.<strong>cancer</strong>.fi/NOCCA/Incidence/<br />
nasopharynx) in general gave similar results. Female<br />
laundry workers however had an elevated risk of<br />
nasopharyngeal <strong>cancer</strong> (2.04, 1.02 3.65).<br />
6<br />
4<br />
2<br />
<strong>Occupation</strong> <strong>and</strong> <strong>cancer</strong> in Nordic countries 667<br />
Denmark<br />
Finl<strong>and</strong><br />
Icel<strong>and</strong><br />
Norway<br />
Sweden<br />
Women<br />
0<br />
1945 1960 1975 1990 2005<br />
Figure 16. Age st<strong>and</strong>ardised (World) incidence rates for <strong>cancer</strong> of the pharynx 1943 2005, by country <strong>and</strong> gender. Modified from<br />
NORDCAN [49].
Acta Oncol Downloaded from informahealthcare.com by 212.35.100.66 on 04/06/11<br />
For personal use only.<br />
668 E. Pukkala et al.<br />
Table 10. Observed number of <strong>cancer</strong> of the oral cavity among men in the Nordic countries <strong>and</strong> st<strong>and</strong>ardised incidence ratios 1961 2005,<br />
by country <strong>and</strong> occupational category.<br />
Denmark Finl<strong>and</strong> Icel<strong>and</strong> Norway Sweden Total<br />
No <strong>Occupation</strong>al category Obs SIR Obs SIR Obs SIR Obs SIR Obs SIR Obs SIR 95% CI<br />
1 Technical workers, etc 105 0.87 55 0.79 2 2.43 40 0.57 262 0.85 464 0.82 0.74*0.89<br />
2 Laboratory assistants 6 2.55 1 0.54 [0.15] 0.00 3 0.93 1 0.55 11 1.17 0.58*2.09<br />
3 Physicians 9 0.95 5 1.22 [0.31] 0.00 4 0.46 14 0.97 32 0.87 0.59*1.22<br />
4 Dentists 4 1.35 2 2.45 [0.10] 0.00 1 0.26 8 1.16 15 1.02 0.57*1.68<br />
5 Nurses [0.15] 0.00 [0.32] 0.00 [0.00] 0.00 1 2.09 1 1.04 2 1.05 0.13*3.78<br />
6 Assistant nurses 3 1.02 [0.32] 0.00 [0.03] 0.00 3 2.10 2 0.39 8 0.81 0.35*1.60<br />
7 ‘‘Other health workers’’ 4 0.49 3 0.82 [0.08] 0.00 4 1.20 9 0.76 20 0.74 0.45*1.14<br />
8 Teachers 31 0.58 24 0.87 2 1.74 29 0.58 64 0.78 150 0.70 0.60*0.82<br />
9 Religious workers etc 18 0.89 12 0.72 [0.70] 0.00 25 1.01 54 0.86 109 0.87 0.72*1.05<br />
10 Artistic workers 9 1.40 14 2.59 [0.19] 0.00 7 0.98 30 1.59 60 1.58 1.20*2.03<br />
11 Journalists 5 1.60 5 1.93 [0.11] 0.00 3 0.94 15 1.70 28 1.57 1.04*2.27<br />
12 Administrators 132 1.04 31 0.77 1 0.57 81 0.95 131 1.15 376 1.02 0.92*1.13<br />
13 Clerical workers 52 0.90 27 1.08 5 2.72 52 0.81 139 1.12 275 1.01 0.89*1.13<br />
14 Sales agents 42 1.36 33 0.88 1 1.01 89 1.21 235 1.29 400 1.23 1.12*1.36<br />
15 Shop workers 141 1.13 20 1.14 [0.67] 0.00 22 0.73 67 1.14 250 1.08 0.95*1.22<br />
16 Farmers 92 0.40 89 0.64 1 0.38 134 0.70 153 0.53 469 0.55 0.50*0.60<br />
17 Gardeners 20 0.62 16 0.67 [0.08] 0.00 35 0.72 75 0.68 146 0.68 0.58*0.80<br />
18 Fishermen 17 1.42 [1.92] 0.00 1 0.51 57 0.92 9 0.78 84 0.94 0.75*1.16<br />
19 Forestry workers 1 0.22 22 0.78 [0.02] 0.00 22 0.63 59 0.74 104 0.70 0.58*0.85<br />
20 Miners <strong>and</strong> quarry workers [1.44] 0.00 7 1.50 1 28.93 9 0.86 11 0.54 28 0.76 0.50*1.10<br />
21 Seamen 38 2.75 11 1.72 1 2.00 98 1.81 43 2.37 191 2.05 1.78*2.36<br />
22 Transport workers 30 1.10 14 0.82 [0.90] 0.00 25 0.91 57 0.96 126 0.95 0.80*1.13<br />
23 Drivers 89 0.96 47 0.76 1 0.70 89 1.14 137 0.90 363 0.94 0.85*1.04<br />
24 Postal workers 19 0.99 12 1.31 1 7.01 11 0.74 39 1.18 82 1.08 0.86*1.34<br />
25 Textile workers 15 1.00 5 0.91 1 4.19 14 0.92 33 0.94 68 0.95 0.74*1.21<br />
26 Shoe <strong>and</strong> leather workers 4 1.12 2 0.85 [0.05] 0.00 7 1.10 18 1.32 31 1.19 0.81*1.70<br />
27 Smelting workers 42 1.12 4 0.46 1 2.51 19 0.88 46 0.81 112 0.90 0.74*1.08<br />
28 Mechanics 90 0.91 80 1.27 [1.41] 0.00 105 0.96 269 0.98 544 0.99 0.91*1.08<br />
29 Plumbers 17 1.87 11 1.02 [0.21] 0.00 19 1.48 26 0.82 73 1.13 0.88*1.42<br />
30 Welders 18 1.56 [0.09] 0.00 8 0.54 33 0.89 59 0.93 0.71*1.20<br />
31 Electrical workers 30 1.21 29 1.03 1 1.15 52 1.07 94 0.97 206 1.04 0.90*1.19<br />
32 Wood workers 47 0.71 45 0.79 2 2.76 100 0.84 125 0.71 319 0.76 0.68*0.85<br />
33 Painters 35 1.58 22 1.69 1 3.21 34 1.69 68 1.31 160 1.49 1.28*1.74<br />
34 ‘‘Other construction workers’’ 93 1.20 47 1.26 1 0.64 35 1.42 113 1.18 289 1.22 1.09*1.37<br />
35 Bricklayers 36 1.50 9 1.52 14 1.18 28 1.22 87 1.34 1.07*1.65<br />
36 Printers 20 1.23 6 0.87 [0.28] 0.00 17 1.33 41 1.41 84 1.29 1.03*1.59<br />
37 Chemical process workers 14 1.05 9 0.87 [0.13] 0.00 27 1.02 35 0.82 85 0.91 0.73*1.13<br />
38 Food workers 39 0.86 11 1.49 2 2.12 35 1.15 48 1.10 135 1.06 0.89*1.25<br />
39 Beverage workers 11 2.05 1 2.25 [0.01] 0.00 1 2.30 3 1.23 16 1.84 1.05*2.98<br />
40 Tobacco workers 1 1.26 [0.09] 0.00 [0.00] 0.00 1 2.19 [0.20] 0.00 2 1.30 0.16*4.70<br />
41 Glass makers etc 23 0.89 11 1.01 [0.19] 0.00 25 1.62 46 0.96 105 1.05 0.86*1.27<br />
42 Packers 31 1.40 27 1.29 [0.57] 0.00 61 1.34 74 0.87 193 1.11 0.96*1.27<br />
43 Engine operators 18 0.73 28 0.88 [0.96] 0.00 31 1.10 73 0.98 150 0.94 0.80*1.10<br />
44 Public safety workers 26 1.17 13 0.75 [0.63] 0.00 22 1.12 43 0.98 104 1.00 0.83*1.22<br />
45 Cooks <strong>and</strong> stewards 7 3.67 3 2.30 1 2.97 30 3.22 23 2.81 64 3.04 2.34*3.88<br />
46 Domestic assistants [0.02] 0.00 [0.05] 0.00 [0.00] 0.00 [0.08] 0.00 [0.76] 0.00 [0.92] 0.00 0.00*4.02<br />
47 Waiters 30 7.98 4 3.01 [0.04] 0.00 9 2.31 24 5.65 67 5.05 3.91*6.41<br />
48 Building caretakers 30 1.33 16 1.19 [0.22] 0.00 14 1.35 33 0.99 93 1.16 0.94*1.42<br />
49 Chimney sweeps 2 3.07 1 1.00 1 0.96 6 2.40 10 1.93 0.92*3.54<br />
50 Hairdressers 4 0.62 1 3.29 [0.05] 0.00 6 2.06 16 1.90 27 1.49 0.98*2.16<br />
51 Launderers 2 0.64 1 3.26 [0.02] 0.00 2 1.15 4 0.66 9 0.80 0.37*1.52<br />
52 Military personnel 12 0.90 5 0.76 17 0.97 34 1.33 68 1.08 0.84*1.37<br />
53 ‘‘Other workers’’ 112 1.55 22 1.36 2 0.81 91 1.08 112 1.08 339 1.22 1.09*1.35<br />
54 Economically inactive 82 1.42 130 1.72 2 1.20 71 1.55 312 1.90 597 1.73 1.60*1.87<br />
1 54 All categories 1 740 1.00 1 011 1.00 31 1.00 1 712 1.00 3 395 1.00 7 889 1.00 Ref.<br />
Obs observed number of cases; SIR st<strong>and</strong>ardised incidence ratio; 95% CI 95% confidence interval.
Acta Oncol Downloaded from informahealthcare.com by 212.35.100.66 on 04/06/11<br />
For personal use only.<br />
Table 11. Observed number of <strong>cancer</strong> of the oral cavity among women in the Nordic countries <strong>and</strong> st<strong>and</strong>ardised incidence ratios 1961<br />
2005, by country <strong>and</strong> occupational category.<br />
Denmark Finl<strong>and</strong> Icel<strong>and</strong> Norway Sweden Total<br />
No <strong>Occupation</strong>al category Obs SIR Obs SIR Obs SIR Obs SIR Obs SIR Obs SIR 95% CI<br />
1 Technical workers, etc 5 1.32 5 1.04 [0.08] 0.00 [1.43] 0.00 8 0.81 18 0.90 0.53*1.43<br />
2 Laboratory assistants 2 0.72 3 1.14 [0.12] 0.00 2 1.10 2 0.74 9 0.90 0.41*1.71<br />
3 Physicians [1.26] 0.00 1 0.86 [0.03] 0.00 1 1.34 3 1.33 5 0.92 0.30*2.14<br />
4 Dentists [1.12] 0.00 2 1.57 [0.01] 0.00 1 1.54 2 1.12 5 1.04 0.34*2.42<br />
5 Nurses 20 0.90 19 1.44 [0.67] 0.00 11 0.76 22 0.73 72 0.89 0.70*1.13<br />
6 Assistant nurses 16 1.00 13 0.97 [1.00] 0.00 15 1.05 46 0.88 90 0.93 0.75*1.14<br />
7 ‘‘Other health workers’’ 8 0.63 9 0.84 [0.18] 0.00 12 0.83 15 0.86 44 0.79 0.58*1.06<br />
8 Teachers 26 0.92 28 1.15 1 0.89 17 0.62 58 0.85 130 0.87 0.73*1.03<br />
9 Religious workers etc 4 1.05 11 0.90 [0.18] 0.00 5 0.74 20 0.90 40 0.89 0.63*1.21<br />
10 Artistic workers 2 1.02 1 0.50 [0.15] 0.00 3 1.45 11 2.56 17 1.62 0.95*2.60<br />
11 Journalists 1 2.40 4 3.15 [0.03] 0.00 4 7.35 3 1.50 12 2.82 1.46*4.92<br />
12 Administrators 11 0.95 4 0.92 [0.14] 0.00 9 1.31 7 0.71 31 0.95 0.64*1.34<br />
13 Clerical workers 133 1.17 78 0.99 3 0.82 80 0.92 186 1.12 480 1.07 0.98*1.17<br />
14 Sales agents 2 1.95 16 1.35 [0.45] 0.00 20 1.58 27 1.12 65 1.30 1.00*1.66<br />
15 Shop workers 64 0.83 34 0.82 3 1.16 61 0.83 101 0.98 263 0.88 0.78*1.00<br />
16 Farmers 27 0.50 24 0.86 1 0.47 43 0.84 13 1.34 108 0.74 0.62*0.90<br />
17 Gardeners 4 0.57 57 0.76 [0.07] 0.00 29 0.95 32 1.18 122 0.87 0.73*1.04<br />
18 Fishermen [0.28] 0.00 1 6.01 [0.06] 0.00 [0.38] 0.00 1 11.21 2 2.07 0.25*7.48<br />
19 Forestry workers [0.07] 0.00 1 3.01 [0.01] 0.00 [0.56] 0.00 [0.58] 0.00 1 0.64 0.02*3.59<br />
20 Miners <strong>and</strong> quarry workers [0.00] 0.00 [0.14] 0.00 [0.00] 0.00 [0.03] 0.00 [0.14] 0.00 [0.31] 0.00 0.00*11.88<br />
21 Seamen [0.04] 0.00 [0.00] 0.00 [0.09] 0.00 [0.02] 0.00 [0.15] 0.00 0.00*25.34<br />
22 Transport workers 1 12.98 2 1.00 [0.08] 0.00 [0.39] 0.00 2 1.23 5 1.20 0.39*2.81<br />
23 Drivers 1 0.52 1 1.03 [0.03] 0.00 4 2.72 7 1.76 13 1.55 0.83*2.65<br />
24 Postal workers 5 1.24 12 0.96 2 2.20 13 0.76 24 0.82 56 0.88 0.66*1.14<br />
25 Textile workers 26 1.02 35 1.22 4 2.07 23 0.83 62 1.02 150 1.04 0.88*1.22<br />
26 Shoe <strong>and</strong> leather workers 1 0.53 [3.48] 0.00 [0.10] 0.00 [1.96] 0.00 3 0.65 4 0.33 0.09*0.85<br />
27 Smelting workers 1 2.19 [0.81] 0.00 [0.00] 0.00 1 4.60 2 1.63 4 1.48 0.40*3.78<br />
28 Mechanics 5 1.10 8 2.17 [0.01] 0.00 2 0.85 20 1.62 35 1.53 1.06*2.12<br />
29 Plumbers [0.05] 0.00 [0.01] 0.00 [0.02] 0.00 [0.02] 0.00 [0.09] 0.00 0.00*41.60<br />
30 Welders 1 3.43 [0.00] 0.00 [0.17] 0.00 [0.46] 0.00 1 1.09 0.03*6.06<br />
31 Electrical workers 8 1.26 1 0.41 [0.02] 0.00 2 0.80 6 0.87 17 0.93 0.54*1.49<br />
32 Wood workers 1 0.47 5 0.70 [0.03] 0.00 [0.85] 0.00 3 1.46 9 0.74 0.34*1.41<br />
33 Painters [0.08] 0.00 1 1.19 [0.01] 0.00 [0.19] 0.00 [0.56] 0.00 1 0.60 0.02*3.32<br />
34 ‘‘Other construction workers’’ [0.06] 0.00 2 0.70 [0.00] 0.00 [0.08] 0.00 [0.07] 0.00 2 0.65 0.08*2.34<br />
35 Bricklayers [0.01] 0.00 [0.10] 0.00 [0.00] 0.00 [0.00] 0.00 [0.12] 0.00 0.00*30.57<br />
36 Printers 2 0.84 6 1.66 [0.14] 0.00 1 0.43 8 1.53 17 1.24 0.72*1.99<br />
37 Chemical process workers 2 0.53 [1.84] 0.00 [0.07] 0.00 1 0.49 3 0.72 6 0.51 0.19*1.10<br />
38 Food workers 26 1.41 6 0.62 4 1.13 12 0.90 16 1.27 64 1.11 0.86*1.42<br />
39 Beverage workers 4 2.34 [0.54] 0.00 [0.01] 0.00 [0.11] 0.00 [0.80] 0.00 4 1.26 0.34*3.22<br />
40 Tobacco workers 7 2.94 [0.31] 0.00 [0.46] 0.00 [0.49] 0.00 7 1.92 0.77*3.96<br />
41 Glass makers etc 3 0.67 8 1.18 [0.09] 0.00 10 2.27 12 1.08 33 1.23 0.85*1.73<br />
42 Packers 2 1.55 11 0.92 1 2.69 14 1.32 26 1.56 54 1.32 0.99*1.72<br />
43 Engine operators [0.04] 0.00 3 1.57 [0.00] 0.00 [0.14] 0.00 [1.02] 0.00 3 0.96 0.20*2.81<br />
44 Public safety workers [0.14] 0.00 1 2.10 1 13.55 [1.35] 0.00 2 1.47 4 1.18 0.32*3.02<br />
45 Cooks <strong>and</strong> stewards [0.05] 0.00 11 0.80 [1.45] 0.00 17 1.11 38 1.53 66 1.19 0.92*1.51<br />
46 Domestic assistants 25 0.87 14 0.93 [0.45] 0.00 33 0.83 56 0.86 128 0.86 0.72*1.02<br />
47 Waiters 13 2.68 22 1.94 1 6.84 31 1.92 46 1.82 113 1.96 1.63*2.35<br />
48 Building caretakers 96 1.16 62 1.33 3 1.05 75 1.08 61 0.92 297 1.11 0.99*1.24<br />
49 Chimney sweeps [0.01] 0.00 [0.02] 0.00 [0.01] 0.00 [0.00] 0.00 [0.04] 0.00 0.00*89.92<br />
50 Hairdressers 3 0.59 4 0.92 [0.11] 0.00 4 0.97 11 1.04 22 0.91 0.57*1.38<br />
51 Launderers 9 0.96 1 0.27 2 3.96 10 1.66 28 2.10 50 1.52 1.13*2.00<br />
52 Military personnel [0.05] 0.00 [0.04] 0.00 [0.02] 0.00 [0.04] 0.00 [0.15] 0.00 0.00*24.73<br />
53 ‘‘Other workers’’ 38 1.61 19 1.31 5 1.84 37 1.04 27 0.92 126 1.19 1.00*1.42<br />
54 Economically inactive 626 0.99 316 0.98 7 0.72 495 1.04 1 310 0.96 2 754 0.98 0.95*1.02<br />
1 54 All categories 1 230 1.00 863 1.00 38 1.00 1 098 1.00 2 330 1.00 5 559 1.00 Ref.<br />
Obs observed number of cases; SIR st<strong>and</strong>ardised incidence ratio; 95% CI 95% confidence interval.<br />
<strong>Occupation</strong> <strong>and</strong> <strong>cancer</strong> in Nordic countries 669
Acta Oncol Downloaded from informahealthcare.com by 212.35.100.66 on 04/06/11<br />
For personal use only.<br />
670 E. Pukkala et al.<br />
Table 12. Observed number of <strong>cancer</strong> of the pharynx among men in the Nordic countries <strong>and</strong> st<strong>and</strong>ardised incidence ratios 1961 2005, by<br />
country <strong>and</strong> occupational category.<br />
Denmark Finl<strong>and</strong> Icel<strong>and</strong> Norway Sweden Total<br />
No <strong>Occupation</strong>al category Obs SIR Obs SIR Obs SIR Obs SIR Obs SIR Obs SIR 95% CI<br />
1 Technical workers, etc 118 0.81 73 0.86 1 0.99 48 0.55 361 0.78 601 0.77 0.71*0.83<br />
2 Laboratory assistants 2 0.71 1 0.44 [0.18] 0.00 4 1.02 4 1.24 11 0.89 0.44*1.59<br />
3 Physicians 7 0.62 2 0.41 [0.34] 0.00 10 0.96 15 0.67 34 0.69 0.48*0.96<br />
4 Dentists 4 1.11 [1.00] 0.00 [0.10] 0.00 1 0.21 6 0.58 11 0.56 0.28*0.99<br />
5 Nurses [0.19] 0.00 [0.38] 0.00 [0.00] 0.00 1 1.50 [2.13] 0.00 1 0.30 0.01*1.65<br />
6 Assistant nurses [3.60] 0.00 1 2.64 [0.04] 0.00 1 0.60 8 0.93 10 0.70 0.34*1.29<br />
7 ‘‘Other health workers’’ 9 0.92 6 1.32 [0.09] 0.00 6 1.49 15 0.82 36 0.98 0.69*1.36<br />
8 Teachers 48 0.74 19 0.57 3 2.30 25 0.40 80 0.63 175 0.61 0.52*0.70<br />
9 Religious workers etc 22 0.92 29 1.41 1 1.18 19 0.64 93 0.91 164 0.93 0.80*1.08<br />
10 Artistic workers 19 2.47 14 2.11 1 4.50 20 2.34 62 2.17 116 2.24 1.87*2.69<br />
11 Journalists 9 2.39 8 2.50 [0.13] 0.00 5 1.29 20 1.47 42 1.71 1.23*2.31<br />
12 Administrators 160 1.07 51 1.03 4 2.19 104 1.04 179 1.09 498 1.07 0.98*1.17<br />
13 Clerical workers 81 1.16 32 1.03 3 1.46 58 0.76 205 1.12 379 1.04 0.94*1.15<br />
14 Sales agents 35 0.94 48 1.03 1 0.93 100 1.17 339 1.25 523 1.18 1.09*1.29<br />
15 Shop workers 168 1.14 24 1.14 1 1.32 35 0.96 113 1.31 341 1.17 1.05*1.30<br />
16 Farmers 64 0.25 107 0.58 1 0.36 91 0.44 172 0.43 435 0.41 0.38*0.45<br />
17 Gardeners 15 0.40 24 0.81 [0.09] 0.00 29 0.54 93 0.60 161 0.59 0.50*0.68<br />
18 Fishermen 19 1.31 2 0.79 3 1.28 57 0.82 12 0.74 93 0.88 0.71*1.08<br />
19 Forestry workers 1 0.19 21 0.59 [0.02] 0.00 14 0.36 48 0.42 84 0.44 0.35*0.54<br />
20 Miners <strong>and</strong> quarry workers 4 2.36 7 1.20 [0.03] 0.00 14 1.16 10 0.34 35 0.71 0.50*0.99<br />
21 Seamen 32 1.87 14 1.76 2 3.71 140 2.16 53 2.00 241 2.06 1.82*2.34<br />
22 Transport workers 20 0.62 17 0.78 [0.97] 0.00 30 0.95 85 0.99 152 0.88 0.75*1.03<br />
23 Drivers 137 1.22 74 0.97 3 1.87 111 1.19 265 1.16 590 1.15 1.06*1.25<br />
24 Postal workers 20 0.86 9 0.79 [0.17] 0.00 21 1.20 54 1.09 104 1.02 0.84*1.24<br />
25 Textile workers 16 0.90 6 0.87 [0.27] 0.00 10 0.59 38 0.77 70 0.77 0.60*0.97<br />
26 Shoe <strong>and</strong> leather workers 2 0.48 4 1.34 [0.05] 0.00 6 0.85 29 1.53 41 1.23 0.89*1.67<br />
27 Smelting workers 60 1.31 7 0.64 [0.44] 0.00 30 1.20 65 0.80 162 0.99 0.85*1.15<br />
28 Mechanics 137 1.14 71 0.91 1 0.62 137 1.05 393 0.96 739 1.00 0.93*1.07<br />
29 Plumbers 10 0.89 7 0.53 [0.25] 0.00 17 1.09 38 0.81 72 0.82 0.64*1.04<br />
30 Welders 14 1.00 [0.10] 0.00 22 1.20 57 1.01 93 1.05 0.85*1.28<br />
31 Electrical workers 37 1.20 36 1.04 [1.01] 0.00 45 0.77 124 0.84 242 0.89 0.78*1.01<br />
32 Wood workers 59 0.75 63 0.86 1 1.27 117 0.86 210 0.83 450 0.83 0.76*0.91<br />
33 Painters 37 1.38 31 1.91 [0.31] 0.00 31 1.34 77 1.02 176 1.24 1.07*1.44<br />
34 ‘‘Other construction workers’’ 81 0.89 72 1.50 1 0.55 42 1.43 150 1.08 346 1.12 1.01*1.24<br />
35 Bricklayers 38 1.31 11 1.44 20 1.47 46 1.41 115 1.39 1.16*1.67<br />
36 Printers 31 1.55 6 0.72 [0.30] 0.00 13 0.84 64 1.46 114 1.30 1.08*1.56<br />
37 Chemical process workers 20 1.26 12 0.94 [0.14] 0.00 28 0.92 57 0.92 117 0.97 0.81*1.16<br />
38 Food workers 59 1.08 11 1.21 [1.15] 0.00 49 1.39 64 1.02 183 1.13 0.97*1.30<br />
39 Beverage workers 23 3.52 [0.57] 0.00 [0.02] 0.00 2 3.35 7 1.98 32 2.84 1.94*4.01<br />
40 Tobacco workers 1 1.08 [0.10] 0.00 [0.00] 0.00 [0.52] 0.00 [0.30] 0.00 1 0.54 0.01*3.01<br />
41 Glass makers etc 27 0.88 12 0.88 1 4.43 24 1.31 70 1.00 134 1.01 0.85*1.19<br />
42 Packers 39 1.49 34 1.28 [0.64] 0.00 85 1.61 166 1.34 324 1.41 1.26*1.57<br />
43 Engine operators 30 1.01 30 0.77 1 0.92 30 0.87 106 0.95 197 0.91 0.79*1.05<br />
44 Public safety workers 17 0.65 10 0.47 1 1.38 17 0.75 53 0.79 98 0.71 0.58*0.86<br />
45 Cooks <strong>and</strong> stewards 17 7.14 6 3.75 [0.38] 0.00 27 2.38 26 1.97 76 2.63 2.07*3.29<br />
46 Domestic assistants [0.03] 0.00 [0.06] 0.00 [0.00] 0.00 [0.11] 0.00 3 1.89 3 1.68 0.35*4.90<br />
47 Waiters 35 7.46 7 4.24 [0.04] 0.00 32 6.91 36 5.40 110 6.22 5.16*7.50<br />
48 Building caretakers 33 1.24 19 1.10 [0.24] 0.00 12 0.98 51 1.01 115 1.07 0.89*1.29<br />
49 Chimney sweeps 2 2.49 3 2.34 4 3.29 8 2.12 17 2.41 1.40*3.85<br />
50 Hairdressers 5 0.66 [0.39] 0.00 [0.06] 0.00 10 2.97 25 2.10 40 1.72 1.23*2.34<br />
51 Launderers [3.64] 0.00 [0.38] 0.00 [0.02] 0.00 3 1.51 13 1.52 16 1.10 0.63*1.78<br />
52 Military personnel 15 0.93 5 0.64 18 0.86 31 0.82 69 0.83 0.65*1.05<br />
53 ‘‘Other workers’’ 149 1.70 30 1.44 3 1.13 108 1.14 191 1.28 481 1.35 1.24*1.48<br />
54 Economically inactive 99 1.42 191 1.77 2 0.94 110 2.01 509 2.00 911 1.86 1.74*1.99<br />
1 54 All categories 2 073 1.00 1 281 1.00 35 1.00 1 993 1.00 4 999 1.00 10 381 1.00 Ref.<br />
Obs observed number of cases; SIR st<strong>and</strong>ardised incidence ratio; 95% CI 95% confidence interval.
Acta Oncol Downloaded from informahealthcare.com by 212.35.100.66 on 04/06/11<br />
For personal use only.<br />
Table 13. Observed number of <strong>cancer</strong> of the pharynx among women in the Nordic countries <strong>and</strong> st<strong>and</strong>ardised incidence ratios 1961 2005,<br />
by country <strong>and</strong> occupational category.<br />
Denmark Finl<strong>and</strong> Icel<strong>and</strong> Norway Sweden Total<br />
No <strong>Occupation</strong>al category Obs SIR Obs SIR Obs SIR Obs SIR Obs SIR Obs SIR 95% CI<br />
1 Technical workers, etc 3 1.06 2 0.61 [0.05] 0.00 1 0.99 2 0.22 8 0.49 0.21*0.97<br />
2 Laboratory assistants 3 1.33 1 0.58 [0.07] 0.00 [1.22] 0.00 [3.18] 0.00 4 0.47 0.13*1.21<br />
3 Physicians 3 3.27 [0.80] 0.00 [0.01] 0.00 [0.50] 0.00 1 0.45 4 0.89 0.24*2.29<br />
4 Dentists 2 2.47 2 2.55 [0.01] 0.00 [0.41] 0.00 2 1.28 6 1.68 0.62*3.65<br />
5 Nurses 16 1.00 3 0.34 1 2.92 8 0.83 20 0.74 48 0.78 0.57*1.03<br />
6 Assistant nurses 16 1.29 2 0.24 1 2.36 5 0.53 53 1.08 77 0.97 0.76*1.21<br />
7 ‘‘Other health workers’’ 4 0.44 3 0.44 [0.10] 0.00 4 0.42 17 1.02 28 0.66 0.44*0.96<br />
8 Teachers 13 0.61 10 0.64 [0.60] 0.00 10 0.55 43 0.69 76 0.64 0.51*0.80<br />
9 Religious workers etc 4 1.44 10 1.15 [0.09] 0.00 3 0.68 17 0.77 34 0.89 0.62*1.25<br />
10 Artistic workers 1 0.77 2 1.49 [0.08] 0.00 5 3.79 7 1.74 15 1.86 1.04*3.07<br />
11 Journalists 1 3.14 1 1.20 [0.02] 0.00 2 5.51 3 1.59 7 2.04 0.82*4.21<br />
12 Administrators 14 1.78 5 1.69 [0.06] 0.00 2 0.46 10 1.08 31 1.27 0.86*1.80<br />
13 Clerical workers 99 1.15 65 1.24 1 0.56 62 1.09 177 1.21 404 1.17 1.07*1.29<br />
14 Sales agents 2 2.77 7 0.93 [0.21] 0.00 8 1.05 27 1.29 44 1.19 0.86*1.60<br />
15 Shop workers 56 1.04 22 0.84 1 0.85 34 0.75 75 0.90 188 0.90 0.78*1.03<br />
16 Farmers 13 0.34 26 1.50 1 1.19 25 0.88 7 0.78 72 0.77 0.60*0.97<br />
17 Gardeners 5 1.02 31 0.67 [0.03] 0.00 8 0.47 22 1.01 66 0.74 0.57*0.94<br />
18 Fishermen [0.20] 0.00 [0.11] 0.00 [0.03] 0.00 [0.24] 0.00 [0.08] 0.00 [0.65] 0.00 0.00*5.65<br />
19 Forestry workers [0.05] 0.00 [0.20] 0.00 [0.00] 0.00 [0.33] 0.00 [0.49] 0.00 [1.08] 0.00 0.00*3.41<br />
20 Miners <strong>and</strong> quarry workers [0.00] 0.00 [0.09] 0.00 [0.00] 0.00 [0.02] 0.00 [0.12] 0.00 [0.23] 0.00 0.00*15.90<br />
21 Seamen [0.03] 0.00 [0.06] 0.00 [0.02] 0.00 [0.10] 0.00 0.00*36.80<br />
22 Transport workers [0.05] 0.00 [1.25] 0.00 [0.03] 0.00 [0.26] 0.00 3 2.07 3 0.98 0.20*2.88<br />
23 Drivers 3 2.09 [0.64] 0.00 [0.02] 0.00 [0.94] 0.00 4 1.07 7 1.03 0.41*2.13<br />
24 Postal workers 2 0.70 8 1.02 1 2.43 9 0.82 25 1.02 45 0.97 0.71*1.29<br />
25 Textile workers 24 1.30 19 1.06 [0.64] 0.00 13 0.78 31 0.65 87 0.86 0.69*1.06<br />
26 Shoe <strong>and</strong> leather workers 3 2.15 6 2.75 [0.04] 0.00 [1.20] 0.00 2 0.55 11 1.31 0.65*2.34<br />
27 Smelting workers 1 2.90 [0.51] 0.00 [0.00] 0.00 1 6.77 1 0.92 3 1.44 0.30*4.20<br />
28 Mechanics 4 1.11 2 0.83 [0.01] 0.00 1 0.66 15 1.38 22 1.19 0.75*1.81<br />
29 Plumbers [0.02] 0.00 [0.01] 0.00 [0.01] 0.00 [0.02] 0.00 [0.06] 0.00 0.00*61.70<br />
30 Welders 1 4.98 [0.00] 0.00 [0.12] 0.00 [0.46] 0.00 1 1.28 0.03*7.14<br />
31 Electrical workers 10 1.98 1 0.61 [0.01] 0.00 3 1.81 6 0.99 20 1.38 0.85*2.14<br />
32 Wood workers 2 1.24 3 0.68 [0.01] 0.00 [0.55] 0.00 3 1.60 8 0.94 0.41*1.86<br />
33 Painters [0.06] 0.00 [0.53] 0.00 [0.00] 0.00 [0.12] 0.00 [0.49] 0.00 [1.21] 0.00 0.00*3.05<br />
34 ‘‘Other construction workers’’ [0.04] 0.00 1 0.57 [0.00] 0.00 [0.05] 0.00 [0.07] 0.00 1 0.52 0.01*2.89<br />
35 Bricklayers [0.01] 0.00 [0.06] 0.00 [0.00] 0.00 [0.00] 0.00 [0.07] 0.00 0.00*51.43<br />
36 Printers 1 0.56 2 0.87 [0.05] 0.00 1 0.68 3 0.66 7 0.69 0.28*1.42<br />
37 Chemical process workers [2.75] 0.00 [1.17] 0.00 [0.02] 0.00 2 1.54 8 2.31 10 1.15 0.55*2.11<br />
38 Food workers 17 1.25 3 0.51 2 1.47 11 1.37 13 1.28 46 1.18 0.86*1.57<br />
39 Beverage workers 3 2.39 [0.33] 0.00 [0.00] 0.00 [0.07] 0.00 1 1.54 4 1.73 0.47*4.43<br />
40 Tobacco workers 7 3.97 [0.18] 0.00 1 3.39 [0.40] 0.00 8 3.03 1.31*5.97<br />
41 Glass makers etc 5 1.43 2 0.47 [0.04] 0.00 4 1.43 13 1.41 24 1.21 0.78*1.81<br />
42 Packers 4 4.15 5 0.68 [0.13] 0.00 7 1.07 20 1.45 36 1.25 0.88*1.73<br />
43 Engine operators [0.04] 0.00 5 4.06 [0.00] 0.00 [0.10] 0.00 1 1.01 6 2.54 0.93*5.54<br />
44 Public safety workers [0.09] 0.00 [0.31] 0.00 [0.02] 0.00 1 1.35 [1.43] 0.00 1 0.39 0.01*2.15<br />
45 Cooks <strong>and</strong> stewards [0.03] 0.00 10 1.14 [0.47] 0.00 16 1.79 15 0.74 41 1.06 0.76*1.44<br />
46 Domestic assistants 14 0.68 7 0.70 [0.13] 0.00 16 0.67 66 1.10 103 0.90 0.74*1.09<br />
47 Waiters 10 2.73 13 1.79 [0.05] 0.00 10 1.00 31 1.55 64 1.56 1.20*2.00<br />
48 Building caretakers 70 1.20 37 1.24 [0.99] 0.00 51 1.20 60 1.06 218 1.16 1.01*1.32<br />
49 Chimney sweeps [0.00] 0.00 [0.01] 0.00 [0.01] 0.00 [0.00] 0.00 [0.02] 0.00 0.00*150.33<br />
50 Hairdressers 5 1.33 7 2.43 [0.05] 0.00 3 1.14 10 1.11 25 1.37 0.88*2.02<br />
51 Launderers 4 0.62 1 0.44 1 6.87 4 1.10 12 1.15 22 0.96 0.60*1.45<br />
52 Military personnel [0.03] 0.00 [0.03] 0.00 [0.01] 0.00 [0.05] 0.00 [0.13] 0.00 0.00*28.26<br />
53 ‘‘Other workers’’ 23 1.36 14 1.52 2 1.94 20 0.91 29 1.15 88 1.18 0.95*1.46<br />
54 Economically inactive 374 0.92 209 1.03 4 1.18 324 1.12 1 079 0.99 1 990 1.00 0.95*1.04<br />
1 54 All categories 841 1.00 548 1.00 15 1.00 675 1.00 1 934 1.00 4 013 1.00 Ref.<br />
Obs observed number of cases; SIR st<strong>and</strong>ardised incidence ratio; 95% CI 95% confidence interval.<br />
<strong>Occupation</strong> <strong>and</strong> <strong>cancer</strong> in Nordic countries 671
Acta Oncol Downloaded from informahealthcare.com by 212.35.100.66 on 04/06/11<br />
For personal use only.<br />
672 E. Pukkala et al.<br />
Comment. Cancer of the pharynx, except nasopharynx,<br />
has the same risk factors as oral <strong>cancer</strong>, alcohol<br />
<strong>and</strong> tobacco being the main aetiological agents<br />
[50,56]. The high risk occupations observed here<br />
are those mostly working with the production or<br />
distribution of these products or having easy access<br />
to them, or those which belong to work cultures<br />
where liberal attitudes towards drinking <strong>and</strong> smoking<br />
have been prevalent. There are some indications<br />
that the inhalation of organic or inorganic dust may<br />
be associated with elevated risk, which may have<br />
contributed to the high risks among male hairdressers<br />
<strong>and</strong> chimney sweeps.<br />
Oesophageal <strong>cancer</strong><br />
For both genders the risk of oesophageal <strong>cancer</strong> has<br />
been relatively stable in Norway <strong>and</strong> Sweden, <strong>and</strong> in<br />
Danish women. The incidence rate among men in<br />
Denmark has more than doubled since 1980. Finnish<br />
men <strong>and</strong> women <strong>and</strong> Icel<strong>and</strong>ic women have experienced<br />
a large decrease in risk <strong>and</strong> Icel<strong>and</strong>ic men a<br />
more moderate decrease in risk (Figure 17).<br />
High risks were seen among male waiters (SIR<br />
3.34, 95% CI 2.75 4.07), beverage manufacture<br />
workers, cooks <strong>and</strong> stewards, chimney sweeps<br />
<strong>and</strong> seamen (Table 14). The SIRs for adenocarcinoma<br />
(http://astra.<strong>cancer</strong>.fi/NOCCA/Incidence/oe<br />
sophagus-adenocarcinoma) in these occupational<br />
categories tended to be less increased. Physicians<br />
(0.49, 0.36 0.67), teachers, dentists, farmers, other<br />
health <strong>and</strong> medical workers, religious, juridical <strong>and</strong><br />
other workers form the most important low risk<br />
groups.<br />
Among women, waitresses had an elevated SIR<br />
(1.35, 1.13 1.62) as well as women working on ships<br />
in Finl<strong>and</strong> <strong>and</strong> Sweden (based on 2 <strong>and</strong> 1 case,<br />
respectively). Low SIRs were observed among<br />
/ 100 000<br />
10<br />
8<br />
6<br />
4<br />
2<br />
0<br />
Men<br />
Denmark<br />
Finl<strong>and</strong><br />
Icel<strong>and</strong><br />
Norway<br />
Sweden<br />
1945 1960 1975 1990 2005<br />
/ 100 000<br />
nurses (0.68, 0.53 0.85), assistant nurses, teachers<br />
<strong>and</strong> farmers (Table 15).<br />
Comment. Squamous cell carcinoma of the oesophagus<br />
is strongly linked to alcohol <strong>and</strong> tobacco, while<br />
adenocarcinoma is mainly associated with obesity<br />
[57]. Consumption of fruits <strong>and</strong> vegetables appear<br />
to convey a protective effect in both types. Differences<br />
in alcohol consumption <strong>and</strong> tobacco smoking<br />
are probably major factors behind the observed<br />
distribution of risk, which is mainly confined to<br />
squamous cell carcinoma. An effect of exposure to<br />
combustion products has been suggested [58,59],<br />
possibly contributing to the high risk seen among<br />
chimney sweeps.<br />
Stomach <strong>cancer</strong><br />
The incidence of stomach <strong>cancer</strong> in the Nordic<br />
countries is two times higher in men than in women<br />
(Figure 18). Fifty years ago, the rates in Icel<strong>and</strong><br />
were among the highest in the world, <strong>and</strong> were,<br />
as well as the Finnish rates, markedly higher than<br />
in the other three Nordic countries. Along with<br />
the decline in incidence during the past decades,<br />
the differences between the Nordic countries have<br />
become negligible.<br />
In the present study the highest SIR among the<br />
men were observed among fishermen (SIR 1.36,<br />
95% CI 1.29 1.43). Other SIRs that were elevated<br />
in all, or most, countries were among seamen,<br />
miners, chimney sweeps, ‘‘other construction workers’’<br />
<strong>and</strong> several other groups of unskilled workers<br />
(Table 16). The SIRs were lowest among dentists<br />
(0.45, 0.34 0.58), physicians, journalists, religious<br />
workers, teachers <strong>and</strong> several other professions<br />
characterised by high educational level <strong>and</strong> high<br />
social status. For <strong>cancer</strong>s of the gastric cardia (http://<br />
10<br />
8<br />
6<br />
4<br />
2<br />
0<br />
Women<br />
Denmark<br />
Finl<strong>and</strong><br />
Icel<strong>and</strong><br />
Norway<br />
Sweden<br />
1945 1960 1975 1990 2005<br />
Figure 17. Age st<strong>and</strong>ardised (World) incidence rates for oesophageal <strong>cancer</strong> 1943 2005, by country <strong>and</strong> gender. Modified from<br />
NORDCAN [49].
Acta Oncol Downloaded from informahealthcare.com by 212.35.100.66 on 04/06/11<br />
For personal use only.<br />
/ 100 000<br />
astra.<strong>cancer</strong>.fi/NOCCA/Incidence/stomach-cardia),<br />
beverage workers (1.77, 1.14 2.61) <strong>and</strong> fishermen<br />
(1.38, 1.22 1.57) had elevated SIRs <strong>and</strong> physicians<br />
decreased SIR (0.70, 0.50 0.95).<br />
In women, the highest SIR was among ‘‘other<br />
construction workers’’ (1.37, 1.03 1.78), followed<br />
by electrical workers, mechanics <strong>and</strong> other unskilled<br />
workers (Table 17). The SIR was lowest (0.42, 0.23<br />
0.69) among the physicians, followed by journalists,<br />
teachers <strong>and</strong> administrators. The results were consistent,<br />
both within genders <strong>and</strong> within<br />
the Nordic countries. For cardia <strong>cancer</strong> in women<br />
the numbers were too small for conclusions to be<br />
drawn.<br />
Comment. The SIRs were consistently high for unskilled<br />
workers <strong>and</strong> low for occupations characterised<br />
by a high educational level <strong>and</strong> a high social status<br />
[60]. The strongest risk factor identified to date is<br />
chronic bacterial infection with Helicobacter pylori<br />
/ 100 000<br />
80<br />
60<br />
40<br />
20<br />
2<br />
1.5<br />
1<br />
.5<br />
Denmark<br />
Finl<strong>and</strong><br />
Icel<strong>and</strong><br />
Norway<br />
Sweden<br />
Men<br />
Men<br />
Denmark<br />
Finl<strong>and</strong><br />
Icel<strong>and</strong><br />
Norway<br />
Sweden<br />
0<br />
1945 1960 1975 1990 2005<br />
0<br />
1945 1960 1975 1990 2005<br />
/ 100 000<br />
/ 100 000<br />
0<br />
1945 1960 1975 1990 2005<br />
[61]. Another established risk factor is a diet poor in<br />
fruits <strong>and</strong> vegetables <strong>and</strong> rich in red meat <strong>and</strong><br />
processed meat [62], salt <strong>and</strong> salted food [61]. For<br />
gastric <strong>cancer</strong>s of the cardia, smoking is an established<br />
risk factor, whereas H. pylori infection is not [61].<br />
Smoking may also be weakly related to non-cardia<br />
gastric <strong>cancer</strong>.<br />
Stomach <strong>cancer</strong> is not usually thought to have<br />
a strong occupational aetiology. However, workrelated<br />
exposure to airborne particles, especially<br />
cement- <strong>and</strong> silica dust, has repeatedly been<br />
associated with increased risk [63]. The increased<br />
SIRs in the present study for miners, chimney<br />
sweeps <strong>and</strong> construction workers fit with those<br />
findings.<br />
Cancer of the small intestine<br />
Cancer of the small intestine is a rare disease<br />
in the Nordic countries with an increasing trend<br />
(Figure 19).<br />
2<br />
1.5<br />
1<br />
.5<br />
Denmark<br />
Finl<strong>and</strong><br />
Icel<strong>and</strong><br />
Norway<br />
Sweden<br />
Women<br />
0<br />
1945 1960 1975 1990 2005<br />
Figure 19. Age st<strong>and</strong>ardised (World) incidence rates for <strong>cancer</strong> of the small intestine 1943 2005, by country <strong>and</strong> gender. Modified from<br />
NORDCAN [49].<br />
80<br />
60<br />
40<br />
20<br />
<strong>Occupation</strong> <strong>and</strong> <strong>cancer</strong> in Nordic countries 673<br />
Women<br />
Denmark<br />
Finl<strong>and</strong><br />
Icel<strong>and</strong><br />
Norway<br />
Sweden<br />
Figure 18. Age st<strong>and</strong>ardised (World) incidence rates for stomach <strong>cancer</strong> 1943 2005, by country <strong>and</strong> gender. Modified from NORDCAN<br />
[49].
Acta Oncol Downloaded from informahealthcare.com by 212.35.100.66 on 04/06/11<br />
For personal use only.<br />
674 E. Pukkala et al.<br />
Table 14. Observed number of oesophageal <strong>cancer</strong> among men in the Nordic countries <strong>and</strong> st<strong>and</strong>ardised incidence ratios 1961 2005, by<br />
country <strong>and</strong> occupational category.<br />
Denmark Finl<strong>and</strong> Icel<strong>and</strong> Norway Sweden Total<br />
No <strong>Occupation</strong>al category Obs SIR Obs SIR Obs SIR Obs SIR Obs SIR Obs SIR 95% CI<br />
1 Technical workers, etc 233 0.82 121 0.67 5 1.60 70 0.57 590 0.78 1 019 0.76 0.71*0.80<br />
2 Laboratory assistants 6 1.06 3 0.67 [0.57] 0.00 9 1.50 2 0.53 20 0.98 0.60*1.51<br />
3 Physicians 14 0.62 3 0.29 [1.26] 0.00 8 0.49 17 0.49 42 0.49 0.36*0.67<br />
4 Dentists 5 0.73 [2.23] 0.00 1 3.29 4 0.54 10 0.58 20 0.59 0.36*0.91<br />
5 Nurses [0.33] 0.00 [0.55] 0.00 [0.00] 0.00 [0.64] 0.00 3 1.74 3 0.92 0.19*2.70<br />
6 Assistant nurses 4 0.59 [0.50] 0.00 [0.13] 0.00 3 1.07 13 1.10 20 0.91 0.55*1.40<br />
7 ‘‘Other health workers’’ 10 0.50 8 0.79 [0.35] 0.00 5 0.80 14 0.49 37 0.57 0.40*0.78<br />
8 Teachers 75 0.61 24 0.32 2 0.44 43 0.48 128 0.65 272 0.55 0.49*0.62<br />
9 Religious workers etc 39 0.78 28 0.68 2 0.64 19 0.41 102 0.68 190 0.66 0.57*0.76<br />
10 Artistic workers 10 0.64 14 0.96 [0.82] 0.00 17 1.25 68 1.47 109 1.20 0.99*1.45<br />
11 Journalists 12 1.59 4 0.57 1 2.11 6 1.01 27 1.26 50 1.18 0.87*1.55<br />
12 Administrators 308 1.00 80 0.70 7 0.87 157 0.96 311 1.06 863 0.97 0.91*1.04<br />
13 Clerical workers 100 0.73 67 0.89 13 1.41 111 0.89 312 0.99 603 0.91 0.84*0.99<br />
14 Sales agents 56 0.77 88 0.82 2 0.43 158 1.09 505 1.11 809 1.03 0.96*1.10<br />
15 Shop workers 317 1.02 51 1.13 2 0.63 78 1.41 172 1.17 620 1.11 1.02*1.20<br />
16 Farmers 384 0.67 456 0.85 4 0.29 230 0.56 470 0.59 1 544 0.66 0.63*0.70<br />
17 Gardeners 71 0.86 62 0.83 [0.45] 0.00 71 0.70 214 0.73 418 0.76 0.69*0.84<br />
18 Fishermen 39 1.34 7 1.01 10 1.41 119 0.92 30 0.97 205 1.01 0.88*1.15<br />
19 Forestry workers 13 1.08 113 1.31 [0.06] 0.00 64 0.85 162 0.76 352 0.91 0.82*1.01<br />
20 Miners <strong>and</strong> quarry workers 2 0.53 16 1.16 [0.12] 0.00 21 1.01 61 1.17 100 1.10 0.91*1.34<br />
21 Seamen 46 1.42 31 1.66 5 2.44 162 1.58 88 1.93 332 1.65 1.48*1.83<br />
22 Transport workers 55 0.80 41 0.77 3 0.70 47 0.86 135 0.88 281 0.84 0.75*0.94<br />
23 Drivers 263 1.17 186 1.07 5 0.85 204 1.38 468 1.24 1 126 1.21 1.14*1.28<br />
24 Postal workers 28 0.63 32 1.20 1 1.21 27 0.93 73 0.88 161 0.87 0.75*1.02<br />
25 Textile workers 39 1.02 17 0.94 [1.42] 0.00 20 0.63 89 0.95 165 0.90 0.77*1.05<br />
26 Shoe <strong>and</strong> leather workers 8 0.86 7 0.88 [0.31] 0.00 14 1.02 55 1.48 84 1.23 0.98*1.52<br />
27 Smelting workers 116 1.30 26 0.95 [1.89] 0.00 48 1.12 136 0.92 326 1.06 0.95*1.18<br />
28 Mechanics 268 1.13 162 0.93 7 1.24 236 1.15 739 1.08 1 412 1.08 1.02*1.14<br />
29 Plumbers 25 1.16 34 1.17 1 1.07 32 1.35 92 1.16 184 1.19 1.03*1.38<br />
30 Welders 26 0.94 [0.33] 0.00 26 0.99 89 0.99 141 0.98 0.83*1.15<br />
31 Electrical workers 69 1.20 80 1.09 5 1.51 83 0.91 220 0.93 457 0.99 0.90*1.08<br />
32 Wood workers 144 0.89 194 1.04 4 1.17 187 0.77 353 0.77 882 0.84 0.78*0.89<br />
33 Painters 75 1.40 40 1.02 [1.36] 0.00 50 1.23 141 1.06 306 1.14 1.02*1.28<br />
34 ‘‘Other construction workers’’ 239 1.20 168 1.39 12 1.80 66 1.39 330 1.32 815 1.31 1.22*1.40<br />
35 Bricklayers 74 1.27 19 0.98 26 1.08 61 1.02 180 1.11 0.96*1.29<br />
36 Printers 53 1.39 18 1.01 [1.09] 0.00 31 1.27 98 1.36 200 1.30 1.13*1.50<br />
37 Chemical process workers 34 1.00 31 1.05 3 4.81 57 1.05 98 0.88 223 0.97 0.85*1.11<br />
38 Food workers 114 1.02 27 1.26 6 1.10 80 1.30 144 1.28 371 1.19 1.07*1.31<br />
39 Beverage workers 44 3.20 4 2.78 [0.09] 0.00 [0.63] 0.00 13 2.03 61 2.73 2.09*3.51<br />
40 Tobacco workers 5 2.36 [0.25] 0.00 [0.01] 0.00 [0.96] 0.00 [0.50] 0.00 5 1.30 0.42*3.03<br />
41 Glass makers etc 65 1.00 39 1.26 2 2.12 36 1.22 126 1.03 268 1.07 0.95*1.21<br />
42 Packers 89 1.56 78 1.21 3 0.96 153 1.65 293 1.32 616 1.40 1.30*1.52<br />
43 Engine operators 62 1.04 88 1.02 5 1.26 63 1.22 204 1.10 422 1.09 0.99*1.20<br />
44 Public safety workers 48 0.89 35 0.70 1 0.34 49 1.25 87 0.80 220 0.86 0.76*0.99<br />
45 Cooks <strong>and</strong> stewards 8 1.78 6 2.01 4 3.03 41 2.40 37 1.93 96 2.13 1.72*2.60<br />
46 Domestic assistants [0.05] 0.00 [0.20] 0.00 [0.00] 0.00 [0.14] 0.00 3 1.98 3 1.57 0.32*4.60<br />
47 Waiters 41 4.34 7 2.37 [0.14] 0.00 21 2.83 31 3.12 100 3.34 2.75*4.07<br />
48 Building caretakers 55 0.95 28 0.66 1 0.73 28 1.38 98 1.14 210 1.01 0.88*1.16<br />
49 Chimney sweeps 1 0.64 9 2.90 5 2.43 9 1.45 24 1.86 1.19*2.76<br />
50 Hairdressers 13 0.80 1 1.10 1 5.21 7 1.18 23 1.05 45 1.00 0.73*1.33<br />
51 Launderers 8 1.00 2 2.26 [0.13] 0.00 8 2.27 10 0.64 28 0.99 0.66*1.44<br />
52 Military personnel 28 0.93 14 0.88 30 0.91 66 1.04 138 0.97 0.82*1.14<br />
53 ‘‘Other workers’’ 277 1.53 65 1.29 14 1.18 204 1.16 365 1.35 925 1.34 1.26*1.43<br />
54 Economically inactive 191 1.14 461 1.54 9 1.08 154 1.62 659 1.60 1 474 1.50 1.43*1.58<br />
1 54 All categories 4 283 1.00 3 121 1.00 141 1.00 3 388 1.00 8 644 1.00 19 577 1.00 Ref.<br />
Obs observed number of cases; SIR st<strong>and</strong>ardised incidence ratio; 95% CI 95% confidence interval.
Acta Oncol Downloaded from informahealthcare.com by 212.35.100.66 on 04/06/11<br />
For personal use only.<br />
Table 15. Observed number of oesophageal <strong>cancer</strong> among women in the Nordic countries <strong>and</strong> st<strong>and</strong>ardised incidence ratios 1961 2005,<br />
by country <strong>and</strong> occupational category.<br />
Denmark Finl<strong>and</strong> Icel<strong>and</strong> Norway Sweden Total<br />
No <strong>Occupation</strong>al category Obs SIR Obs SIR Obs SIR Obs SIR Obs SIR Obs SIR 95% CI<br />
1 Technical workers, etc 7 1.35 7 0.87 [0.09] 0.00 [1.37] 0.00 9 0.75 23 0.86 0.54*1.29<br />
2 Laboratory assistants 2 0.54 7 1.46 [0.14] 0.00 1 0.55 [2.35] 0.00 10 0.78 0.37*1.44<br />
3 Physicians 7 4.10 [1.83] 0.00 [0.03] 0.00 1 1.32 [2.51] 0.00 8 1.17 0.50*2.30<br />
4 Dentists 2 1.32 [3.13] 0.00 [0.01] 0.00 2 2.99 2 0.88 6 0.79 0.29*1.72<br />
5 Nurses 20 0.66 13 0.54 [0.82] 0.00 5 0.35 35 0.92 73 0.68 0.53*0.85<br />
6 Assistant nurses 20 0.91 19 0.67 1 0.79 9 0.63 54 0.85 103 0.80 0.66*0.97<br />
7 ‘‘Other health workers’’ 19 1.10 13 0.62 [0.22] 0.00 10 0.68 18 0.87 60 0.81 0.62*1.04<br />
8 Teachers 40 1.06 36 0.70 [1.39] 0.00 26 0.94 60 0.70 162 0.79 0.68*0.93<br />
9 Religious workers etc 5 0.98 16 0.87 [0.23] 0.00 6 0.87 22 0.87 49 0.87 0.65*1.16<br />
10 Artistic workers 5 1.87 1 0.26 [0.18] 0.00 3 1.38 8 1.51 17 1.20 0.70*1.93<br />
11 Journalists 1 1.75 [2.55] 0.00 [0.04] 0.00 2 3.67 3 1.25 6 0.98 0.36*2.14<br />
12 Administrators 18 1.12 6 0.69 [0.17] 0.00 7 0.95 19 1.53 50 1.12 0.83*1.48<br />
13 Clerical workers 162 1.05 123 0.78 4 0.88 89 0.99 276 1.31 654 1.06 0.98*1.14<br />
14 Sales agents 2 1.42 17 0.58 1 1.74 15 1.03 46 1.35 81 1.01 0.80*1.26<br />
15 Shop workers 111 1.04 90 0.93 4 1.23 78 0.98 143 0.97 426 0.98 0.90*1.08<br />
16 Farmers 49 0.66 101 1.12 1 0.37 43 0.73 12 0.85 206 0.86 0.75*0.98<br />
17 Gardeners 8 0.83 213 0.97 [0.10] 0.00 19 0.55 46 1.16 286 0.94 0.84*1.06<br />
18 Fishermen [0.38] 0.00 1 2.33 [0.07] 0.00 [0.40] 0.00 [0.13] 0.00 1 0.71 0.02*3.96<br />
19 Forestry workers [0.10] 0.00 [0.80] 0.00 [0.01] 0.00 1 1.64 1 1.25 2 0.86 0.10*3.11<br />
20 Miners <strong>and</strong> quarry workers [0.01] 0.00 [0.42] 0.00 [0.01] 0.00 [0.03] 0.00 [0.18] 0.00 [0.63] 0.00 0.00*5.82<br />
21 Seamen 2 36.17 [0.00] 0.00 [0.09] 0.00 1 67.80 3 18.63 3.84*54.45<br />
22 Transport workers [0.11] 0.00 4 0.74 [0.10] 0.00 [0.39] 0.00 1 0.48 5 0.62 0.20*1.44<br />
23 Drivers 5 1.86 1 0.51 [0.03] 0.00 5 3.25 5 1.03 16 1.45 0.83*2.35<br />
24 Postal workers 8 1.42 35 1.13 2 1.75 16 0.87 34 0.85 95 0.99 0.80*1.21<br />
25 Textile workers 29 0.81 83 1.11 3 1.19 35 1.10 90 0.98 240 1.01 0.89*1.15<br />
26 Shoe <strong>and</strong> leather workers 4 1.52 8 0.90 [0.13] 0.00 2 0.90 10 1.45 24 1.16 0.74*1.72<br />
27 Smelting workers [0.65] 0.00 2 0.96 [0.01] 0.00 [0.21] 0.00 5 3.26 7 1.56 0.63*3.22<br />
28 Mechanics 5 0.79 8 0.92 [0.02] 0.00 3 1.19 16 1.00 32 0.95 0.65*1.34<br />
29 Plumbers [0.06] 0.00 [0.01] 0.00 [0.02] 0.00 [0.02] 0.00 [0.11] 0.00 0.00*34.85<br />
30 Welders [0.55] 0.00 [0.00] 0.00 [0.16] 0.00 [0.50] 0.00 [1.21] 0.00 0.00*3.04<br />
31 Electrical workers 8 0.90 6 1.37 [0.02] 0.00 2 0.76 10 1.13 26 1.05 0.69*1.54<br />
32 Wood workers 2 0.68 13 0.68 [0.03] 0.00 1 1.14 2 0.78 18 0.71 0.42*1.12<br />
33 Painters 1 8.75 2 0.97 [0.01] 0.00 [0.20] 0.00 2 2.75 5 1.60 0.52*3.74<br />
34 ‘‘Other construction workers’’ [0.09] 0.00 10 1.17 [0.00] 0.00 [0.08] 0.00 [0.07] 0.00 10 1.14 0.54*2.09<br />
35 Bricklayers [0.02] 0.00 [0.25] 0.00 [0.00] 0.00 [0.00] 0.00 [0.28] 0.00 0.00*13.29<br />
36 Printers 3 0.89 8 0.92 [0.18] 0.00 2 0.79 10 1.40 23 1.05 0.67*1.58<br />
37 Chemical process workers 6 1.13 5 1.04 [0.09] 0.00 4 1.79 7 1.19 22 1.20 0.75*1.82<br />
38 Food workers 25 0.97 22 0.86 5 1.10 18 1.19 31 1.66 101 1.12 0.93*1.37<br />
39 Beverage workers 5 2.01 1 0.65 [0.01] 0.00 [0.12] 0.00 1 0.82 7 1.30 0.52*2.69<br />
40 Tobacco workers 3 0.88 1 1.19 3 5.64 [0.68] 0.00 7 1.28 0.52*2.64<br />
41 Glass makers etc 5 0.79 19 1.11 1 8.18 6 1.26 20 1.30 51 1.17 0.87*1.54<br />
42 Packers 4 2.21 39 1.30 2 4.13 12 1.03 23 0.97 80 1.18 0.94*1.47<br />
43 Engine operators [0.05] 0.00 3 0.66 [0.01] 0.00 [0.14] 0.00 4 3.49 7 1.18 0.48*2.44<br />
44 Public safety workers [0.21] 0.00 [1.11] 0.00 [0.10] 0.00 [1.53] 0.00 3 2.06 3 0.68 0.14*1.99<br />
45 Cooks <strong>and</strong> stewards [0.07] 0.00 36 1.01 3 1.57 17 0.95 40 1.06 96 1.03 0.83*1.26<br />
46 Domestic assistants 43 1.07 36 1.00 1 1.68 39 0.85 78 0.88 197 0.93 0.81*1.07<br />
47 Waiters 16 2.31 23 0.89 [0.19] 0.00 27 1.52 53 1.43 119 1.35 1.13*1.62<br />
48 Building caretakers 111 0.95 135 1.05 2 0.53 84 1.10 110 1.17 442 1.05 0.96*1.16<br />
49 Chimney sweeps [0.01] 0.00 [0.05] 0.00 [0.01] 0.00 [0.00] 0.00 [0.07] 0.00 0.00*49.31<br />
50 Hairdressers 6 0.87 6 0.59 [0.14] 0.00 8 1.81 18 1.29 38 1.07 0.76*1.47<br />
51 Launderers 17 1.29 13 1.22 [0.67] 0.00 9 1.30 28 1.37 67 1.29 1.00*1.64<br />
52 Military personnel [0.07] 0.00 1 20.68 [0.02] 0.00 1 31.72 2 12.03 1.46*43.44<br />
53 ‘‘Other workers’’ 41 1.24 33 0.91 2 0.58 29 0.75 50 1.22 155 1.02 0.87*1.19<br />
54 Economically inactive 878 1.00 1 137 1.09 17 1.32 606 1.07 1 962 0.95 4 600 1.01 0.98*1.04<br />
1 54 All categories 1 703 1.00 2 355 1.00 49 1.00 1 245 1.00 3 369 1.00 8 721 1.00 Ref.<br />
Obs observed number of cases; SIR st<strong>and</strong>ardised incidence ratio; 95% CI 95% confidence interval.<br />
<strong>Occupation</strong> <strong>and</strong> <strong>cancer</strong> in Nordic countries 675
Acta Oncol Downloaded from informahealthcare.com by 212.35.100.66 on 04/06/11<br />
For personal use only.<br />
676 E. Pukkala et al.<br />
Table 16. Observed number of stomach <strong>cancer</strong> among men in the Nordic countries <strong>and</strong> st<strong>and</strong>ardised incidence ratios 1961 2005, by<br />
country <strong>and</strong> occupational category.<br />
Denmark Finl<strong>and</strong> Icel<strong>and</strong> Norway Sweden Total<br />
No <strong>Occupation</strong>al category Obs SIR Obs SIR Obs SIR Obs SIR Obs SIR Obs SIR 95% CI<br />
1 Technical workers, etc 453 0.79 581 0.79 4 0.45 362 0.66 2 298 0.84 3 698 0.80 0.78*0.83<br />
2 Laboratory assistants 5 0.43 9 0.50 3 1.77 30 1.01 10 1.24 57 0.83 0.63*1.07<br />
3 Physicians 35 0.72 13 0.31 3 0.82 51 0.58 63 0.52 165 0.54 0.47*0.63<br />
4 Dentists 9 0.67 2 0.21 [0.81] 0.00 16 0.40 30 0.47 57 0.45 0.34*0.58<br />
5 Nurses 2 3.45 [1.82] 0.00 [0.02] 0.00 2 0.92 5 1.36 9 1.09 0.50*2.07<br />
6 Assistant nurses 11 0.82 5 3.34 1 2.52 17 1.07 56 1.30 90 1.21 0.97*1.49<br />
7 ‘‘Other health workers’’ 38 0.89 37 0.83 [1.03] 0.00 30 0.87 84 0.77 189 0.81 0.71*0.94<br />
8 Teachers 170 0.69 213 0.69 12 0.90 343 0.76 460 0.69 1 198 0.71 0.67*0.75<br />
9 Religious workers etc 84 0.75 102 0.60 5 0.54 158 0.63 372 0.70 721 0.67 0.63*0.72<br />
10 Artistic workers 33 0.93 50 0.80 2 0.81 48 0.67 116 0.70 249 0.74 0.65*0.83<br />
11 Journalists 7 0.44 16 0.52 [1.43] 0.00 15 0.49 57 0.72 95 0.60 0.49*0.74<br />
12 Administrators 545 0.81 368 0.73 25 1.03 713 0.78 832 0.69 2 483 0.75 0.72*0.78<br />
13 Clerical workers 245 0.83 293 0.84 29 1.04 501 0.77 1 067 0.86 2 135 0.83 0.80*0.87<br />
14 Sales agents 131 0.85 397 0.83 9 0.65 735 0.89 1 518 0.86 2 790 0.86 0.83*0.89<br />
15 Shop workers 598 0.85 146 0.78 8 0.84 251 0.91 466 0.86 1 469 0.86 0.81*0.90<br />
16 Farmers 1 320 0.97 2 963 1.07 31 0.76 2 580 0.95 3 899 1.02 10 793 1.01 0.99*1.03<br />
17 Gardeners 173 0.89 329 0.94 2 1.47 529 0.88 1 349 1.04 2 382 0.97 0.94*1.01<br />
18 Fishermen 80 1.27 35 0.99 25 1.21 1 113 1.41 175 1.23 1 428 1.36 1.29*1.43<br />
19 Forestry workers 28 0.96 467 1.16 [0.20] 0.00 442 0.92 1 017 1.08 1 954 1.05 1.01*1.10<br />
20 Miners <strong>and</strong> quarry workers 4 0.44 87 1.35 [0.32] 0.00 145 1.23 312 1.41 548 1.33 1.22*1.45<br />
21 Seamen 88 1.34 90 1.08 7 1.16 678 1.27 212 1.15 1 075 1.23 1.16*1.30<br />
22 Transport workers 134 0.93 221 0.88 12 0.92 283 0.96 548 0.94 1 198 0.93 0.88*0.98<br />
23 Drivers 562 1.17 803 1.06 24 1.35 879 1.11 1 579 1.12 3 847 1.11 1.08*1.15<br />
24 Postal workers 78 0.91 109 0.91 3 1.18 165 0.97 301 0.90 656 0.92 0.85*0.99<br />
25 Textile workers 98 1.09 74 0.86 5 1.14 193 1.02 406 0.98 776 0.99 0.92*1.06<br />
26 Shoe <strong>and</strong> leather workers 25 1.09 33 0.84 1 1.03 104 1.19 186 1.03 349 1.05 0.95*1.17<br />
27 Smelting workers 217 1.14 152 1.18 8 1.37 250 1.01 694 1.10 1 321 1.10 1.04*1.16<br />
28 Mechanics 535 1.04 752 0.99 25 1.51 1 126 1.05 2 756 1.07 5 194 1.05 1.02*1.08<br />
29 Plumbers 51 1.12 125 1.01 3 1.07 134 1.12 349 1.17 662 1.12 1.04*1.21<br />
30 Welders 120 1.12 2 2.05 114 0.95 345 1.13 581 1.09 1.00*1.18<br />
31 Electrical workers 114 0.97 312 1.01 9 0.93 508 1.08 835 0.99 1 778 1.02 0.97*1.07<br />
32 Wood workers 349 0.97 962 1.06 9 0.89 1 456 1.04 2 128 1.05 4 904 1.04 1.01*1.07<br />
33 Painters 110 0.95 182 0.99 2 0.50 248 1.03 557 0.99 1 099 1.00 0.94*1.06<br />
34 ‘‘Other construction workers’’ 576 1.21 685 1.16 25 1.28 332 1.25 1 301 1.19 2 919 1.20 1.15*1.24<br />
35 Bricklayers 140 1.06 89 0.95 168 1.20 292 1.12 689 1.10 1.02*1.18<br />
36 Printers 72 0.89 72 0.96 2 0.64 121 0.91 265 0.97 532 0.94 0.87*1.03<br />
37 Chemical process workers 101 1.26 130 0.99 6 3.11 354 1.07 567 1.15 1 158 1.12 1.06*1.18<br />
38 Food workers 280 1.12 98 1.02 18 1.06 411 1.14 528 1.13 1 335 1.12 1.06*1.18<br />
39 Beverage workers 40 1.24 8 1.16 1 3.70 2 0.97 30 1.01 81 1.14 0.91*1.42<br />
40 Tobacco workers 3 0.55 1 0.90 [0.02] 0.00 6 0.99 1 0.52 11 0.75 0.38*1.35<br />
41 Glass makers etc 174 1.16 153 1.10 3 1.03 161 1.00 541 1.06 1 032 1.07 1.01*1.14<br />
42 Packers 164 1.18 359 1.18 7 0.72 673 1.21 1 148 1.16 2 351 1.18 1.13*1.23<br />
43 Engine operators 159 1.22 413 1.12 13 1.10 317 1.21 809 1.12 1 711 1.15 1.09*1.20<br />
44 Public safety workers 113 0.93 224 0.99 9 1.01 230 1.03 398 0.99 974 0.99 0.93*1.06<br />
45 Cooks <strong>and</strong> stewards 11 1.13 10 0.80 5 1.29 97 1.10 83 1.21 206 1.13 0.98*1.29<br />
46 Domestic assistants [0.11] 0.00 1 0.93 [0.01] 0.00 [0.59] 0.00 6 1.28 7 1.08 0.44*2.23<br />
47 Waiters 28 1.28 10 0.85 1 2.71 30 0.74 55 1.59 124 1.14 0.95*1.35<br />
48 Building caretakers 157 1.15 225 1.10 5 1.15 144 1.21 425 1.10 956 1.12 1.06*1.20<br />
49 Chimney sweeps 9 2.73 15 1.00 17 1.45 25 1.07 66 1.24 0.96*1.58<br />
50 Hairdressers 27 0.70 3 0.69 1 1.92 36 1.03 91 0.99 158 0.93 0.79*1.08<br />
51 Launderers 21 1.13 5 1.22 2 4.53 20 0.96 69 1.06 117 1.07 0.90*1.29<br />
52 Military personnel 45 0.82 47 0.78 138 0.92 203 0.91 433 0.89 0.81*0.98<br />
53 ‘‘Other workers’’ 481 1.16 254 1.04 35 0.97 1 206 1.08 1 386 1.15 3 362 1.11 1.08*1.15<br />
54 Economically inactive 704 1.38 1 837 1.10 22 0.84 664 1.03 1 986 1.05 5 213 1.10 1.07*1.13<br />
1 54 All categories 9 637 1.00 14 687 1.00 424 1.00 19 346 1.00 35 291 1.00 79 385 1.00 Ref.<br />
Obs observed number of cases; SIR st<strong>and</strong>ardised incidence ratio; 95% CI 95% confidence interval.
Acta Oncol Downloaded from informahealthcare.com by 212.35.100.66 on 04/06/11<br />
For personal use only.<br />
Table 17. Observed number of stomach <strong>cancer</strong> among women in the Nordic countries <strong>and</strong> st<strong>and</strong>ardised incidence ratios 1961 2005, by<br />
country <strong>and</strong> occupational category.<br />
Denmark Finl<strong>and</strong> Icel<strong>and</strong> Norway Sweden Total<br />
No <strong>Occupation</strong>al category Obs SIR Obs SIR Obs SIR Obs SIR Obs SIR Obs SIR 95% CI<br />
1 Technical workers, etc 12 0.79 38 0.82 [0.42] 0.00 5 0.51 59 0.86 114 0.81 0.68*0.98<br />
2 Laboratory assistants 11 1.08 26 0.98 [0.69] 0.00 15 1.06 12 1.01 64 1.01 0.77*1.28<br />
3 Physicians 3 0.60 7 0.63 [0.15] 0.00 1 0.16 4 0.29 15 0.42 0.23*0.69<br />
4 Dentists 1 0.22 15 0.99 [0.05] 0.00 2 0.33 14 1.06 32 0.82 0.56*1.16<br />
5 Nurses 85 0.94 120 0.90 3 0.80 102 0.97 164 0.75 474 0.86 0.78*0.94<br />
6 Assistant nurses 61 0.97 141 0.95 2 0.37 86 0.85 399 1.12 689 1.03 0.95*1.11<br />
7 ‘‘Other health workers’’ 42 0.81 111 0.97 2 1.99 106 0.91 101 0.87 362 0.90 0.82*1.00<br />
8 Teachers 80 0.73 193 0.73 4 0.62 152 0.67 332 0.66 761 0.69 0.64*0.74<br />
9 Religious workers etc 11 0.73 88 0.79 [1.03] 0.00 61 1.14 101 0.69 261 0.80 0.71*0.90<br />
10 Artistic workers 7 0.83 10 0.48 [0.84] 0.00 17 0.92 28 0.92 62 0.79 0.60*1.01<br />
11 Journalists 1 0.59 7 0.52 [0.21] 0.00 5 1.18 6 0.44 19 0.57 0.34*0.89<br />
12 Administrators 31 0.62 37 0.80 [0.77] 0.00 50 0.78 63 0.84 181 0.77 0.67*0.89<br />
13 Clerical workers 389 0.87 712 0.85 22 1.07 535 0.73 984 0.83 2 642 0.82 0.79*0.85<br />
14 Sales agents 4 0.94 140 0.97 2 0.81 122 0.87 190 0.86 458 0.90 0.82*0.98<br />
15 Shop workers 343 1.06 465 0.96 15 1.06 630 0.96 849 0.97 2 302 0.98 0.94*1.02<br />
16 Farmers 192 0.87 429 1.08 12 1.04 503 0.95 108 1.10 1 244 0.99 0.94*1.05<br />
17 Gardeners 27 0.94 1 025 1.01 [0.39] 0.00 317 1.05 269 1.11 1 638 1.03 0.98*1.08<br />
18 Fishermen 1 0.91 5 2.45 3 9.22 1 0.32 3 3.70 13 1.76 0.94*3.02<br />
19 Forestry workers [0.29] 0.00 4 1.04 [0.05] 0.00 5 1.07 3 0.63 12 0.88 0.46*1.54<br />
20 Miners <strong>and</strong> quarry workers [0.02] 0.00 2 1.03 [0.02] 0.00 [0.21] 0.00 [0.97] 0.00 2 0.63 0.08*2.29<br />
21 Seamen [0.37] 0.00 [0.00] 0.00 [0.71] 0.00 [0.09] 0.00 [1.16] 0.00 0.00*3.19<br />
22 Transport workers [0.32] 0.00 21 0.81 1 2.34 7 2.26 17 1.35 46 1.09 0.80*1.45<br />
23 Drivers 8 1.01 15 1.45 [0.16] 0.00 8 0.65 32 1.18 63 1.09 0.84*1.39<br />
24 Postal workers 12 0.70 130 0.86 3 0.60 133 0.85 227 0.99 505 0.90 0.82*0.98<br />
25 Textile workers 113 1.06 363 1.01 15 1.45 317 1.04 617 1.05 1 425 1.04 0.99*1.10<br />
26 Shoe <strong>and</strong> leather workers 11 1.41 39 0.90 3 5.55 28 1.34 49 1.13 130 1.12 0.94*1.33<br />
27 Smelting workers 3 1.56 8 0.79 [0.02] 0.00 1 0.71 12 1.44 24 1.10 0.71*1.64<br />
28 Mechanics 24 1.32 44 1.01 [0.07] 0.00 24 1.11 128 1.38 220 1.25 1.10*1.43<br />
29 Plumbers [0.21] 0.00 [0.08] 0.00 1 8.17 [0.08] 0.00 1 2.00 0.05*11.15<br />
30 Welders 5 1.68 [0.00] 0.00 1 0.99 2 0.75 8 1.20 0.52*2.37<br />
31 Electrical workers 37 1.45 28 1.14 1 11.80 27 1.25 62 1.23 155 1.27 1.09*1.49<br />
32 Wood workers 10 1.18 101 1.11 1 6.40 7 1.07 14 0.97 133 1.10 0.93*1.30<br />
33 Painters [0.35] 0.00 11 1.07 [0.04] 0.00 2 1.29 5 1.17 18 1.09 0.65*1.72<br />
34 ‘‘Other construction workers’’ [0.29] 0.00 54 1.37 [0.02] 0.00 1 1.60 1 2.36 56 1.37 1.03*1.78<br />
35 Bricklayers [0.05] 0.00 2 1.68 [0.03] 0.00 [0.01] 0.00 2 1.56 0.19*5.65<br />
36 Printers 14 1.41 39 0.90 [0.75] 0.00 35 1.50 56 1.30 144 1.19 1.01*1.41<br />
37 Chemical process workers 18 1.13 32 1.38 [0.38] 0.00 16 0.79 42 1.18 108 1.13 0.94*1.37<br />
38 Food workers 85 1.12 128 1.05 23 1.20 153 1.12 137 1.14 526 1.11 1.02*1.21<br />
39 Beverage workers 11 1.44 6 0.83 [0.05] 0.00 2 2.21 12 1.48 31 1.29 0.88*1.84<br />
40 Tobacco workers 14 1.34 5 1.27 5 0.89 3 0.77 27 1.13 0.74*1.64<br />
41 Glass makers etc 12 0.66 93 1.12 1 1.96 47 1.13 98 1.07 251 1.07 0.94*1.21<br />
42 Packers 10 1.88 168 1.15 2 1.01 117 1.16 166 1.15 463 1.16 1.06*1.27<br />
43 Engine operators [0.14] 0.00 19 0.83 [0.03] 0.00 2 2.19 12 2.11 33 1.12 0.77*1.57<br />
44 Public safety workers 2 2.79 12 2.18 [0.39] 0.00 13 1.03 9 1.05 36 1.30 0.91*1.79<br />
45 Cooks <strong>and</strong> stewards [0.22] 0.00 200 1.17 7 0.90 175 1.03 244 0.97 626 1.04 0.96*1.12<br />
46 Domestic assistants 126 1.04 172 0.97 3 1.24 420 0.99 628 1.10 1 349 1.04 0.99*1.10<br />
47 Waiters 25 1.21 128 0.98 1 1.27 185 1.19 248 1.07 587 1.09 1.00*1.18<br />
48 Building caretakers 359 1.01 623 1.03 18 1.15 724 1.14 697 1.16 2 421 1.10 1.05*1.14<br />
49 Chimney sweeps [0.04] 0.00 [0.26] 0.00 [0.08] 0.00 [0.01] 0.00 [0.39] 0.00 0.00*9.53<br />
50 Hairdressers 15 0.74 51 1.00 [0.62] 0.00 25 0.64 79 0.99 170 0.89 0.76*1.03<br />
51 Launderers 46 1.15 50 1.01 2 0.73 71 1.09 163 1.21 332 1.14 1.02*1.27<br />
52 Military personnel [0.21] 0.00 [0.34] 0.00 [0.12] 0.00 [0.17] 0.00 [0.83] 0.00 0.00*4.43<br />
53 ‘‘Other workers’’ 102 1.01 185 1.05 14 0.95 333 1.02 288 1.13 922 1.06 0.99*1.13<br />
54 Economically inactive 3 033 1.03 4 853 1.04 49 0.91 6 256 1.03 13 464 1.01 27 655 1.02 1.01*1.03<br />
1 54 All categories 5 391 1.00 11 160 1.00 209 1.0011 851 1.00 21 201 1.00 49 812 1.00 Ref.<br />
Obs observed number of cases; SIR st<strong>and</strong>ardised incidence ratio; 95% CI 95% confidence interval.<br />
<strong>Occupation</strong> <strong>and</strong> <strong>cancer</strong> in Nordic countries 677
Acta Oncol Downloaded from informahealthcare.com by 212.35.100.66 on 04/06/11<br />
For personal use only.<br />
678 E. Pukkala et al.<br />
Only a modest occupational variation was found<br />
in the incidence of small intestine <strong>cancer</strong>. Among<br />
men, postal workers topped the list with an SIR<br />
of 1.32 (95% CI 1.04 1.65), <strong>and</strong> forestry workers<br />
(0.76, 0.63 0.93), gardeners <strong>and</strong> farmers were at the<br />
bottom (Table 18). For women (Table 19), the only<br />
occupational category with a statistically significant<br />
value different from 1 was glass, ceramic <strong>and</strong> tile<br />
workers (0.55, 0.31 0.91).<br />
Comment. Tumours occurring in the small intestine<br />
can be adenocarcinomas (30 40%), carcinoid<br />
(about 35%), lymphomas (15 20%; included in<br />
non-Hodgkin lymphoma in the present study), or<br />
sarcomas (10 15%). Little is known about environmental<br />
determinants of small intestinal <strong>cancer</strong>.<br />
So far, no occupational studies have convincingly<br />
indicated any associations between exposure to<br />
occupational agents <strong>and</strong> small intestine <strong>cancer</strong><br />
[64].<br />
Colon <strong>cancer</strong><br />
The incidence of colon <strong>cancer</strong> in the Nordic countries<br />
varies about 1.5-fold. It is slightly higher in men than<br />
in women (Figure 20). In males, the rates in Norway<br />
have been twofold as compared to the rates in<br />
Finl<strong>and</strong>, <strong>and</strong> incidence rates are increasing in all<br />
Nordic countries in both males <strong>and</strong> females.<br />
The highest SIRs among men were observed<br />
in chimney sweeps (SIR 1.52, 95% CI 1.25 1.84),<br />
waiters, beverage workers <strong>and</strong> administrators<br />
(Table 20). The SIRs were lowest in forestry workers<br />
(0.75, 0.71 0.78), farmers <strong>and</strong> gardeners.<br />
Among women, the variation in colon <strong>cancer</strong><br />
incidence was small. Only printers, chemical process<br />
workers <strong>and</strong> administrators had significant SIRs<br />
/ 100 000<br />
30<br />
25<br />
20<br />
15<br />
10<br />
5<br />
Denmark<br />
Finl<strong>and</strong><br />
Icel<strong>and</strong><br />
Norway<br />
Sweden<br />
Men<br />
0<br />
1945 1960 1975 1990 2005<br />
/ 100 000<br />
greater than 1.1, <strong>and</strong> only farmers <strong>and</strong> gardeners<br />
had SIRs smaller than 0.9 (Table 21).<br />
Comment. Several dietary factors, e.g. a high consumption<br />
of animal fat <strong>and</strong> meat have been suggested<br />
to increase the risk of colon <strong>cancer</strong>, while<br />
other factors, e.g. a high consumption of fibre, fruit<br />
<strong>and</strong> vegetables, have been suggested to decrease the<br />
risk [65]. Physical activity protects against colon<br />
<strong>cancer</strong>. The joint exposures to tobacco <strong>and</strong> alcohol<br />
drinking could contribute to the increased risk in<br />
beverage workers <strong>and</strong> waiters.<br />
For women, the variation in colon <strong>cancer</strong><br />
incidence is relatively small between professions.<br />
Even among men the differences in SIR between<br />
different occupational categories is rather small.<br />
According to previous research, sedentary work,<br />
such as work done for example by highly educated<br />
workers, seems to be related to increased<br />
risk of colon <strong>cancer</strong> [66]. The effect of physical<br />
activity is not strongly reflected to the occupational<br />
risk pattern of our study. The occupational<br />
categories with highest SIRs (male waiters <strong>and</strong><br />
chimney sweeps) do not generally imply sedentary<br />
work.<br />
Rectal <strong>cancer</strong><br />
The incidence of rectal <strong>cancer</strong> is higher in men<br />
than in women in all Nordic countries. Rates have<br />
been consistently high in Denmark <strong>and</strong> have<br />
increased in the other countries, especially in<br />
Norway (Figure 21).<br />
The incidence of rectal <strong>cancer</strong> was highest<br />
among male waiters (SIR 1.41, 95% CI 1.21<br />
1.65) <strong>and</strong> beverage workers (1.40, 1.16 1.68).<br />
None of the significantly low SIRs among the<br />
men were below 0.85 (Table 22). In women the<br />
30<br />
25<br />
20<br />
15<br />
10<br />
5<br />
Denmark<br />
Finl<strong>and</strong><br />
Icel<strong>and</strong><br />
Norway<br />
Sweden<br />
Women<br />
0<br />
1945 1960 1975 1990 2005<br />
Figure 20. Age st<strong>and</strong>ardised (World) incidence rates for colon <strong>cancer</strong> 1943 2005, by country <strong>and</strong> gender. Modified from NORDCAN<br />
[49].
Acta Oncol Downloaded from informahealthcare.com by 212.35.100.66 on 04/06/11<br />
For personal use only.<br />
Table 18. Observed number of <strong>cancer</strong> of the small intestine among men in the Nordic countries <strong>and</strong> st<strong>and</strong>ardised incidence ratios 1961<br />
2005, by country <strong>and</strong> occupational category.<br />
Denmark Finl<strong>and</strong> Icel<strong>and</strong> Norway Sweden Total<br />
No <strong>Occupation</strong>al category Obs SIR Obs SIR Obs SIR Obs SIR Obs SIR Obs SIR 95% CI<br />
1 Technical workers, etc 52 1.11 58 1.05 2 1.74 32 0.80 324 1.00 468 1.00 0.92*1.10<br />
2 Laboratory assistants 1 1.06 2 1.46 [0.21] 0.00 1 0.54 2 1.15 6 0.98 0.36*2.14<br />
3 Physicians 5 1.29 2 0.63 [0.41] 0.00 8 1.60 18 1.20 33 1.20 0.83*1.69<br />
4 Dentists 2 1.80 [0.65] 0.00 [0.11] 0.00 [2.23] 0.00 7 0.97 9 0.80 0.36*1.51<br />
5 Nurses [0.05] 0.00 1 4.78 [0.00] 0.00 [0.26] 0.00 [0.99] 0.00 1 0.66 0.02*3.69<br />
6 Assistant nurses 1 0.90 1 5.05 [0.05] 0.00 2 2.44 5 0.94 9 1.20 0.55*2.27<br />
7 ‘‘Other health workers’’ 2 0.59 4 1.31 [0.12] 0.00 3 1.58 15 1.21 24 1.15 0.74*1.71<br />
8 Teachers 23 1.13 33 1.47 1 0.65 24 0.84 95 1.13 176 1.12 0.97*1.30<br />
9 Religious workers etc 9 1.03 13 1.02 1 0.96 15 1.06 70 1.07 108 1.06 0.88*1.28<br />
10 Artistic workers 2 0.73 6 1.38 [0.28] 0.00 3 0.73 24 1.22 35 1.12 0.78*1.56<br />
11 Journalists [1.27] 0.00 3 1.41 [0.17] 0.00 2 1.10 11 1.20 16 1.10 0.63*1.79<br />
12 Administrators 48 0.90 47 1.40 1 0.41 55 1.13 143 1.18 294 1.13 1.01*1.27<br />
13 Clerical workers 22 0.94 21 0.97 5 1.80 39 1.05 155 1.18 242 1.12 0.99*1.27<br />
14 Sales agents 11 0.90 40 1.26 2 1.41 52 1.24 227 1.19 332 1.19 1.07*1.33<br />
15 Shop workers 60 1.11 8 0.58 1 1.02 20 1.17 77 1.25 166 1.12 0.97*1.31<br />
16 Farmers 73 0.70 129 0.91 2 0.52 92 0.84 244 0.78 540 0.81 0.74*0.88<br />
17 Gardeners 10 0.68 14 0.66 [0.12] 0.00 27 0.97 93 0.79 144 0.80 0.68*0.94<br />
18 Fishermen 10 2.02 3 1.60 4 1.48 35 0.99 8 0.65 60 1.05 0.80*1.35<br />
19 Forestry workers [2.19] 0.00 20 0.80 [0.02] 0.00 23 1.14 58 0.68 101 0.76 0.63*0.93<br />
20 Miners <strong>and</strong> quarry workers [0.68] 0.00 2 0.50 [0.04] 0.00 8 1.35 21 0.99 31 0.97 0.66*1.38<br />
21 Seamen 7 1.32 9 1.66 1 1.44 30 0.97 22 1.16 69 1.13 0.88*1.43<br />
22 Transport workers 11 0.95 13 0.82 [1.31] 0.00 17 1.07 66 1.02 107 0.98 0.81*1.18<br />
23 Drivers 39 1.03 54 1.04 1 0.50 57 1.29 175 1.10 326 1.10 0.99*1.23<br />
24 Postal workers 11 1.53 6 0.76 1 4.15 9 1.08 50 1.44 77 1.32 1.04*1.65<br />
25 Textile workers 13 1.91 4 0.80 1 2.52 10 1.13 48 1.28 76 1.30 1.02*1.63<br />
26 Shoe <strong>and</strong> leather workers 4 2.35 1 0.46 [0.08] 0.00 2 0.55 20 1.38 27 1.22 0.81*1.78<br />
27 Smelting workers 9 0.60 8 1.04 1 1.68 20 1.63 44 0.73 82 0.86 0.68*1.07<br />
28 Mechanics 41 1.01 54 1.04 2 1.03 55 0.89 279 0.96 431 0.97 0.88*1.06<br />
29 Plumbers 6 1.67 5 0.58 1 3.22 8 1.10 41 1.23 61 1.15 0.88*1.47<br />
30 Welders 7 0.82 [0.12] 0.00 14 1.65 39 1.01 60 1.08 0.82*1.38<br />
31 Electrical workers 13 1.38 19 0.85 1 0.81 34 1.23 113 1.12 180 1.11 0.96*1.29<br />
32 Wood workers 22 0.79 40 0.76 [1.06] 0.00 68 0.99 171 0.91 301 0.89 0.80*1.00<br />
33 Painters 9 0.98 10 0.89 [0.44] 0.00 6 0.53 57 1.04 82 0.94 0.75*1.17<br />
34 ‘‘Other construction workers’’ 41 1.15 35 1.02 5 2.21 14 1.00 99 0.98 194 1.04 0.90*1.19<br />
35 Bricklayers 7 0.69 4 0.73 10 1.47 26 1.07 47 1.00 0.74*1.34<br />
36 Printers 7 1.10 6 1.12 1 2.64 8 1.10 32 1.06 54 1.09 0.82*1.42<br />
37 Chemical process workers 2 0.33 9 1.04 [0.19] 0.00 9 0.60 55 1.22 75 1.00 0.79*1.26<br />
38 Food workers 24 1.24 5 0.80 3 1.93 14 0.81 41 0.89 87 0.96 0.77*1.18<br />
39 Beverage workers 3 1.24 [0.41] 0.00 [0.02] 0.00 [0.24] 0.00 3 1.19 6 1.07 0.39*2.33<br />
40 Tobacco workers 2 5.06 [0.07] 0.00 [0.00] 0.00 1 3.95 [0.21] 0.00 3 3.21 0.66*9.38<br />
41 Glass makers etc 10 0.87 14 1.53 [0.28] 0.00 5 0.57 59 1.17 88 1.10 0.88*1.36<br />
42 Packers 9 0.87 27 1.46 1 1.10 20 0.77 76 0.85 133 0.92 0.77*1.09<br />
43 Engine operators 9 0.88 29 1.13 [1.34] 0.00 12 0.75 86 1.11 136 1.04 0.88*1.23<br />
44 Public safety workers 3 0.32 15 1.03 1 1.11 14 1.24 44 0.96 77 0.94 0.74*1.17<br />
45 Cooks <strong>and</strong> stewards 2 2.65 1 1.00 1 2.13 5 0.95 7 0.83 16 1.01 0.57*1.63<br />
46 Domestic assistants [0.01] 0.00 [0.06] 0.00 [0.00] 0.00 [0.05] 0.00 2 2.42 2 2.13 0.26*7.71<br />
47 Waiters 3 1.83 3 3.10 [0.05] 0.00 3 1.36 2 0.46 11 1.20 0.60*2.14<br />
48 Building caretakers 14 1.36 11 0.91 [0.36] 0.00 7 1.20 32 0.91 64 1.00 0.77*1.28<br />
49 Chimney sweeps [0.26] 0.00 1 1.12 1 1.70 4 1.54 6 1.38 0.51*3.01<br />
50 Hairdressers 3 1.02 [0.26] 0.00 [0.06] 0.00 1 0.61 10 1.12 14 1.01 0.55*1.69<br />
51 Launderers 1 0.70 [0.26] 0.00 [0.03] 0.00 1 1.01 10 1.56 12 1.31 0.68*2.30<br />
52 Military personnel 5 1.06 2 0.39 13 1.28 27 0.99 47 1.00 0.73*1.32<br />
53 ‘‘Other workers’’ 37 1.17 11 0.76 4 1.10 40 0.84 94 0.87 186 0.90 0.78*1.04<br />
54 Economically inactive 46 1.40 78 1.07 1 0.38 27 1.09 139 0.84 291 0.98 0.87*1.10<br />
1 54 All categories 744 1.00 888 1.00 45 1.00 976 1.00 3 570 1.00 6 223 1.00 Ref.<br />
Obs observed number of cases; SIR st<strong>and</strong>ardised incidence ratio; 95% CI 95% confidence interval.<br />
<strong>Occupation</strong> <strong>and</strong> <strong>cancer</strong> in Nordic countries 679
Acta Oncol Downloaded from informahealthcare.com by 212.35.100.66 on 04/06/11<br />
For personal use only.<br />
680 E. Pukkala et al.<br />
Table 19. Observed number of <strong>cancer</strong> of the small intestine among women in the Nordic countries <strong>and</strong> st<strong>and</strong>ardised incidence ratios<br />
1961 2005, by country <strong>and</strong> occupational category.<br />
Denmark Finl<strong>and</strong> Icel<strong>and</strong> Norway Sweden Total<br />
No <strong>Occupation</strong>al category Obs SIR Obs SIR Obs SIR Obs SIR Obs SIR Obs SIR 95% CI<br />
1 Technical workers, etc 4 2.01 3 0.67 [0.08] 0.00 1 0.70 13 1.06 21 1.04 0.64*1.58<br />
2 Laboratory assistants 1 0.71 4 1.59 [0.13] 0.00 [1.77] 0.00 1 0.32 6 0.67 0.25*1.46<br />
3 Physicians 1 1.52 2 1.81 [0.02] 0.00 1 1.40 2 0.73 6 1.14 0.42*2.49<br />
4 Dentists 1 1.70 3 2.56 [0.01] 0.00 [0.59] 0.00 5 2.27 9 1.97 0.90*3.74<br />
5 Nurses 16 1.37 14 1.09 1 1.61 16 1.14 35 0.94 82 1.07 0.85*1.33<br />
6 Assistant nurses 12 1.43 12 0.94 [0.82] 0.00 22 1.56 71 1.10 117 1.16 0.97*1.39<br />
7 ‘‘Other health workers’’ 5 0.75 11 1.09 [0.18] 0.00 14 1.01 22 1.02 52 0.99 0.74*1.30<br />
8 Teachers 16 1.10 26 1.12 1 0.95 19 0.73 88 1.05 150 1.01 0.86*1.18<br />
9 Religious workers etc 4 2.02 13 1.12 [0.16] 0.00 4 0.62 30 1.12 51 1.08 0.81*1.42<br />
10 Artistic workers [1.05] 0.00 2 1.05 [0.14] 0.00 1 0.52 5 0.94 8 0.77 0.33*1.52<br />
11 Journalists [0.22] 0.00 3 2.46 [0.03] 0.00 [0.53] 0.00 4 1.63 7 1.57 0.63*3.24<br />
12 Administrators 6 0.96 3 0.73 [0.11] 0.00 11 1.73 14 1.17 34 1.18 0.82*1.65<br />
13 Clerical workers 62 1.04 76 1.01 2 0.61 77 0.93 210 1.01 427 1.00 0.91*1.09<br />
14 Salesagents [0.54] 0.00 9 0.82 [0.36] 0.00 16 1.44 27 0.91 52 0.99 0.74*1.29<br />
15 Shop workers 37 0.90 27 0.68 [2.09] 0.00 69 1.00 137 1.04 270 0.95 0.84*1.07<br />
16 Farmers 26 0.91 15 0.62 3 1.96 44 0.97 11 0.94 99 0.89 0.72*1.08<br />
17 Gardeners 3 0.81 74 1.05 [0.05] 0.00 28 1.03 34 0.98 139 1.02 0.86*1.21<br />
18 Fishermen [0.14] 0.00 [0.16] 0.00 [0.05] 0.00 [0.36] 0.00 [0.11] 0.00 [0.82] 0.00 0.00*4.50<br />
19 Forestry workers [0.04] 0.00 [0.31] 0.00 [0.01] 0.00 2 3.83 [0.73] 0.00 2 1.24 0.15*4.49<br />
20 Miners <strong>and</strong> quarry workers [0.00] 0.00 [0.13] 0.00 [0.00] 0.00 [0.03] 0.00 [0.17] 0.00 [0.33] 0.00 0.00*11.11<br />
21 Seamen [0.04] 0.00 [0.00] 0.00 1 12.11 [0.02] 0.00 1 7.20 0.18*40.12<br />
22 Transport workers [0.04] 0.00 1 0.52 [0.05] 0.00 1 2.63 1 0.49 3 0.68 0.14*1.97<br />
23 Drivers 2 1.95 1 1.07 [0.03] 0.00 [1.39] 0.00 6 1.21 9 1.08 0.49*2.05<br />
24 Postal workers 2 0.92 11 0.93 2 2.73 13 0.82 48 1.28 76 1.11 0.88*1.39<br />
25 Textile workers 8 0.58 34 1.27 [1.23] 0.00 26 1.06 76 0.98 144 1.00 0.85*1.18<br />
26 Shoe <strong>and</strong> leather workers 1 0.99 2 0.60 [0.06] 0.00 2 1.13 7 1.18 12 0.99 0.51*1.74<br />
27 Smelting workers [0.25] 0.00 [0.77] 0.00 [0.00] 0.00 [0.21] 0.00 4 2.58 4 1.43 0.39*3.67<br />
28 Mechanics 5 2.08 6 1.70 [0.01] 0.00 2 0.90 14 0.89 27 1.13 0.75*1.65<br />
29 Plumbers [0.02] 0.00 [0.01] 0.00 [0.02] 0.00 [0.02] 0.00 [0.07] 0.00 0.00*52.85<br />
30 Welders [0.28] 0.00 [0.00] 0.00 [0.17] 0.00 [0.57] 0.00 [1.02] 0.00 0.00*3.60<br />
31 Electrical workers 5 1.48 2 0.87 [0.01] 0.00 1 0.42 5 0.57 13 0.77 0.41*1.32<br />
32 Wood workers [1.12] 0.00 8 1.19 [0.02] 0.00 1 1.22 3 1.16 12 1.06 0.55*1.86<br />
33 Painters [0.04] 0.00 [0.79] 0.00 [0.01] 0.00 1 5.48 [0.70] 0.00 1 0.58 0.01*3.23<br />
34 ‘‘Other construction workers’’ [0.03] 0.00 1 0.38 [0.00] 0.00 [0.07] 0.00 [0.08] 0.00 1 0.35 0.01*1.95<br />
35 Bricklayers [0.01] 0.00 [0.09] 0.00 [0.00] 0.00 [0.00] 0.00 [0.11] 0.00 0.00*34.69<br />
36 Printers 2 1.55 3 0.88 [0.11] 0.00 [2.12] 0.00 5 0.75 10 0.74 0.35*1.35<br />
37 Chemical process workers 3 1.47 2 1.15 [0.05] 0.00 4 2.11 9 1.70 18 1.63 0.97*2.58<br />
38 Food workers 10 1.01 14 1.55 3 1.18 10 0.83 21 1.31 58 1.17 0.89*1.51<br />
39 Beverage workers [0.96] 0.00 1 1.99 [0.01] 0.00 [0.11] 0.00 [1.01] 0.00 1 0.39 0.01*2.15<br />
40 Tobacco workers 4 3.04 2 7.01 [0.41] 0.00 [0.64] 0.00 6 2.27 0.83*4.93<br />
41 Glass makers etc 2 0.83 2 0.31 [0.07] 0.00 2 0.49 9 0.64 15 0.55 0.31*0.91<br />
42 Packers 1 1.44 14 1.24 1 3.94 13 1.32 23 1.09 52 1.20 0.90*1.58<br />
43 Engine operators [0.02] 0.00 2 1.09 [0.00] 0.00 [0.14] 0.00 1 0.78 3 0.91 0.19*2.67<br />
44 Public safety workers [0.08] 0.00 [0.44] 0.00 [0.04] 0.00 [1.21] 0.00 2 1.22 2 0.59 0.07*2.12<br />
45 Cooks <strong>and</strong> stewards [0.03] 0.00 14 1.10 2 2.16 16 1.19 34 1.10 66 1.14 0.88*1.45<br />
46 Domestic assistants 19 1.23 11 0.80 [0.27] 0.00 35 0.99 73 0.91 138 0.95 0.81*1.13<br />
47 Waiters 2 0.75 11 1.02 [0.10] 0.00 16 1.07 32 1.00 61 1.01 0.77*1.29<br />
48 Building caretakers 39 0.86 34 0.78 1 0.53 65 1.01 88 1.07 227 0.96 0.84*1.09<br />
49 Chimney sweeps [0.00] 0.00 [0.02] 0.00 [0.01] 0.00 [0.00] 0.00 [0.04] 0.00 0.00*103.96<br />
50 Hairdressers 3 1.12 3 0.72 [0.10] 0.00 5 1.30 13 0.98 24 1.00 0.64*1.48<br />
51 Launderers 4 0.79 3 0.88 [0.30] 0.00 4 0.74 18 1.07 29 0.93 0.63*1.34<br />
52 Military personnel [0.03] 0.00 1 21.70 [0.02] 0.00 [0.05] 0.00 1 7.26 0.18*40.47<br />
53 ‘‘Other workers’’ 9 0.70 17 1.26 2 1.02 28 0.84 36 0.98 92 0.94 0.75*1.15<br />
54 Economicallyinactive 351 1.01 303 1.03 10 1.54 409 1.01 1 696 0.98 2 769 1.00 0.96*1.04<br />
1 54 All categories 666 1.00 800 1.00 28 1.00 980 1.00 2 933 1.00 5 407 1.00 Ref.<br />
Obs observed number of cases; SIR st<strong>and</strong>ardised incidence ratio; 95% CI 95% confidence interval.
Acta Oncol Downloaded from informahealthcare.com by 212.35.100.66 on 04/06/11<br />
For personal use only.<br />
/ 100 000<br />
25<br />
20<br />
15<br />
10<br />
5<br />
Denmark<br />
Finl<strong>and</strong><br />
Icel<strong>and</strong><br />
Norway<br />
Sweden<br />
Men<br />
0<br />
1945 1960 1975 1990 2005<br />
SIRs were high among chimney sweeps (6.71,<br />
1.38 19.61, based on only 3 cases), <strong>and</strong> tobacco<br />
manufacture workers (Table 23). A low SIR was<br />
observed among the female beverage manufacture<br />
workers (0.59, 0.36 0.92).<br />
Comment. The variation in rectal <strong>cancer</strong> risk between<br />
occupational categories is very small. Workers in<br />
tobacco manufacturing may smoke more than the<br />
general population, <strong>and</strong> hence the increased risk<br />
among females working in tobacco manufacturing<br />
may be explained by smoking, which is an established<br />
risk factor of rectal <strong>cancer</strong> [65]. The increased<br />
risk among male <strong>and</strong> decreased risk among female<br />
beverage workers may well be an example of a<br />
situation where the men <strong>and</strong> women under the<br />
same occupational code do different types of work.<br />
Men may work mainly with beer brewing, while<br />
women with other types of beverages. Earlier studies<br />
/ 100 000<br />
25<br />
20<br />
15<br />
10<br />
5<br />
Women<br />
Denmark<br />
Finl<strong>and</strong><br />
Icel<strong>and</strong><br />
Norway<br />
Sweden<br />
0<br />
1945 1960 1975 1990 2005<br />
Figure 21. Age st<strong>and</strong>ardised (World) incidence rates for rectal <strong>cancer</strong> 1943 2005, by country <strong>and</strong> gender. Modified from NORDCAN<br />
[49].<br />
/ 100 000<br />
5<br />
4<br />
3<br />
2<br />
1<br />
0<br />
Denmark<br />
Finl<strong>and</strong><br />
Icel<strong>and</strong><br />
Norway<br />
Sweden<br />
Men<br />
1945 1960 1975 1990 2005<br />
/ 100 000<br />
suggest that alcohol consumption which may be<br />
high among brewery workers may increase the<br />
risk of rectal <strong>cancer</strong>. Lack of physical activity or<br />
sedentary work has not been clearly associated with<br />
the risk of rectal <strong>cancer</strong> [66].<br />
Liver <strong>cancer</strong><br />
Liver <strong>cancer</strong> is rare in the Nordic countries. The<br />
pattern is very similar in the two genders, although<br />
with a lower rate among women (Figure 22).<br />
Among men, waiters (SIR 4.22, 95% CI 3.47<br />
5.13), cooks, beverage workers, journalists <strong>and</strong> seamen<br />
ranked as the five groups with the highest risk.<br />
At the other end of the scale were farmers (0.47,<br />
0.45 0.50), gardeners, forestry workers, teachers,<br />
fishermen <strong>and</strong> wood workers (Table 24).<br />
In women, the risk of primary liver <strong>cancer</strong> did<br />
not vary much across the different occupations<br />
(Table 25). Significantly elevated risks were seen<br />
5<br />
4<br />
3<br />
2<br />
1<br />
0<br />
<strong>Occupation</strong> <strong>and</strong> <strong>cancer</strong> in Nordic countries 681<br />
Women<br />
Denmark<br />
Finl<strong>and</strong><br />
Icel<strong>and</strong><br />
Norway<br />
Sweden<br />
1945 1960 1975 1990 2005<br />
Figure 22. Age st<strong>and</strong>ardised (World) incidence rates for liver <strong>cancer</strong> 1943 2005, by country <strong>and</strong> gender. Modified from NORDCAN [49].
Acta Oncol Downloaded from informahealthcare.com by 212.35.100.66 on 04/06/11<br />
For personal use only.<br />
682 E. Pukkala et al.<br />
Table 20. Observed number of colon <strong>cancer</strong> among men in the Nordic countries <strong>and</strong> st<strong>and</strong>ardised incidence ratios 1961 2005, by country<br />
<strong>and</strong> occupational category.<br />
Denmark Finl<strong>and</strong> Icel<strong>and</strong> Norway Sweden Total<br />
No <strong>Occupation</strong>al category Obs SIR Obs SIR Obs SIR Obs SIR Obs SIR Obs SIR 95% CI<br />
1 Technical workers, etc 1 514 1.10 855 1.21 12 0.92 956 1.02 4 518 1.08 7 855 1.09 1.06*1.11<br />
2 Laboratory assistants 23 0.85 14 0.82 2 0.81 59 1.29 13 0.75 111 1.01 0.84*1.22<br />
3 Physicians 139 1.20 57 1.40 6 1.11 139 1.11 202 1.08 543 1.14 1.05*1.24<br />
4 Dentists 38 1.16 8 0.93 2 1.56 63 1.12 106 1.11 217 1.12 0.98*1.28<br />
5 Nurses 1 0.67 2 0.96 [0.02] 0.00 5 1.10 10 1.30 18 1.14 0.67*1.80<br />
6 Assistant nurses 38 1.17 1 0.56 [0.57] 0.00 21 0.97 54 0.86 114 0.95 0.79*1.15<br />
7 ‘‘Other health workers’’ 85 0.86 36 0.91 2 1.39 44 0.93 171 1.07 338 0.97 0.88*1.08<br />
8 Teachers 597 0.99 297 1.00 22 1.13 685 1.00 1 094 1.03 2 695 1.01 0.97*1.05<br />
9 Religious workers etc 308 1.18 192 1.22 19 1.49 394 1.11 962 1.20 1 875 1.18 1.13*1.24<br />
10 Artistic workers 82 1.03 71 1.25 5 1.42 121 1.16 275 1.09 554 1.11 1.02*1.21<br />
11 Journalists 51 1.37 34 1.24 2 1.02 40 0.89 139 1.19 266 1.16 1.03*1.31<br />
12 Administrators 1 875 1.19 615 1.36 33 0.97 1 502 1.19 1 946 1.17 5 971 1.20 1.17*1.23<br />
13 Clerical workers 767 1.13 337 1.13 48 1.26 1 051 1.11 1 992 1.13 4 195 1.13 1.09*1.16<br />
14 Sales agents 450 1.27 495 1.17 21 1.09 1 268 1.16 2 805 1.10 5 039 1.14 1.11*1.17<br />
15 Shop workers 1 760 1.11 202 1.14 24 1.82 437 1.04 857 1.05 3 280 1.09 1.05*1.13<br />
16 Farmers 2 143 0.68 1 692 0.80 28 0.49 2439 0.77 3 724 0.80 10 026 0.76 0.75*0.78<br />
17 Gardeners 321 0.72 253 0.85 2 1.13 623 0.80 1 408 0.84 2 607 0.81 0.78*0.85<br />
18 Fishermen 154 1.09 22 0.80 32 1.06 892 0.91 171 0.95 1 271 0.94 0.89*0.99<br />
19 Forestry workers 43 0.66 206 0.60 [0.28] 0.00 452 0.79 942 0.77 1 643 0.75 0.71*0.78<br />
20 Miners <strong>and</strong> quarry workers 18 0.92 56 1.03 1 1.98 155 0.99 264 0.90 494 0.94 0.86*1.03<br />
21 Seamen 195 1.31 91 1.24 13 1.50 813 1.05 285 1.12 1 397 1.11 1.05*1.17<br />
22 Transport workers 346 1.02 262 1.19 14 0.78 451 1.08 888 1.01 1 961 1.04 1.00*1.09<br />
23 Drivers 1 139 1.06 766 1.11 27 1.07 1 280 1.15 2 217 1.07 5 429 1.09 1.06*1.12<br />
24 Postal workers 189 0.91 130 1.23 4 1.21 257 1.19 498 1.07 1 078 1.08 1.02*1.15<br />
25 Textile workers 178 0.90 99 1.39 6 1.03 259 1.05 586 1.09 1 128 1.07 1.01*1.13<br />
26 Shoe <strong>and</strong> leather workers 54 1.10 26 0.84 [1.25] 0.00 120 1.17 257 1.19 457 1.14 1.04*1.25<br />
27 Smelting workers 440 1.04 123 1.15 6 0.75 351 1.09 809 0.97 1 729 1.02 0.97*1.07<br />
28 Mechanics 1 180 1.02 716 1.05 10 0.42 1677 1.08 3 803 1.00 7 386 1.02 1.00*1.05<br />
29 Plumbers 117 1.15 108 0.96 3 0.75 189 1.07 496 1.13 913 1.09 1.03*1.17<br />
30 Welders 101 0.96 [1.44] 0.00 187 0.93 457 0.94 745 0.94 0.87*1.01<br />
31 Electrical workers 288 1.08 296 1.03 13 0.92 722 1.05 1 296 1.01 2 615 1.03 0.99*1.07<br />
32 Wood workers 740 0.91 661 0.89 9 0.63 1 731 0.93 2 337 0.88 5 478 0.90 0.88*0.93<br />
33 Painters 260 0.99 162 1.05 7 1.20 324 1.06 757 1.00 1 510 1.02 0.97*1.07<br />
34 ‘‘Other construction workers’’ 941 0.92 417 0.88 32 1.14 345 0.97 1 387 0.98 3 122 0.95 0.92*0.98<br />
35 Bricklayers 295 1.01 61 0.79 164 0.90 328 0.96 848 0.95 0.88*1.01<br />
36 Printers 232 1.28 77 1.13 4 0.87 215 1.19 430 1.08 958 1.15 1.08*1.23<br />
37 Chemical process workers 188 1.08 101 0.87 1 0.38 384 0.95 595 0.94 1 269 0.95 0.90*1.01<br />
38 Food workers 499 0.90 87 1.03 22 0.99 454 0.98 610 0.96 1 672 0.95 0.90*0.99<br />
39 Beverage workers 88 1.32 6 1.06 [0.37] 0.00 3 0.66 45 1.25 142 1.25 1.06*1.48<br />
40 Tobacco workers 16 1.40 1 0.99 [0.03] 0.00 10 1.45 2 0.72 29 1.31 0.88*1.88<br />
41 Glass makers etc 291 0.88 109 0.90 4 1.03 252 1.14 662 0.96 1 318 0.97 0.91*1.02<br />
42 Packers 304 1.03 269 1.07 10 0.77 811 1.18 1 294 1.03 2 688 1.07 1.03*1.11<br />
43 Engine operators 288 0.98 355 1.05 21 1.25 386 1.01 1 076 1.05 2 126 1.03 0.99*1.08<br />
44 Public safety workers 341 1.21 218 1.11 14 1.16 332 1.11 730 1.23 1 635 1.18 1.13*1.24<br />
45 Cooks <strong>and</strong> stewards 21 1.01 15 1.28 5 0.90 107 0.83 111 1.09 259 0.96 0.85*1.09<br />
46 Domestic assistants [0.23] 0.00 [0.88] 0.00 [0.02] 0.00 [1.05] 0.00 11 1.45 11 1.13 0.56*2.01<br />
47 Waiters 67 1.54 7 0.63 [0.58] 0.00 84 1.51 62 1.17 220 1.34 1.18*1.53<br />
48 Building caretakers 292 0.98 169 1.01 9 1.62 164 1.10 554 1.15 1 188 1.08 1.02*1.14<br />
49 Chimney sweeps 20 2.71 15 1.25 23 1.50 46 1.36 104 1.52 1.25*1.84<br />
50 Hairdressers 84 0.98 2 0.60 [0.82] 0.00 39 0.88 149 1.19 274 1.06 0.94*1.19<br />
51 Launderers 46 1.10 4 1.16 1 1.88 26 0.98 90 1.01 167 1.03 0.89*1.20<br />
52 Military personnel 166 1.20 70 1.11 265 1.05 401 1.13 902 1.12 1.05*1.19<br />
53 ‘‘Other workers’’ 920 1.04 182 0.93 56 1.12 1 252 0.95 1 408 0.92 3 818 0.96 0.93*0.99<br />
54 Economically inactive 995 1.13 1 007 0.98 38 1.13 561 0.87 2 167 0.97 4 768 0.99 0.96*1.02<br />
1 54 All categories 21 627 1.00 12 158 1.00 590 1.00 25 584 1.00 48 497 1.00 108 456 1.00 Ref.<br />
Obs observed number of cases; SIR st<strong>and</strong>ardised incidence ratio; 95% CI 95% confidence interval.
Acta Oncol Downloaded from informahealthcare.com by 212.35.100.66 on 04/06/11<br />
For personal use only.<br />
Table 21. Observed number of colon <strong>cancer</strong> among women in the Nordic countries <strong>and</strong> st<strong>and</strong>ardised incidence ratios 1961 2005, by<br />
country <strong>and</strong> occupational category.<br />
Denmark Finl<strong>and</strong> Icel<strong>and</strong> Norway Sweden Total<br />
No <strong>Occupation</strong>al category Obs SIR Obs SIR Obs SIR Obs SIR Obs SIR Obs SIR 95% CI<br />
1 Technical workers, etc 77 1.06 88 1.22 1 0.94 32 0.94 203 1.03 401 1.06 0.97*1.17<br />
2 Laboratory assistants 49 0.99 42 1.01 2 1.22 40 0.88 30 0.74 163 0.91 0.78*1.06<br />
3 Physicians 21 0.85 17 0.98 [0.36] 0.00 21 1.13 50 1.20 109 1.07 0.88*1.29<br />
4 Dentists 23 1.06 21 0.96 1 8.14 21 1.28 38 1.04 104 1.08 0.89*1.30<br />
5 Nurses 428 0.98 210 1.00 4 0.46 352 0.98 620 1.01 1 614 0.99 0.94*1.04<br />
6 Assistant nurses 302 1.00 219 0.97 13 1.05 379 1.04 995 0.97 1 908 0.99 0.94*1.03<br />
7 ‘‘Other health workers’’ 239 0.95 182 1.04 1 0.42 376 1.03 325 0.96 1 123 0.99 0.93*1.05<br />
8 Teachers 563 1.06 432 1.07 11 0.73 678 1.00 1 338 0.98 3 022 1.01 0.97*1.05<br />
9 Religious workers etc 68 0.93 185 1.05 5 2.13 186 1.09 393 0.95 837 1.00 0.93*1.07<br />
10 Artistic workers 33 0.82 35 1.11 3 1.58 44 0.82 80 0.94 195 0.92 0.80*1.06<br />
11 Journalists 15 1.88 17 0.82 [0.46] 0.00 10 0.74 32 0.82 74 0.91 0.71*1.14<br />
12 Administrators 262 1.11 62 0.91 [1.68] 0.00 190 1.08 236 1.19 750 1.11 1.03*1.19<br />
13 Clerical workers 2 297 1.06 1 424 1.11 57 1.21 2 398 1.06 3 709 1.10 9 885 1.08 1.06*1.10<br />
14 Sales agents 27 1.31 214 1.05 9 1.62 346 1.02 559 1.06 1 155 1.05 0.99*1.12<br />
15 Shop workers 1 556 1.01 770 1.06 32 1.00 2 057 1.04 2 456 1.06 6 871 1.04 1.01*1.06<br />
16 Farmers 942 0.87 424 0.82 14 0.55 1 286 0.90 174 0.82 2 840 0.87 0.84*0.90<br />
17 Gardeners 113 0.81 1 197 0.84 3 3.46 749 0.87 602 0.97 2 664 0.88 0.84*0.91<br />
18 Fishermen 8 1.48 5 1.68 1 1.31 3 0.30 2 1.00 19 0.90 0.54*1.41<br />
19 Forestry workers 3 2.14 2 0.35 [0.10] 0.00 15 0.96 12 0.95 32 0.90 0.62*1.27<br />
20 Miners <strong>and</strong> quarry workers [0.09] 0.00 1 0.39 [0.03] 0.00 [0.68] 0.00 1 0.35 2 0.32 0.04*1.17<br />
21 Seamen 1 1.70 [0.00] 0.00 1 0.44 [0.26] 0.00 2 0.64 0.08*2.32<br />
22 Transport workers [1.54] 0.00 46 1.23 1 1.07 13 1.32 35 1.02 95 1.13 0.92*1.38<br />
23 Drivers 34 0.91 18 1.14 [0.35] 0.00 34 0.90 74 0.95 160 0.94 0.81*1.10<br />
24 Postal workers 105 1.30 234 1.05 13 1.16 480 1.07 652 1.03 1 484 1.06 1.01*1.12<br />
25 Textile workers 516 1.02 548 1.07 15 0.67 872 1.15 1 523 1.06 3 474 1.08 1.04*1.11<br />
26 Shoe <strong>and</strong> leather workers 29 0.79 61 0.98 [1.17] 0.00 44 0.82 112 1.03 246 0.94 0.83*1.06<br />
27 Smelting workers 8 0.89 11 0.75 [0.05] 0.00 5 0.96 21 0.84 45 0.84 0.61*1.12<br />
28 Mechanics 96 1.12 57 0.90 [0.17] 0.00 63 1.00 260 1.00 476 1.01 0.92*1.11<br />
29 Plumbers [1.02] 0.00 [0.13] 0.00 1 2.41 [0.28] 0.00 1 0.54 0.01*3.02<br />
30 Welders 2 0.44 [0.01] 0.00 7 1.76 5 0.60 14 0.82 0.45*1.38<br />
31 Electrical workers 133 1.11 41 1.08 [0.17] 0.00 72 1.08 122 0.85 368 1.00 0.90*1.11<br />
32 Wood workers 49 1.21 103 0.79 [0.33] 0.00 19 0.87 35 0.84 206 0.88 0.77*1.01<br />
33 Painters 1 0.65 21 1.41 [0.09] 0.00 8 1.55 8 0.69 38 1.14 0.81*1.56<br />
34 ‘‘Other construction workers’’ 2 1.58 52 0.96 [0.05] 0.00 3 1.50 1 0.83 58 0.98 0.75*1.27<br />
35 Bricklayers [0.26] 0.00 [1.81] 0.00 [0.10] 0.00 [0.03] 0.00 [2.21] 0.00 0.00*1.67<br />
36 Printers 57 1.23 77 1.23 1 0.59 60 0.99 132 1.16 327 1.15 1.03*1.28<br />
37 Chemical process workers 80 1.08 38 1.15 3 3.73 73 1.32 98 1.06 292 1.14 1.02*1.28<br />
38 Food workers 350 0.96 170 0.97 43 1.02 370 1.01 285 0.98 1 218 0.98 0.93*1.04<br />
39 Beverage workers 36 1.05 4 0.40 [0.10] 0.00 5 1.61 21 1.12 66 0.99 0.77*1.27<br />
40 Tobacco workers 43 0.92 8 1.41 10 0.80 10 0.92 71 0.93 0.73*1.18<br />
41 Glass makers etc 91 1.06 122 1.02 [1.12] 0.00 121 1.02 286 1.17 620 1.09 1.01*1.18<br />
42 Packers 31 1.23 224 1.05 4 0.92 308 1.06 372 1.00 939 1.04 0.97*1.10<br />
43 Engine operators 1 1.66 28 0.84 [0.06] 0.00 4 1.16 13 0.69 46 0.82 0.60*1.09<br />
44 Public safety workers 3 0.99 7 0.89 [0.86] 0.00 43 1.15 26 1.06 79 1.07 0.85*1.34<br />
45 Cooks <strong>and</strong> stewards 2 2.01 261 1.08 28 1.66 467 1.11 502 0.87 1 260 1.00 0.95*1.06<br />
46 Domestic assistants 554 0.96 241 0.97 6 1.17 1 009 0.93 1 319 0.96 3 129 0.95 0.92*0.99<br />
47 Waiters 108 1.14 230 1.18 3 1.70 488 1.11 579 0.99 1 408 1.07 1.02*1.13<br />
48 Building caretakers 1 553 0.93 764 0.91 38 1.13 1 791 0.95 1 435 0.98 5 581 0.95 0.92*0.97<br />
49 Chimney sweeps [0.20] 0.00 1 2.62 [0.28] 0.00 [0.02] 0.00 1 1.13 0.03*6.30<br />
50 Hairdressers 95 0.97 86 1.16 [1.49] 0.00 126 1.15 243 1.08 550 1.08 1.00*1.18<br />
51 Launderers 193 1.02 55 0.80 2 0.35 149 0.89 324 1.02 723 0.97 0.90*1.04<br />
52 Military personnel [0.98] 0.00 2 3.46 1 2.22 [0.57] 0.00 3 1.17 0.24*3.41<br />
53 ‘‘Other workers’’ 472 1.00 244 0.96 31 0.96 916 0.96 693 1.08 2 356 1.00 0.96*1.04<br />
54 Economically inactive 13 154 1.00 6 086 1.01 115 1.00 12 539 0.99 31 314 0.99 63 208 0.99 0.99*1.00<br />
1 54 All categories 24 822 1.00 15 390 1.00 460 1.00 29 285 1.00 52 355 1.00 122 312 1.00 Ref.<br />
Obs observed number of cases; SIR st<strong>and</strong>ardised incidence ratio; 95% CI 95% confidence interval.<br />
<strong>Occupation</strong> <strong>and</strong> <strong>cancer</strong> in Nordic countries 683
Acta Oncol Downloaded from informahealthcare.com by 212.35.100.66 on 04/06/11<br />
For personal use only.<br />
684 E. Pukkala et al.<br />
Table 22. Observed number of rectal <strong>cancer</strong> among men in the Nordic countries <strong>and</strong> st<strong>and</strong>ardised incidence ratios 1961 2005, by country<br />
<strong>and</strong> occupational category.<br />
Denmark Finl<strong>and</strong> Icel<strong>and</strong> Norway Sweden Total<br />
No <strong>Occupation</strong>al category Obs SIR Obs SIR Obs SIR Obs SIR Obs SIR Obs SIR 95% CI<br />
1 Technical workers, etc 954 1.00 643 1.13 4 0.85 523 0.91 2 915 0.99 5 039 1.00 0.97*1.03<br />
2 Laboratory assistants 21 1.11 11 0.79 2 2.16 33 1.18 17 1.28 84 1.12 0.89*1.38<br />
3 Physicians 74 0.92 23 0.69 3 1.54 53 0.69 125 0.95 278 0.86 0.76*0.97<br />
4 Dentists 24 1.05 4 0.57 [0.43] 0.00 40 1.17 66 1.00 134 1.02 0.86*1.21<br />
5 Nurses [1.03] 0.00 3 1.83 [0.01] 0.00 1 0.34 5 0.83 9 0.77 0.35*1.46<br />
6 Assistant nurses 21 0.93 2 1.40 [0.21] 0.00 11 0.84 36 0.80 70 0.85 0.66*1.08<br />
7 ‘‘Other health workers’’ 70 1.01 47 1.45 1 1.87 25 0.86 96 0.86 239 0.99 0.87*1.12<br />
8 Teachers 358 0.86 223 0.92 7 0.99 371 0.88 646 0.86 1 605 0.87 0.83*0.92<br />
9 Religious workers etc 195 1.07 146 1.13 6 1.28 224 1.04 527 0.93 1 098 1.00 0.94*1.06<br />
10 Artistic workers 59 1.06 59 1.27 1 0.78 78 1.23 164 0.92 361 1.05 0.94*1.16<br />
11 Journalists 24 0.93 27 1.19 [0.71] 0.00 26 0.94 72 0.88 149 0.94 0.80*1.10<br />
12 Administrators 1 153 1.05 398 1.08 12 0.97 839 1.09 1 210 1.05 3 612 1.07 1.03*1.10<br />
13 Clerical workers 438 0.92 269 1.10 16 1.15 580 1.01 1 300 1.06 2 603 1.03 0.99*1.07<br />
14 Sales agents 252 1.02 379 1.09 6 0.84 752 1.13 1 996 1.13 3 385 1.11 1.08*1.15<br />
15 Shop workers 1 135 1.03 165 1.14 3 0.62 275 1.07 577 1.01 2 155 1.03 0.99*1.08<br />
16 Farmers 1 764 0.81 1 563 0.89 12 0.58 1 544 0.81 2 753 0.88 7 636 0.85 0.83*0.87<br />
17 Gardeners 275 0.89 204 0.84 [0.65] 0.00 427 0.91 1 129 0.98 2 035 0.94 0.90*0.98<br />
18 Fishermen 107 1.07 14 0.62 14 1.28 526 0.88 130 1.06 791 0.93 0.87*1.00<br />
19 Forestry workers 38 0.83 215 0.76 [0.10] 0.00 298 0.86 761 0.91 1 312 0.87 0.82*0.92<br />
20 Miners <strong>and</strong> quarry workers 13 0.94 46 1.03 [0.18] 0.00 77 0.80 170 0.84 306 0.86 0.76*0.96<br />
21 Seamen 114 1.09 67 1.11 [3.18] 0.00 517 1.09 187 1.06 885 1.08 1.01*1.15<br />
22 Transport workers 231 0.98 186 1.04 5 0.76 280 1.11 629 1.04 1 331 1.04 0.99*1.10<br />
23 Drivers 815 1.08 636 1.12 10 1.09 785 1.14 1 509 1.04 3 755 1.08 1.05*1.12<br />
24 Postal workers 126 0.87 89 1.03 [1.23] 0.00 151 1.14 321 0.99 687 1.00 0.93*1.08<br />
25 Textile workers 178 1.28 56 0.95 1 0.46 154 1.04 394 1.07 783 1.10 1.02*1.17<br />
26 Shoe <strong>and</strong> leather workers 39 1.13 25 0.97 2 4.27 74 1.19 159 1.09 299 1.11 0.99*1.24<br />
27 Smelting workers 309 1.03 86 0.97 2 0.67 213 1.08 575 1.00 1 185 1.02 0.96*1.08<br />
28 Mechanics 806 0.99 550 0.99 10 1.15 1 003 1.05 2 628 0.99 4 997 1.00 0.97*1.03<br />
29 Plumbers 93 1.30 101 1.09 [1.43] 0.00 130 1.19 329 1.07 653 1.12 1.04*1.21<br />
30 Welders 77 0.89 [0.53] 0.00 141 1.14 378 1.10 596 1.08 0.99*1.16<br />
31 Electrical workers 209 1.11 215 0.92 4 0.77 436 1.03 925 1.02 1 789 1.02 0.97*1.07<br />
32 Wood workers 561 0.99 603 0.99 6 1.14 1 096 0.97 1 722 0.95 3 988 0.97 0.94*1.00<br />
33 Painters 220 1.20 123 0.96 4 1.84 201 1.08 583 1.12 1 131 1.11 1.05*1.18<br />
34 ‘‘Other construction workers’’ 705 0.97 402 1.02 13 1.27 222 1.01 962 0.99 2 304 0.99 0.95*1.03<br />
35 Bricklayers 237 1.15 71 1.12 126 1.13 264 1.12 698 1.13 1.05*1.22<br />
36 Printers 129 1.01 63 1.11 1 0.58 133 1.19 315 1.13 641 1.11 1.03*1.20<br />
37 Chemical process workers 140 1.14 91 0.96 1 1.03 281 1.13 455 1.05 968 1.07 1.01*1.14<br />
38 Food workers 388 0.99 68 0.98 11 1.35 284 1.00 510 1.16 1 261 1.06 1.00*1.12<br />
39 Beverage workers 71 1.49 4 0.86 [0.13] 0.00 5 1.69 32 1.29 112 1.40 1.16*1.68<br />
40 Tobacco workers 6 0.74 1 1.19 [0.01] 0.00 2 0.47 3 1.55 12 0.79 0.41*1.38<br />
41 Glass makers etc 251 1.08 103 1.04 2 1.41 144 1.05 481 1.01 981 1.04 0.97*1.10<br />
42 Packers 216 1.03 241 1.15 7 1.47 501 1.18 953 1.10 1 918 1.12 1.07*1.17<br />
43 Engine operators 236 1.14 291 1.05 8 1.32 267 1.12 707 0.99 1 509 1.05 0.99*1.10<br />
44 Public safety workers 213 1.09 183 1.14 5 1.15 212 1.17 442 1.06 1 055 1.10 1.04*1.17<br />
45 Cooks <strong>and</strong> stewards 13 0.88 16 1.70 3 1.47 91 1.15 82 1.13 205 1.15 1.00*1.32<br />
46 Domestic assistants 1 6.14 2 2.92 [0.00] 0.00 2 3.09 3 0.53 8 1.12 0.48*2.21<br />
47 Waiters 51 1.62 6 0.67 [0.21] 0.00 57 1.66 45 1.19 159 1.41 1.21*1.65<br />
48 Building caretakers 220 1.05 138 1.00 5 2.41 93 1.00 330 0.99 786 1.01 0.94*1.09<br />
49 Chimney sweeps 5 0.97 12 1.19 10 1.06 24 1.01 51 1.05 0.78*1.38<br />
50 Hairdressers 64 1.07 2 0.70 [0.29] 0.00 24 0.89 110 1.28 200 1.13 0.99*1.30<br />
51 Launderers 29 0.99 2 0.69 [0.20] 0.00 16 0.98 51 0.83 98 0.89 0.72*1.08<br />
52 Military personnel 118 1.24 45 0.88 162 1.06 243 0.99 568 1.04 0.96*1.13<br />
53 ‘‘Other workers’’ 689 1.10 160 0.98 16 0.87 793 0.99 1 121 1.06 2 779 1.04 1.00*1.08<br />
54 Economically inactive 698 1.07 911 1.00 13 1.04 320 0.80 1 419 0.91 3 361 0.95 0.92*0.98<br />
1 54 All categories 15 156 1.00 10 067 1.00 216 1.00 15 629 1.00 33 586 1.00 74 654 1.00 Ref.<br />
Obs observed number of cases; SIR st<strong>and</strong>ardised incidence ratio; 95% CI 95% confidence interval.
Acta Oncol Downloaded from informahealthcare.com by 212.35.100.66 on 04/06/11<br />
For personal use only.<br />
Table 23. Observed number of rectal <strong>cancer</strong> among women in the Nordic countries <strong>and</strong> st<strong>and</strong>ardised incidence ratios 1961 2005, by<br />
country <strong>and</strong> occupational category.<br />
Denmark Finl<strong>and</strong> Icel<strong>and</strong> Norway Sweden Total<br />
No <strong>Occupation</strong>al category Obs SIR Obs SIR Obs SIR Obs SIR Obs SIR Obs SIR 95% CI<br />
1 Technical workers, etc 42 1.30 51 1.15 [0.48] 0.00 10 0.66 112 1.05 215 1.08 0.94*1.23<br />
2 Laboratory assistants 14 0.63 22 0.86 1 1.39 15 0.75 28 1.09 80 0.85 0.67*1.06<br />
3 Physicians 7 0.65 12 1.12 1 7.32 7 0.86 26 1.10 53 0.99 0.74*1.30<br />
4 Dentists 10 1.04 21 1.61 [0.05] 0.00 9 1.27 19 0.98 59 1.20 0.91*1.55<br />
5 Nurses 176 0.91 141 1.09 2 0.56 139 0.88 287 0.87 745 0.92 0.85*0.99<br />
6 Assistant nurses 121 0.90 128 0.93 3 0.59 145 0.91 576 1.02 973 0.97 0.91*1.04<br />
7 ‘‘Other health workers’’ 102 0.92 121 1.13 [1.02] 0.00 175 1.10 182 0.97 580 1.03 0.95*1.11<br />
8 Teachers 218 0.93 216 0.88 3 0.49 282 0.95 729 0.99 1 448 0.95 0.90*1.00<br />
9 Religious workers etc 32 0.99 109 0.99 1 1.06 65 0.87 216 0.93 423 0.94 0.85*1.03<br />
10 Artistic workers 18 1.03 16 0.83 [0.80] 0.00 19 0.82 50 1.07 103 0.96 0.79*1.17<br />
11 Journalists 4 1.12 10 0.79 1 5.12 5 0.84 20 0.94 40 0.92 0.65*1.25<br />
12 Administrators 106 1.02 39 0.93 [0.67] 0.00 71 0.93 110 1.03 326 0.99 0.89*1.10<br />
13 Clerical workers 1 028 1.07 898 1.15 20 1.01 1 093 1.12 1 871 1.03 4 910 1.08 1.05*1.11<br />
14 Sales agents 15 1.66 122 0.99 1 0.46 164 1.14 297 1.09 599 1.09 1.01*1.18<br />
15 Shop workers 718 1.06 453 1.03 16 1.24 899 1.06 1 259 1.06 3 345 1.05 1.02*1.09<br />
16 Farmers 417 0.88 279 0.92 10 1.03 469 0.78 100 0.92 1 275 0.85 0.81*0.90<br />
17 Gardeners 59 0.96 752 0.89 1 3.00 327 0.91 302 0.96 1 441 0.91 0.87*0.96<br />
18 Fishermen 2 0.84 2 1.13 [0.31] 0.00 3 0.71 [1.02] 0.00 7 0.72 0.29*1.48<br />
19 Forestry workers [0.62] 0.00 [3.42] 0.00 [0.04] 0.00 10 1.52 4 0.61 14 0.81 0.44*1.36<br />
20 Miners <strong>and</strong> quarry workers [0.04] 0.00 [1.53] 0.00 [0.01] 0.00 [0.31] 0.00 [1.52] 0.00 [3.41] 0.00 0.00*1.08<br />
21 Seamen [0.37] 0.00 [0.00] 0.00 1 1.03 [0.16] 0.00 1 0.66 0.02*3.70<br />
22 Transport workers 1 1.48 25 1.12 [0.36] 0.00 3 0.69 20 1.10 49 1.07 0.79*1.41<br />
23 Drivers 18 1.08 11 1.14 [0.15] 0.00 14 0.85 42 0.97 85 0.99 0.79*1.22<br />
24 Postal workers 28 0.78 147 1.10 6 1.34 185 0.96 335 1.01 701 1.00 0.93*1.08<br />
25 Textile workers 245 1.09 291 0.95 2 0.24 381 1.19 744 1.04 1 663 1.06 1.01*1.11<br />
26 Shoe <strong>and</strong> leather workers 19 1.16 28 0.74 [0.43] 0.00 31 1.36 63 1.16 141 1.07 0.91*1.26<br />
27 Smelting workers 4 1.00 8 0.90 [0.02] 0.00 2 0.86 6 0.44 20 0.70 0.43*1.08<br />
28 Mechanics 34 0.89 38 0.99 [0.08] 0.00 25 0.93 133 0.96 230 0.95 0.83*1.08<br />
29 Plumbers [0.44] 0.00 [0.08] 0.00 1 5.51 [0.17] 0.00 1 1.15 0.03*6.42<br />
30 Welders 3 1.05 [0.00] 0.00 4 2.24 7 1.45 14 1.48 0.81*2.48<br />
31 Electrical workers 62 1.16 17 0.72 [0.07] 0.00 35 1.22 81 1.06 195 1.07 0.93*1.23<br />
32 Wood workers 16 0.88 81 1.04 [0.13] 0.00 7 0.74 19 0.84 123 0.96 0.80*1.14<br />
33 Painters [0.69] 0.00 6 0.67 [0.04] 0.00 4 1.81 8 1.29 18 0.99 0.59*1.57<br />
34 ‘‘Other construction workers’’ 2 3.55 33 1.02 [0.02] 0.00 1 1.16 [0.70] 0.00 36 1.05 0.73*1.45<br />
35 Bricklayers [0.11] 0.00 1 0.94 [0.05] 0.00 1 49.94 2 1.61 0.20*5.82<br />
36 Printers 21 1.01 48 1.26 [0.68] 0.00 39 1.49 56 0.94 164 1.13 0.97*1.32<br />
37 Chemical process workers 38 1.15 24 1.20 [0.31] 0.00 22 0.93 49 1.02 133 1.06 0.90*1.26<br />
38 Food workers 161 1.00 108 1.03 15 0.91 133 0.85 181 1.23 598 1.02 0.94*1.11<br />
39 Beverage workers 12 0.78 1 0.17 [0.04] 0.00 [1.33] 0.00 6 0.64 19 0.59 0.36*0.92<br />
40 Tobacco workers 36 1.71 2 0.59 9 1.67 11 1.96 58 1.64 1.24*2.12<br />
41 Glass makers etc 43 1.12 79 1.09 [0.45] 0.00 49 0.96 119 0.94 290 1.00 0.90*1.13<br />
42 Packers 11 0.98 134 1.05 6 3.65 127 1.03 202 1.05 480 1.05 0.96*1.15<br />
43 Engine operators 2 7.15 19 0.94 [0.02] 0.00 [1.54] 0.00 7 0.65 28 0.85 0.57*1.23<br />
44 Public safety workers 3 2.20 3 0.63 [0.31] 0.00 13 0.84 23 1.64 42 1.17 0.84*1.58<br />
45 Cooks <strong>and</strong> stewards [0.44] 0.00 159 1.09 4 0.64 190 1.07 298 1.03 651 1.05 0.97*1.14<br />
46 Domestic assistants 238 0.93 154 1.03 3 1.62 440 0.96 732 1.01 1 567 0.99 0.94*1.04<br />
47 Waiters 45 1.06 139 1.18 1 1.46 203 1.09 311 1.05 699 1.09 1.01*1.17<br />
48 Building caretakers 710 0.96 495 0.98 17 1.36 809 1.01 760 1.01 2 791 0.99 0.96*1.03<br />
49 Chimney sweeps [0.08] 0.00 1 4.22 2 17.37 [0.01] 0.00 3 6.71 1.38*19.61<br />
50 Hairdressers 48 1.11 45 1.00 1 1.63 36 0.77 126 1.06 256 1.01 0.89*1.14<br />
51 Launderers 77 0.92 37 0.91 [2.06] 0.00 82 1.16 151 0.96 347 0.98 0.88*1.09<br />
52 Military personnel [0.43] 0.00 [0.38] 0.00 [0.20] 0.00 1 2.68 1 0.72 0.02*4.02<br />
53 ‘‘Other workers’’ 247 1.18 140 0.92 9 0.71 440 1.08 349 1.05 1 185 1.06 1.00*1.13<br />
54 Economically inactive 5 759 0.99 3 560 1.00 55 1.27 5 292 0.99 15 692 0.99 30 358 0.99 0.98*1.00<br />
1 54 All categories 10 969 1.00 9 229 1.00 179 1.00 12 487 1.00 26 721 1.00 59 585 1.00 Ref.<br />
Obs observed number of cases; SIR st<strong>and</strong>ardised incidence ratio; 95% CI 95% confidence interval.<br />
<strong>Occupation</strong> <strong>and</strong> <strong>cancer</strong> in Nordic countries 685
Acta Oncol Downloaded from informahealthcare.com by 212.35.100.66 on 04/06/11<br />
For personal use only.<br />
686 E. Pukkala et al.<br />
among smelter <strong>and</strong> metal foundry workers (2.11,<br />
1.09 3.68), tobacco manufacture workers, waitresses,<br />
building caretakers <strong>and</strong> cleaners. The lowest<br />
risks were observed among farmers (0.66, 0.57<br />
0.77), teachers <strong>and</strong> those working with religious,<br />
juridical <strong>and</strong> other humanistic work.<br />
Only 59 <strong>and</strong> 57 cases of hemangiosarcoma (http:<br />
//astra.<strong>cancer</strong>.fi/NOCCA/Incidence/liver-hemangio<br />
sarcoma) were diagnosed among men <strong>and</strong> women,<br />
respectively. There were no occupational categories<br />
with significantly elevated risk.<br />
Comment. The occurrence of liver <strong>cancer</strong> is causally<br />
related to the consumption of alcoholic beverages<br />
[67]. Exposure to other known hepatocarcinogens,<br />
Hepatitis B <strong>and</strong> C viruses <strong>and</strong> aflatoxins, is relatively<br />
low in the Nordic countries. High risks can therefore<br />
be expected in occupational categories which, on<br />
the basis of easy availability of alcohol or cultural<br />
traditions, have high alcohol consumption. On the<br />
other h<strong>and</strong>, possible direct occupational factors may<br />
be hidden behind the strong effect of alcohol. Thus,<br />
the risk pattern of men fits well with the image of<br />
high alcohol consumption in various occupations,<br />
whereas chemical factors might contribute to the<br />
highest SIRs in women.<br />
Hemangiosarcoma is associated with occupational<br />
exposure to vinylchloride arsenic, <strong>and</strong> thorotrast, an<br />
X-ray contrast medium used before 1960 [68].<br />
Because of the rarity of both the exposures <strong>and</strong> the<br />
disease, it was not possible see any association<br />
between these factors.<br />
Cancer of the gallbladder <strong>and</strong> biliary tract<br />
The incidence of gallbladder <strong>cancer</strong> was highest in<br />
Denmark around 1975 <strong>and</strong> in Sweden <strong>and</strong> Finl<strong>and</strong><br />
around 1985, while the incidence continues to<br />
/ 100 000<br />
5<br />
4<br />
3<br />
2<br />
1<br />
Denmark<br />
Finl<strong>and</strong><br />
Icel<strong>and</strong><br />
Norway<br />
Sweden<br />
Men<br />
0<br />
1945 1960 1975 1990 2005<br />
/ 100 000<br />
increase in Icel<strong>and</strong> <strong>and</strong> Norway (Figure 23). The<br />
<strong>cancer</strong> has been more frequent in women than in men.<br />
For men, the high risk groups were cooks <strong>and</strong><br />
stewards (SIR 1.56, 95% CI 1.03 2.27), ‘‘other<br />
workers’’ <strong>and</strong> drivers (Table 26). The low risk<br />
groups were farmers (0.75, 0.70 0.80), forestry<br />
workers, gardeners <strong>and</strong> woodworkers. Two groups<br />
of women had a statistically significant but not very<br />
high excess risk of gallbladder <strong>cancer</strong>, these being<br />
building caretakers (1.13, 1.06 1.21) <strong>and</strong> economically<br />
inactive women (mainly housewives). A number<br />
of occupational categories of women had deficit risks<br />
of gallbladder <strong>cancer</strong>. The lowest SIRs were found in<br />
dentists (0.39, 0.14 0.85), nurses, assistant nurses,<br />
<strong>and</strong> teachers (Table 27).<br />
Comment. The presence of gallstones a relatively<br />
common condition, in particular among women aged<br />
50 or more years is associated with a risk of<br />
developing <strong>cancer</strong> of the gallbladder [69]. We have<br />
no information on the prevalence of gallstones over<br />
occupational categories. Body fatness is associated<br />
with increased risk, while no dietary factors have so<br />
far been conclusively linked with risk [70]. Smoking<br />
[71], <strong>and</strong> alcohol consumption [70] do not seem to be<br />
causally linked with the development of gallbladder<br />
<strong>cancer</strong>. The overall impact of occupational exposures<br />
on gallbladder <strong>cancer</strong> is probably very small [69],<br />
although some previous studies found inconsistent<br />
associations with chemical workers, painters, pesticide<br />
manufacturers, vinyl chloride workers, munition<br />
workers exposed to dinitrotoluene, textile workers,<br />
cellulose triacetate fiber manufacturing, workers in<br />
petroleum refining, paper mills, chemical processing,<br />
shoemaking <strong>and</strong> repairing, asbestos related occupations,<br />
<strong>and</strong> exposure to solvents such as methylene<br />
chloride <strong>and</strong> trichlorinated hydrocarbons. Findings<br />
5<br />
4<br />
3<br />
2<br />
1<br />
Denmark<br />
Finl<strong>and</strong><br />
Icel<strong>and</strong><br />
Norway<br />
Sweden<br />
Women<br />
0<br />
1945 1960 1975 1990 2005<br />
Figure 23. Age st<strong>and</strong>ardised (World) incidence rates for <strong>cancer</strong> of the gallbladder 1943 2005, by country <strong>and</strong> gender. Modified from<br />
NORDCAN [49].
Acta Oncol Downloaded from informahealthcare.com by 212.35.100.66 on 04/06/11<br />
For personal use only.<br />
Table 24. Observed number of liver <strong>cancer</strong> among men in the Nordic countries <strong>and</strong> st<strong>and</strong>ardised incidence ratios 1961 2005, by country<br />
<strong>and</strong> occupational category.<br />
Denmark Finl<strong>and</strong> Icel<strong>and</strong> Norway Sweden Total<br />
No <strong>Occupation</strong>al category Obs SIR Obs SIR Obs SIR Obs SIR Obs SIR Obs SIR 95% CI<br />
1 Technical workers, etc 180 0.89 182 0.93 1 0.72 52 0.78 641 0.86 1 056 0.87 0.82*0.93<br />
2 Laboratory assistants 8 1.96 7 1.48 [0.26] 0.00 1 0.30 [2.85] 0.00 16 1.05 0.60*1.70<br />
3 Physicians 13 0.79 15 1.32 2 3.37 12 1.28 22 0.66 64 0.90 0.70*1.15<br />
4 Dentists 8 1.68 1 0.41 [0.13] 0.00 3 0.72 16 0.94 28 0.98 0.65*1.42<br />
5 Nurses 2 9.17 [0.49] 0.00 [0.00] 0.00 [0.31] 0.00 [1.40] 0.00 2 0.83 0.10*2.99<br />
6 Assistant nurses 3 0.62 [0.40] 0.00 [0.06] 0.00 1 0.61 14 1.21 18 0.98 0.58*1.54<br />
7 ‘‘Other health workers’’ 15 1.03 12 1.05 [0.17] 0.00 7 1.96 25 0.87 59 1.01 0.77*1.30<br />
8 Teachers 55 0.63 72 0.86 4 1.89 26 0.52 126 0.67 283 0.69 0.61*0.78<br />
9 Religious workers etc 22 0.59 41 0.94 1 0.69 16 0.61 163 1.13 243 0.96 0.85*1.09<br />
10 Artistic workers 15 1.28 22 1.37 2 5.07 10 1.29 65 1.45 114 1.41 1.17*1.69<br />
11 Journalists 13 2.36 15 1.90 [0.22] 0.00 5 1.51 41 1.95 74 1.95 1.53*2.45<br />
12 Administrators 261 1.14 147 1.13 1 0.25 114 1.20 351 1.15 874 1.15 1.07*1.23<br />
13 Clerical workers 110 1.09 90 1.03 6 1.33 55 0.78 332 1.04 593 1.02 0.94*1.10<br />
14 Sales agents 72 1.36 170 1.39 4 1.78 113 1.35 628 1.37 987 1.37 1.29*1.46<br />
15 Shop workers 268 1.15 59 1.19 [1.53] 0.00 29 0.94 175 1.20 531 1.16 1.06*1.26<br />
16 Farmers 152 0.35 376 0.57 4 0.59 122 0.49 411 0.46 1 065 0.47 0.45*0.50<br />
17 Gardeners 38 0.60 69 0.79 [0.22] 0.00 33 0.55 205 0.65 345 0.66 0.59*0.73<br />
18 Fishermen 19 0.88 4 0.48 2 0.62 68 0.89 18 0.53 111 0.78 0.64*0.93<br />
19 Forestry workers 1 0.11 73 0.72 [0.03] 0.00 19 0.42 172 0.76 265 0.69 0.61*0.78<br />
20 Miners <strong>and</strong> quarry workers 1 0.34 23 1.44 [0.05] 0.00 13 1.08 63 1.16 100 1.17 0.96*1.43<br />
21 Seamen 48 2.07 24 1.13 1 1.03 122 2.10 75 1.61 270 1.80 1.60*2.03<br />
22 Transport workers 58 1.14 63 0.97 2 0.95 32 1.02 157 1.00 312 1.02 0.91*1.14<br />
23 Drivers 213 1.29 230 1.16 4 1.42 108 1.28 451 1.21 1 006 1.22 1.15*1.30<br />
24 Postal workers 21 0.67 33 1.07 1 2.41 21 1.27 92 1.08 168 1.02 0.88*1.19<br />
25 Textile workers 22 0.75 23 1.07 3 4.17 20 1.06 98 0.98 166 0.97 0.84*1.14<br />
26 Shoe <strong>and</strong> leather workers 6 0.82 11 1.17 [0.16] 0.00 6 0.74 49 1.18 72 1.08 0.85*1.36<br />
27 Smelting workers 70 1.07 21 0.66 2 2.14 25 1.01 159 1.03 277 1.00 0.89*1.12<br />
28 Mechanics 182 1.04 191 0.98 3 1.14 126 1.08 670 0.98 1 172 1.00 0.94*1.06<br />
29 Plumbers 24 1.53 43 1.34 1 2.22 20 1.52 104 1.32 192 1.37 1.19*1.58<br />
30 Welders 32 1.11 [0.15] 0.00 10 0.69 78 0.92 120 0.93 0.78*1.11<br />
31 Electrical workers 35 0.85 80 0.99 1 0.65 53 1.04 243 1.06 412 1.02 0.93*1.13<br />
32 Wood workers 113 0.94 232 1.04 2 1.21 93 0.66 357 0.72 797 0.81 0.76*0.87<br />
33 Painters 45 1.13 61 1.34 1 1.50 24 1.01 126 0.91 257 1.03 0.91*1.17<br />
34 ‘‘Other construction workers’’ 130 0.84 145 1.02 3 0.95 24 0.88 287 1.09 589 1.00 0.92*1.08<br />
35 Bricklayers 52 1.19 29 1.25 24 1.70 61 0.96 166 1.15 0.99*1.34<br />
36 Printers 42 1.52 27 1.40 1 1.98 27 1.97 87 1.22 184 1.39 1.20*1.60<br />
37 Chemical process workers 21 0.80 30 0.89 [0.30] 0.00 32 1.00 112 0.94 195 0.93 0.80*1.07<br />
38 Food workers 62 0.74 18 0.73 2 0.73 39 1.09 139 1.19 260 0.99 0.87*1.11<br />
39 Beverage workers 31 2.91 1 0.59 [0.04] 0.00 [0.31] 0.00 17 2.47 49 2.50 1.85*3.31<br />
40 Tobacco workers 2 1.17 1 3.45 [0.00] 0.00 1 1.79 2 4.02 6 1.96 0.72*4.27<br />
41 Glass makers etc 49 0.98 28 0.80 [0.45] 0.00 24 1.43 113 0.89 214 0.93 0.82*1.07<br />
42 Packers 50 1.12 93 1.24 2 1.27 78 1.44 288 1.22 511 1.24 1.14*1.36<br />
43 Engine operators 52 1.18 106 1.10 1 0.53 28 0.98 216 1.16 403 1.13 1.02*1.25<br />
44 Public safety workers 46 1.14 66 1.15 1 0.71 29 1.27 114 1.07 256 1.12 0.99*1.27<br />
45 Cooks <strong>and</strong> stewards 10 3.03 6 1.89 [0.61] 0.00 20 2.09 55 2.99 91 2.60 2.09*3.19<br />
46 Domestic assistants [0.04] 0.00 [0.25] 0.00 [0.00] 0.00 [0.07] 0.00 4 2.84 4 2.26 0.62*5.78<br />
47 Waiters 33 4.54 9 3.01 [0.06] 0.00 22 5.19 37 3.94 101 4.22 3.47*5.13<br />
48 Building caretakers 44 0.98 52 1.04 [0.71] 0.00 16 1.37 97 1.06 209 1.05 0.92*1.20<br />
49 Chimney sweeps 1 0.87 5 1.38 1 0.84 12 1.96 19 1.57 0.94*2.45<br />
50 Hairdressers 13 1.04 1 0.98 [0.08] 0.00 9 2.61 34 1.49 57 1.43 1.08*1.85<br />
51 Launderers 5 0.82 3 2.95 [0.07] 0.00 5 2.42 16 0.98 29 1.13 0.76*1.63<br />
52 Military personnel 22 1.08 11 0.65 15 0.83 57 0.92 105 0.90 0.74*1.08<br />
53 ‘‘Other workers’’ 228 1.65 78 1.33 3 0.51 119 1.14 315 1.09 743 1.25 1.16*1.34<br />
54 Economically inactive 220 1.52 482 1.43 7 1.75 79 1.53 702 1.64 1 490 1.54 1.46*1.62<br />
1 54 All categories 3 206 1.00 3 613 1.00 68 1.00 1 951 1.00 8 892 1.00 17 730 1.00 Ref.<br />
Obs observed number of cases; SIR st<strong>and</strong>ardised incidence ratio; 95% CI 95% confidence interval.<br />
<strong>Occupation</strong> <strong>and</strong> <strong>cancer</strong> in Nordic countries 687
Acta Oncol Downloaded from informahealthcare.com by 212.35.100.66 on 04/06/11<br />
For personal use only.<br />
688 E. Pukkala et al.<br />
Table 25. Observed number of liver <strong>cancer</strong> among women in the Nordic countries <strong>and</strong> st<strong>and</strong>ardised incidence ratios 1961 2005, by<br />
country <strong>and</strong> occupational category.<br />
Denmark Finl<strong>and</strong> Icel<strong>and</strong> Norway Sweden Total<br />
No <strong>Occupation</strong>al category Obs SIR Obs SIR Obs SIR Obs SIR Obs SIR Obs SIR 95% CI<br />
1 Technical workers, etc 6 1.07 5 0.50 1 16.52 2 1.58 14 0.72 28 0.77 0.51*1.11<br />
2 Laboratory assistants 2 0.52 9 1.52 [0.10] 0.00 [1.75] 0.00 4 0.99 15 0.96 0.54*1.58<br />
3 Physicians [1.85] 0.00 2 0.85 1 37.51 [0.71] 0.00 3 0.74 6 0.67 0.24*1.45<br />
4 Dentists 4 2.41 2 0.59 [0.01] 0.00 [0.65] 0.00 3 0.83 9 0.97 044*1.83<br />
5 Nurses 29 0.88 20 0.67 1 1.67 10 0.75 66 1.09 126 0.92 0.77*1.09<br />
6 Assistant nurses 31 1.32 38 1.12 [0.85] 0.00 10 0.73 84 0.83 163 0.94 0.81*1.10<br />
7 ‘‘Other health workers’’ 22 1.17 27 1.05 [0.16] 0.00 19 1.35 23 0.69 91 0.99 0.79*1.21<br />
8 Teachers 31 0.78 50 0.83 [0.99] 0.00 16 0.62 99 0.72 196 0.74 0.65*0.85<br />
9 Religious workers etc 2 0.36 19 0.81 [0.16] 0.00 10 1.53 28 0.68 59 0.77 0.58*0.99<br />
10 Artistic workers 4 1.34 3 0.66 [0.14] 0.00 3 1.43 12 1.42 22 1.21 0.76*1.83<br />
11 Journalists [0.63] 0.00 2 0.66 [0.03] 0.00 [0.51] 0.00 3 0.78 5 0.62 0.20*1.45<br />
12 Administrators 19 1.06 6 0.60 1 7.81 5 0.72 13 0.65 44 0.80 0.58*1.07<br />
13 Clerical workers 145 0.87 178 0.95 2 0.62 75 0.86 334 1.00 734 0.94 0.88*1.01<br />
14 Sales agents [1.55] 0.00 30 0.93 3 7.37 14 1.00 47 0.86 94 0.92 0.74*1.12<br />
15 Shop workers 114 0.97 111 0.99 2 0.89 70 0.89 257 1.11 554 1.02 0.94*1.11<br />
16 Farmers 50 0.62 58 0.66 1 0.54 45 0.76 13 0.57 167 0.66 0.57*0.77<br />
17 Gardeners 9 0.85 194 0.82 [0.06] 0.00 25 0.71 56 0.90 284 0.83 0.74*0.93<br />
18 Fishermen 1 2.44 [0.48] 0.00 [0.05] 0.00 1 2.59 [0.20] 0.00 2 1.31 0.16*4.74<br />
19 Forestry workers [0.11] 0.00 [0.89] 0.00 [0.01] 0.00 [0.61] 0.00 2 1.59 2 0.70 0.08*2.51<br />
20 Miners <strong>and</strong> quarry workers [0.01] 0.00 [0.42] 0.00 [0.00] 0.00 [0.03] 0.00 [0.28] 0.00 [0.73] 0.00 0.00*5.03<br />
21 Seamen [0.08] 0.00 [0.09] 0.00 [0.03] 0.00 [0.19] 0.00 0.00*19.22<br />
22 Transport workers [0.12] 0.00 7 1.14 [0.07] 0.00 [0.38] 0.00 6 1.77 13 1.29 0.69*2.21<br />
23 Drivers 5 1.70 1 0.43 [0.02] 0.00 [1.47] 0.00 9 1.17 15 1.04 0.58*1.71<br />
24 Postal workers 8 1.28 40 1.14 2 2.47 17 0.95 68 1.09 135 1.10 0.93*1.30<br />
25 Textile workers 51 1.28 85 1.04 1 0.61 27 0.86 150 1.03 314 1.05 0.94*1.17<br />
26 Shoe <strong>and</strong> leather workers 1 0.34 11 1.11 [0.08] 0.00 3 1.35 16 1.46 31 1.19 0.81*1.69<br />
27 Smelting workers 2 2.77 4 1.70 [0.00] 0.00 [0.19] 0.00 6 2.48 12 2.11 1.09*3.68<br />
28 Mechanics 5 0.73 10 1.02 [0.01] 0.00 3 1.20 33 1.29 51 1.14 0.85*1.50<br />
29 Plumbers [0.07] 0.00 [0.02] 0.00 [0.02] 0.00 [0.03] 0.00 [0.13] 0.00 0.00*28.50<br />
30 Welders 3 4.52 [0.00] 0.00 [0.14] 0.00 1 1.23 4 2.46 0.67*6.30<br />
31 Electrical workers 5 0.52 9 1.67 [0.01] 0.00 4 1.53 17 1.21 35 1.10 0.77*1.53<br />
32 Wood workers 1 0.31 16 0.76 [0.02] 0.00 1 1.20 3 0.73 21 0.72 0.44*1.10<br />
33 Painters [0.13] 0.00 5 2.12 [0.01] 0.00 [0.20] 0.00 [1.15] 0.00 5 1.30 0.42*3.04<br />
34 ‘‘Other construction workers’’ [0.10] 0.00 13 1.43 [0.00] 0.00 [0.08] 0.00 [0.12] 0.00 13 1.38 0.74*2.36<br />
35 Bricklayers [0.02] 0.00 [0.28] 0.00 [0.00] 0.00 [0.00] 0.00 [0.30] 0.00 0.00*12.10<br />
36 Printers 6 1.62 11 1.12 [0.13] 0.00 2 0.81 19 1.67 38 1.38 0.98*1.90<br />
37 Chemical process workers 4 0.67 7 1.32 [0.06] 0.00 5 2.24 7 0.75 23 1.01 0.64*1.51<br />
38 Food workers 24 0.84 25 0.89 7 2.30 17 1.13 32 1.07 105 1.00 0.83*1.22<br />
39 Beverage workers 4 1.41 1 0.61 [0.01] 0.00 [0.12] 0.00 4 2.05 9 1.37 0.63*2.60<br />
40 Tobacco workers 8 2.07 1 1.08 1 1.87 3 2.82 13 2.04 1.08*3.48<br />
41 Glass makers etc 9 1.30 28 1.48 [0.08] 0.00 6 1.26 26 1.07 69 1.25 0.98*1.59<br />
42 Packers 2 1.00 33 0.98 [0.32] 0.00 8 0.69 49 1.31 92 1.08 0.87*1.33<br />
43 Engine operators [0.05] 0.00 7 1.35 [0.00] 0.00 [0.12] 0.00 3 1.66 10 1.39 0.67*2.56<br />
44 Public safety workers [0.26] 0.00 [1.21] 0.00 [0.06] 0.00 1 0.67 1 0.41 2 0.37 0.04*1.33<br />
45 Cooks <strong>and</strong> stewards [0.08] 0.00 46 1.19 [1.25] 0.00 15 0.86 65 1.08 126 1.07 0.90*1.27<br />
46 Domestic assistants 38 0.85 38 0.99 [0.39] 0.00 38 0.86 111 0.78 225 0.83 0.73*0.95<br />
47 Waiters 14 1.80 34 1.14 [0.13] 0.00 26 1.48 81 1.38 155 1.36 1.16*1.59<br />
48 Building caretakers 147 1.12 174 1.27 [2.46] 0.00 92 1.23 187 1.25 600 1.21 1.12*1.31<br />
49 Chimney sweeps [0.01] 0.00 [0.06] 0.00 [0.01] 0.00 [0.00] 0.00 [0.08] 0.00 0.00*43.69<br />
50 Hairdressers 9 1.21 15 1.31 [0.09] 0.00 8 1.83 20 0.91 52 1.15 0.86*1.50<br />
51 Launderers 26 1.76 17 1.49 [0.44] 0.00 8 1.16 33 1.01 84 1.27 1.01*1.57<br />
52 Military personnel 1 13.01 [0.07] 0.00 [0.02] 0.00 [0.06] 0.00 1 4.58 0.12*25.52<br />
53 ‘‘Other workers’’ 36 0.97 41 1.02 2 0.85 33 0.87 67 1.03 179 0.98 0.85*1.14<br />
54 Economically inactive 1 046 1.03 1 050 1.03 9 1.07 580 1.08 3 257 1.00 5 942 1.02 0.99*1.04<br />
1 54 All categories 1 921 1.00 2 486 1.00 33 1.00 1 200 1.00 5 335 1.00 10 975 1.00 Ref.<br />
Obs observed number of cases; SIR st<strong>and</strong>ardised incidence ratio; 95% CI 95% confidence interval.
Acta Oncol Downloaded from informahealthcare.com by 212.35.100.66 on 04/06/11<br />
For personal use only.<br />
Table 26. Observed number of <strong>cancer</strong> of the gallbladder among men in the Nordic countries <strong>and</strong> st<strong>and</strong>ardised incidence ratios 1961 2005,<br />
by country <strong>and</strong> occupational category.<br />
Denmark Finl<strong>and</strong> Icel<strong>and</strong> Norway Sweden Total<br />
No <strong>Occupation</strong>al category Obs SIR Obs SIR Obs SIR Obs SIR Obs SIR Obs SIR 95% CI<br />
1 Technical workers, etc 103 0.99 90 0.87 [0.79] 0.00 35 0.71 281 1.06 509 0.98 0.89*1.06<br />
2 Laboratory assistants 2 0.95 2 0.82 [0.14] 0.00 1 0.41 1 1.27 6 0.75 0.28*1.64<br />
3 Physicians 10 1.13 6 1.01 1 3.06 11 1.56 8 0.69 36 1.07 0.75*1.47<br />
4 Dentists 1 0.41 1 0.76 [0.09] 0.00 2 0.64 6 0.97 10 0.76 0.36*1.40<br />
5 Nurses [0.11] 0.00 [0.27] 0.00 [0.00] 0.00 [0.23] 0.00 1 3.50 1 1.12 0.03*6.23<br />
6 Assistant nurses 1 0.41 [0.22] 0.00 [0.03] 0.00 3 2.46 6 1.48 10 1.26 0.60*2.31<br />
7 ‘‘Other health workers’’ 13 1.67 3 0.50 [0.08] 0.00 2 0.75 10 0.96 28 1.04 0.69*1.50<br />
8 Teachers 38 0.84 45 1.03 1 0.86 31 0.83 68 1.04 183 0.95 0.82*1.10<br />
9 Religious workers etc 26 1.26 27 1.16 [0.77] 0.00 21 1.06 44 0.87 118 1.03 0.86*1.23<br />
10 Artistic workers 9 1.40 8 0.94 [0.20] 0.00 4 0.70 16 1.00 37 1.00 0.71*1.38<br />
11 Journalists 2 0.69 5 1.20 [0.12] 0.00 [2.46] 0.00 11 1.45 18 1.04 0.62*1.65<br />
12 Administrators 103 0.84 69 0.98 2 0.97 74 1.05 127 1.09 375 0.98 0.89*1.09<br />
13 Clerical workers 45 0.83 43 0.91 2 0.89 51 0.99 138 1.15 279 1.02 0.90*1.14<br />
14 Sales agents 30 1.07 58 0.90 [1.16] 0.00 76 1.23 184 1.08 348 1.07 0.96*1.18<br />
15 Shop workers 140 1.10 30 1.16 [0.77] 0.00 19 0.84 50 0.95 239 1.04 0.92*1.18<br />
16 Farmers 185 0.74 322 0.89 6 1.78 119 0.64 244 0.66 876 0.75 0.70*0.80<br />
17 Gardeners 29 0.81 50 1.07 [0.10] 0.00 34 0.77 99 0.79 212 0.84 0.74*0.96<br />
18 Fishermen 10 0.87 5 1.08 3 1.65 65 1.16 10 0.73 93 1.06 0.86*1.30<br />
19 Forestry workers 6 1.12 45 0.84 [0.02] 0.00 26 0.78 72 0.79 149 0.81 0.69*0.96<br />
20 Miners <strong>and</strong> quarry workers 2 1.20 11 1.30 [0.03] 0.00 13 1.49 15 0.71 41 1.02 0.73*1.39<br />
21 Seamen 13 1.09 13 1.14 2 3.81 57 1.35 15 0.85 100 1.19 0.98*1.45<br />
22 Transport workers 30 1.15 30 0.86 1 0.93 19 0.84 50 0.88 130 0.92 0.77*1.09<br />
23 Drivers 97 1.11 114 1.10 1 0.67 81 1.32 149 1.09 442 1.13 1.03*1.24<br />
24 Postal workers 8 0.51 16 0.98 [0.20] 0.00 7 0.57 39 1.21 70 0.91 0.71*1.15<br />
25 Textile workers 18 1.10 11 0.96 [0.33] 0.00 11 0.79 48 1.21 88 1.08 0.86*1.33<br />
26 Shoe <strong>and</strong> leather workers 6 1.44 3 0.59 [0.07] 0.00 8 1.33 21 1.22 38 1.17 0.82*1.60<br />
27 Smelting workers 42 1.21 23 1.35 [0.46] 0.00 24 1.33 58 0.96 147 1.12 0.96*1.32<br />
28 Mechanics 102 1.09 102 0.99 [1.44] 0.00 92 1.09 261 1.05 557 1.05 0.96*1.14<br />
29 Plumbers 10 1.21 15 0.90 [0.23] 0.00 11 1.15 27 0.93 63 0.99 0.76*1.27<br />
30 Welders 17 1.14 [0.08] 0.00 12 1.15 39 1.32 68 1.24 0.96*1.57<br />
31 Electrical workers 24 1.13 40 0.95 [0.84] 0.00 34 0.91 88 1.08 186 1.02 0.88*1.17<br />
32 Wood workers 45 0.69 117 0.97 1 1.17 96 0.92 154 0.79 413 0.85 0.77*0.93<br />
33 Painters 21 1.00 28 1.16 2 5.60 15 0.86 60 1.12 126 1.08 0.91*1.28<br />
34 ‘‘Other construction workers’’ 82 0.94 76 1.00 1 0.60 20 1.01 82 0.78 261 0.90 0.80*1.02<br />
35 Bricklayers 33 1.37 14 1.12 15 1.46 25 0.99 87 1.21 0.97*1.49<br />
36 Printers 12 0.82 9 0.89 [0.29] 0.00 11 1.09 33 1.25 65 1.06 0.81*1.35<br />
37 Chemical process workers 18 1.24 22 1.25 [0.15] 0.00 26 1.11 55 1.16 121 1.18 0.98*1.41<br />
38 Food workers 53 1.17 8 0.62 2 1.58 31 1.18 40 0.89 134 1.02 0.86*1.21<br />
39 Beverage workers 7 1.21 1 1.10 [0.02] 0.00 [0.23] 0.00 [2.82] 0.00 8 0.82 0.35*1.61<br />
40 Tobacco workers 1 1.01 [0.15] 0.00 [0.00] 0.00 [0.40] 0.00 [0.18] 0.00 1 0.58 0.01*3.21<br />
41 Glass makers etc 25 0.92 21 1.13 1 4.49 16 1.31 42 0.85 105 0.98 0.81*1.18<br />
42 Packers 31 1.23 43 1.08 4 5.44 39 0.99 104 1.10 221 1.11 0.97*1.26<br />
43 Engine operators 25 1.06 55 1.09 [1.01] 0.00 21 1.01 74 1.06 175 1.06 0.91*1.23<br />
44 Public safety workers 25 1.13 31 1.02 1 1.38 16 0.96 55 1.42 128 1.18 0.99*1.40<br />
45 Cooks <strong>and</strong> stewards 1 0.57 3 1.73 [0.34] 0.00 10 1.42 13 2.00 27 1.56 1.03*2.27<br />
46 Domestic assistants [0.02] 0.00 [0.16] 0.00 [0.00] 0.00 1 17.42 1 2.50 2 3.12 0.38*11.28<br />
47 Waiters 5 1.27 4 2.50 [0.04] 0.00 2 0.65 3 0.91 14 1.17 0.64*1.96<br />
48 Building caretakers 25 1.01 26 0.96 [0.33] 0.00 12 1.39 40 1.09 103 1.06 0.87*1.28<br />
49 Chimney sweeps [0.60] 0.00 1 0.52 [0.86] 0.00 1 0.44 2 0.36 0.04*1.28<br />
50 Hairdressers 10 1.41 [0.53] 0.00 [0.05] 0.00 4 1.58 12 1.36 26 1.37 0.89*2.01<br />
51 Launderers 1 0.29 2 3.70 [0.03] 0.00 5 3.31 11 1.76 19 1.62 0.97*2.53<br />
52 Military personnel 12 1.21 6 0.69 12 0.92 19 0.88 49 0.92 0.68*1.22<br />
53 ‘‘Other workers’’ 89 1.18 22 0.70 4 1.35 94 1.22 140 1.21 349 1.16 1.04*1.28<br />
54 Economically inactive 127 1.37 242 1.30 [1.94] 0.00 52 1.32 247 1.39 668 1.34 1.24*1.45<br />
1 54 All categories 1 753 1.00 1 935 1.00 35 1.00 1 441 1.00 3 397 1.00 8 561 1.00 Ref.<br />
Obs observed number of cases; SIR st<strong>and</strong>ardised incidence ratio; 95% CI 95% confidence interval.<br />
<strong>Occupation</strong> <strong>and</strong> <strong>cancer</strong> in Nordic countries 689
Acta Oncol Downloaded from informahealthcare.com by 212.35.100.66 on 04/06/11<br />
For personal use only.<br />
690 E. Pukkala et al.<br />
Table 27. Observed number of <strong>cancer</strong> of the gallbladder among women in the Nordic countries <strong>and</strong> st<strong>and</strong>ardised incidence ratios 1961<br />
2005, by country <strong>and</strong> occupational category.<br />
Denmark Finl<strong>and</strong> Icel<strong>and</strong> Norway Sweden Total<br />
No <strong>Occupation</strong>al category Obs SIR Obs SIR Obs SIR Obs SIR Obs SIR Obs SIR 95% CI<br />
1 Technical workers, etc 5 0.60 6 0.36 [0.08] 0.00 3 1.38 21 0.71 35 0.62 0.43*0.86<br />
2 Laboratory assistants 4 0.75 11 1.08 [0.13] 0.00 4 1.29 4 0.88 23 0.99 0.63*1.48<br />
3 Physicians 4 1.48 4 1.02 [0.03] 0.00 1 0.76 [5.75] 0.00 9 0.66 0.30*1.25<br />
4 Dentists 2 0.82 1 0.17 [0.01] 0.00 1 0.82 2 0.35 6 0.39 0.14*0.85<br />
5 Nurses 31 0.63 26 0.51 1 1.33 14 0.59 63 0.66 135 0.61 0.52*0.73<br />
6 Assistant nurses 25 0.74 49 0.83 1 0.90 19 0.80 101 0.65 195 0.72 0.62*0.82<br />
7 ‘‘Other health workers’’ 20 0.71 44 0.99 [0.20] 0.00 23 0.90 43 0.86 130 0.88 0.74*1.04<br />
8 Teachers 43 0.74 95 0.91 [1.28] 0.00 34 0.71 147 0.67 319 0.74 0.67*0.83<br />
9 Religious workers etc 4 0.49 34 0.88 1 4.85 9 0.77 34 0.56 82 0.69 0.55*0.85<br />
10 Artistic workers 2 0.43 9 1.16 [0.17] 0.00 5 1.30 6 0.46 22 0.75 0.47*1.13<br />
11 Journalists [0.92] 0.00 4 0.76 [0.04] 0.00 [0.92] 0.00 4 0.68 8 0.62 0.27*1.22<br />
12 Administrators 20 0.73 9 0.52 [0.16] 0.00 10 0.76 31 0.98 70 0.78 0.61*0.99<br />
13 Clerical workers 203 0.84 276 0.85 7 1.68 150 0.95 392 0.75 1 028 0.82 0.77*0.87<br />
14 Sales agents 2 0.86 60 1.05 [0.53] 0.00 28 1.01 84 0.89 174 0.96 0.83*1.11<br />
15 Shop workers 171 0.96 199 1.01 2 0.67 132 0.93 354 0.91 858 0.94 0.88*1.01<br />
16 Farmers 116 0.96 136 0.85 2 0.80 101 0.92 42 1.02 397 0.91 0.83*1.01<br />
17 Gardeners 8 0.50 393 0.93 [0.09] 0.00 68 1.06 98 0.91 567 0.93 0.86*1.01<br />
18 Fishermen 2 3.31 [0.82] 0.00 [0.07] 0.00 [0.69] 0.00 [0.35] 0.00 2 0.79 0.10*2.85<br />
19 Forestry workers [0.16] 0.00 [1.57] 0.00 [0.01] 0.00 [1.07] 0.00 1 0.48 1 0.20 0.01*1.14<br />
20 Miners <strong>and</strong> quarry workers [0.01] 0.00 1 1.29 [0.00] 0.00 [0.05] 0.00 1 2.29 2 1.57 0.19*5.67<br />
21 Seamen [0.14] 0.00 [0.16] 0.00 [0.03] 0.00 [0.33] 0.00 0.00*11.29<br />
22 Transport workers [0.18] 0.00 8 0.74 [0.10] 0.00 1 1.50 6 1.12 15 0.88 0.49*1.45<br />
23 Drivers 3 0.69 2 0.50 [0.03] 0.00 2 0.75 13 1.08 20 0.87 0.53*1.34<br />
24 Postal workers 11 1.15 69 1.12 [1.07] 0.00 30 0.91 93 0.91 203 0.98 0.85*1.12<br />
25 Textile workers 65 1.10 147 1.01 2 0.89 53 0.88 226 0.88 493 0.94 0.86*1.03<br />
26 Shoe <strong>and</strong> leather workers 2 0.46 14 0.79 [0.12] 0.00 4 0.96 20 1.05 40 0.88 0.63*1.20<br />
27 Smelting workers 1 0.94 1 0.24 [0.00] 0.00 [0.33] 0.00 5 1.33 7 0.75 0.30*1.55<br />
28 Mechanics 10 1.01 13 0.75 [0.02] 0.00 4 0.88 48 1.17 75 1.03 0.81*1.29<br />
29 Plumbers [0.12] 0.00 [0.03] 0.00 [0.03] 0.00 [0.03] 0.00 [0.21] 0.00 0.00*17.66<br />
30 Welders 1 0.88 [0.00] 0.00 [0.24] 0.00 1 0.87 2 0.79 0.10*2.85<br />
31 Electrical workers 20 1.44 15 1.62 [0.02] 0.00 3 0.65 20 0.90 58 1.16 0.88*1.50<br />
32 Wood workers 10 2.14 39 1.04 [0.03] 0.00 3 2.01 6 0.94 58 1.16 0.88*1.50<br />
33 Painters [0.19] 0.00 3 0.72 [0.01] 0.00 [0.35] 0.00 1 0.54 4 0.60 0.16*1.55<br />
34 ‘‘Other construction workers’’ [0.16] 0.00 16 0.98 [0.00] 0.00 [0.14] 0.00 [0.17] 0.00 16 0.95 0.54*1.54<br />
35 Bricklayers [0.03] 0.00 [0.50] 0.00 [0.01] 0.00 [0.00] 0.00 [0.54] 0.00 0.00*6.86<br />
36 Printers 6 1.09 16 0.92 [0.16] 0.00 2 0.43 17 0.90 41 0.88 0.63*1.20<br />
37 Chemical process workers 8 0.91 4 0.43 [0.08] 0.00 6 1.46 20 1.28 38 1.00 0.71*1.37<br />
38 Food workers 55 1.31 48 0.96 4 0.98 26 0.93 51 0.97 184 1.04 0.90*1.20<br />
39 Beverage workers 6 1.40 3 1.01 [0.01] 0.00 [0.21] 0.00 1 0.28 10 0.91 0.44*1.67<br />
40 Tobacco workers 9 1.55 2 1.22 4 3.82 1 0.57 16 1.56 0.89*2.54<br />
41 Glass makers etc 8 0.80 28 0.83 [0.11] 0.00 16 1.85 34 0.84 86 0.93 0.74*1.14<br />
42 Packers 6 2.03 61 1.02 [0.43] 0.00 26 1.22 60 0.95 153 1.03 0.88*1.21<br />
43 Engine operators [0.07] 0.00 7 0.76 [0.01] 0.00 [0.22] 0.00 1 0.39 8 0.67 0.29*1.31<br />
44 Public safety workers [0.41] 0.00 3 1.42 [0.09] 0.00 5 1.82 5 1.45 13 1.47 0.79*2.52<br />
45 Cooks <strong>and</strong> stewards [0.12] 0.00 56 0.82 3 1.78 37 1.09 114 1.05 210 0.99 0.86*1.13<br />
46 Domestic assistants 59 0.88 41 0.60 2 3.83 77 0.90 258 1.06 437 0.94 0.86*1.03<br />
47 Waiters 9 0.79 49 0.94 2 11.83 30 0.93 94 0.92 184 0.93 0.80*1.07<br />
48 Building caretakers 217 1.09 272 1.12 5 1.50 139 1.02 323 1.24 956 1.13 1.06*1.21<br />
49 Chimney sweeps [0.02] 0.00 [0.11] 0.00 [0.02] 0.00 [0.00] 0.00 [0.15] 0.00 0.00*24.49<br />
50 Hairdressers 9 0.83 16 0.80 [0.12] 0.00 9 1.12 27 0.77 61 0.82 0.63*1.06<br />
51 Launderers 21 0.94 18 0.88 3 5.09 12 0.92 55 0.95 109 0.95 0.79*1.15<br />
52 Military personnel [0.12] 0.00 [0.11] 0.00 [0.03] 0.00 [0.06] 0.00 [0.31] 0.00 0.00*11.75<br />
53 ‘‘Other workers’’ 58 1.05 71 1.00 3 0.96 71 1.02 105 0.95 308 0.99 0.89*1.11<br />
54 Economically inactive 1 712 1.05 2 091 1.11 6 0.53 1 174 1.06 6 186 1.07 11 169 1.07 1.05*1.09<br />
1 54 All categories 2 967 1.00 4 471 1.00 44 1.00 2 336 1.00 9 219 1.00 19 037 1.00 Ref.<br />
Obs observed number of cases; SIR st<strong>and</strong>ardised incidence ratio; 95% CI 95% confidence interval.
Acta Oncol Downloaded from informahealthcare.com by 212.35.100.66 on 04/06/11<br />
For personal use only.<br />
/ 100 000<br />
10<br />
8<br />
6<br />
4<br />
2<br />
0<br />
Denmark<br />
Finl<strong>and</strong><br />
Icel<strong>and</strong><br />
Norway<br />
Sweden<br />
Men<br />
1945 1960 1975 1990 2005<br />
of our study do not support a role of any of the specific<br />
occupational exposures.<br />
Cancer of the pancreas<br />
The incidence of pancreatic <strong>cancer</strong> in the Nordic<br />
countries is 50% higher in men than in women<br />
(Figure 24). In both genders <strong>and</strong> for all countries,<br />
the incidence increased until the mid 1970s, <strong>and</strong><br />
after that it decreased in men <strong>and</strong> plateaued in<br />
women.<br />
In the present study the highest SIR among men<br />
was observed among beverage workers (SIR 1.70,<br />
95% CI 1.35 2.11), followed by waiters, chimney<br />
sweeps, cooks <strong>and</strong> stewards (Table 28). The SIR was<br />
lowest among farmers (0.81, 0.78 0.83) <strong>and</strong> gardeners.<br />
In women, the highest significant SIRs were seen<br />
among drivers (1.32, 1.04 1.64) <strong>and</strong> mechanics<br />
(Table 29). The SIR was lowest among forestry<br />
workers (0.39, 0.13 0.91) <strong>and</strong> farmers.<br />
/ 100 000<br />
10<br />
8<br />
6<br />
4<br />
2<br />
0<br />
Denmark<br />
Finl<strong>and</strong><br />
Icel<strong>and</strong><br />
Norway<br />
Sweden<br />
Women<br />
1945 1960 1975 1990 2005<br />
Figure 24. Age st<strong>and</strong>ardised (World) incidence rates for pancreatic <strong>cancer</strong> 1943 2005, by country <strong>and</strong> gender. Modified from NORDCAN<br />
[49].<br />
/ 100 000<br />
2<br />
1.5<br />
1<br />
.5<br />
0<br />
Denmark<br />
Finl<strong>and</strong><br />
Icel<strong>and</strong><br />
Norway<br />
Sweden<br />
Men<br />
1945 1960 1975 1990 2005<br />
/ 100 000<br />
Comment. Cigarette smoking is the most consistent<br />
<strong>and</strong> strongest risk factor for <strong>cancer</strong> of the pancreas<br />
[72]. The distribution of SIRs is also largely in<br />
accordance with what is known about smoking<br />
prevalence among the occupational categories. An<br />
association has been suggested with exposure to<br />
metals, metalworking fluids containing PAHs, nitrosamines<br />
<strong>and</strong> chlorinated hydrocarbons [72]. From<br />
the present results, findings among chimney sweeps<br />
might well be related to exposure to PAHs.<br />
Cancer of the nose <strong>and</strong> nasal sinuses<br />
Nasal <strong>cancer</strong> is rare. Rates are somewhat higher in<br />
men than in women <strong>and</strong> have been fairly constant<br />
(Figure 25).<br />
In men, the SIR was highest among woodworkers<br />
(SIR 1.84, 95% CI 1.66 2.04), consistently in all<br />
Nordic countries. In Norway, smelting workers <strong>and</strong><br />
glass, ceramic <strong>and</strong> tile workers also had increased<br />
2<br />
1.5<br />
1<br />
.5<br />
0<br />
<strong>Occupation</strong> <strong>and</strong> <strong>cancer</strong> in Nordic countries 691<br />
Denmark<br />
Finl<strong>and</strong><br />
Icel<strong>and</strong><br />
Norway<br />
Sweden<br />
Women<br />
1945 1960 1975 1990 2005<br />
Figure 25. Age st<strong>and</strong>ardised (World) incidence rates for nasal <strong>cancer</strong> 1943 2005, by country <strong>and</strong> gender. Modified from NORDCAN [49].
Acta Oncol Downloaded from informahealthcare.com by 212.35.100.66 on 04/06/11<br />
For personal use only.<br />
692 E. Pukkala et al.<br />
Table 28. Observed number of pancreatic <strong>cancer</strong> among men in the Nordic countries <strong>and</strong> st<strong>and</strong>ardised incidence ratios 1961 2005, by<br />
country <strong>and</strong> occupational category.<br />
Denmark Finl<strong>and</strong> Icel<strong>and</strong> Norway Sweden Total<br />
No <strong>Occupation</strong>al category Obs SIR Obs SIR Obs SIR Obs SIR Obs SIR Obs SIR 95% CI<br />
1 Technical workers, etc 482 0.99 463 0.93 6 1.25 256 0.81 1570 0.95 2 777 0.94 0.90*0.97<br />
2 Laboratory assistants 10 1.01 15 1.24 3 3.24 19 1.18 6 0.91 53 1.16 0.87*1.52<br />
3 Physicians 45 1.11 37 1.29 1 0.51 45 0.98 74 1.00 202 1.06 0.92*1.21<br />
4 Dentists 14 1.22 3 0.49 [0.48] 0.00 18 0.88 33 0.87 68 0.89 0.69*1.13<br />
5 Nurses [0.51] 0.00 [1.33] 0.00 [0.01] 0.00 1 0.67 2 0.67 3 0.47 0.10*1.38<br />
6 Assistant nurses 9 0.78 1 0.87 [0.23] 0.00 12 1.48 31 1.20 53 1.13 0.84*1.48<br />
7 ‘‘Other health workers’’ 41 1.14 21 0.74 [0.53] 0.00 25 1.42 69 1.07 156 1.06 0.90*1.24<br />
8 Teachers 191 0.91 163 0.77 5 0.70 202 0.83 377 0.90 938 0.86 0.81*0.92<br />
9 Religious workers etc 87 0.94 106 0.95 5 1.06 99 0.76 308 0.95 605 0.91 0.84*0.99<br />
10 Artistic workers 28 0.96 43 1.06 1 0.78 42 1.11 118 1.17 232 1.10 0.97*1.26<br />
11 Journalists 9 0.67 21 1.05 1 1.35 17 1.05 58 1.22 106 1.08 0.90*1.31<br />
12 Administrators 569 1.01 319 0.98 11 0.89 457 0.98 728 1.07 2 084 1.02 0.97*1.06<br />
13 Clerical workers 250 1.01 215 0.99 19 1.36 336 0.98 739 1.03 1 559 1.01 0.96*1.06<br />
14 Sales agents 154 1.18 304 0.99 5 0.71 457 1.10 1138 1.10 2 058 1.09 1.04*1.13<br />
15 Shop workers 648 1.12 113 0.89 5 1.02 161 1.08 363 1.11 1 290 1.09 1.03*1.15<br />
16 Farmers 814 0.74 1 354 0.85 7 0.34 1 042 0.82 1607 0.80 4 824 0.81 0.78*0.83<br />
17 Gardeners 116 0.73 181 0.84 2 2.97 235 0.79 616 0.87 1 150 0.83 0.79*0.88<br />
18 Fishermen 63 1.18 26 1.27 14 1.20 427 1.12 66 0.86 596 1.10 1.01*1.19<br />
19 Forestry workers 11 0.47 235 0.93 [0.11] 0.00 155 0.68 498 0.97 899 0.88 0.83*0.94<br />
20 Miners <strong>and</strong> quarry workers 5 0.67 50 1.25 [0.19] 0.00 69 1.16 132 1.06 256 1.11 0.98*1.25<br />
21 Seamen 82 1.45 59 1.11 2 0.62 331 1.18 106 1.00 580 1.16 1.07*1.26<br />
22 Transport workers 112 0.91 185 1.16 6 0.91 159 1.04 351 1.01 813 1.03 0.96*1.10<br />
23 Drivers 482 1.18 557 1.12 11 1.17 437 1.06 945 1.12 2 432 1.12 1.08*1.16<br />
24 Postal workers 74 0.99 83 1.09 2 1.62 85 1.02 196 1.02 440 1.03 0.94*1.13<br />
25 Textile workers 72 0.97 52 0.99 3 1.42 117 1.25 197 0.87 441 0.98 0.90*1.08<br />
26 Shoe <strong>and</strong> leather workers 18 0.97 18 0.78 2 4.31 50 1.21 89 0.94 177 1.00 0.86*1.15<br />
27 Smelting workers 160 0.99 73 0.93 1 0.34 128 1.04 388 1.10 750 1.04 0.97*1.12<br />
28 Mechanics 458 1.06 467 0.95 8 0.89 634 1.12 1641 1.07 3 208 1.06 1.02*1.09<br />
29 Plumbers 35 0.91 92 1.13 [1.46] 0.00 64 1.01 212 1.19 403 1.11 1.00*1.22<br />
30 Welders 79 1.06 1 1.85 70 1.02 198 1.03 348 1.04 0.93*1.15<br />
31 Electrical workers 117 1.16 229 1.12 7 1.32 247 1.00 513 1.00 1 113 1.04 0.98*1.10<br />
32 Wood workers 298 1.00 553 1.01 3 0.57 666 0.95 1 001 0.90 2 521 0.94 0.91*0.98<br />
33 Painters 92 0.94 118 1.04 3 1.42 107 0.91 321 1.02 641 0.99 0.92*1.07<br />
34 ‘‘Other construction workers’’ 410 1.05 378 1.07 6 0.57 152 1.13 574 0.95 1 520 1.02 0.97*1.07<br />
35 Bricklayers 115 1.05 50 0.88 67 0.96 156 1.08 388 1.02 0.92*1.13<br />
36 Printers 83 1.21 60 1.22 5 2.95 86 1.28 172 1.06 406 1.16 1.06*1.28<br />
37 Chemical process workers 70 1.06 76 0.90 [0.98] 0.00 178 1.11 298 1.10 622 1.07 0.99*1.16<br />
38 Food workers 199 0.95 81 1.32 7 0.84 205 1.15 255 0.97 747 1.04 0.96*1.11<br />
39 Beverage workers 48 1.79 10 2.41 [0.14] 0.00 5 3.55 19 1.20 82 1.70 1.35*2.11<br />
40 Tobacco workers 3 0.68 1 1.39 [0.01] 0.00 6 2.11 [1.13] 0.00 10 1.10 0.53*2.02<br />
41 Glass makers etc 132 1.06 88 1.00 1 0.68 90 1.09 259 0.90 570 0.98 0.90*1.06<br />
42 Packers 104 0.92 253 1.36 12 2.49 316 1.17 642 1.19 1 327 1.19 1.13*1.26<br />
43 Engine operators 110 1.01 240 0.99 5 0.80 158 1.14 457 1.08 970 1.05 0.99*1.12<br />
44 Public safety workers 92 0.91 162 1.14 5 1.10 133 1.18 271 1.13 663 1.10 1.02*1.19<br />
45 Cooks <strong>and</strong> stewards 11 1.34 12 1.47 1 0.48 66 1.42 53 1.26 143 1.34 1.13*1.57<br />
46 Domestic assistants [0.09] 0.00 [0.61] 0.00 [0.01] 0.00 [0.36] 0.00 2 0.66 2 0.49 0.06*1.76<br />
47 Waiters 29 1.58 14 1.80 1 4.60 23 1.11 33 1.53 100 1.45 1.19*1.77<br />
48 Building caretakers 136 1.21 107 0.87 2 0.97 82 1.41 239 1.14 566 1.12 1.03*1.22<br />
49 Chimney sweeps 4 1.42 14 1.55 10 1.70 16 1.15 44 1.39 1.01*1.87<br />
50 Hairdressers 27 0.85 6 2.38 1 3.34 16 0.93 62 1.20 112 1.08 0.90*1.30<br />
51 Launderers 21 1.37 4 1.57 1 4.89 17 1.66 35 0.95 78 1.19 0.94*1.49<br />
52 Military personnel 52 1.08 35 0.80 85 1.01 121 0.88 293 0.93 0.83*1.05<br />
53 ‘‘Other workers’’ 368 1.06 143 0.98 19 1.04 546 1.03 677 1.03 1 753 1.03 0.99*1.08<br />
54 Economically inactive 433 1.09 993 1.18 19 1.45 261 0.94 1 067 1.07 2 773 1.10 1.06*1.14<br />
1 54 All categories 7 993 1.00 8 962 1.00 219 1.00 9 672 1.00 20 099 1.00 46 945 1.00 Ref.<br />
Obs observed number of cases; SIR st<strong>and</strong>ardised incidence ratio; 95% CI 95% confidence interval.
Acta Oncol Downloaded from informahealthcare.com by 212.35.100.66 on 04/06/11<br />
For personal use only.<br />
Table 29. Observed number of pancreatic <strong>cancer</strong> among women in the Nordic countries <strong>and</strong> st<strong>and</strong>ardised incidence ratios 1961 2005, by<br />
country <strong>and</strong> occupational category.<br />
Denmark Finl<strong>and</strong> Icel<strong>and</strong> Norway Sweden Total<br />
No <strong>Occupation</strong>al category Obs SIR Obs SIR Obs SIR Obs SIR Obs SIR Obs SIR 95% CI<br />
1 Technical workers, etc 21 0.91 35 0.90 1 2.36 10 1.13 74 1.10 141 1.02 0.86*1.20<br />
2 Laboratory assistants 15 0.96 21 0.91 2 3.18 17 1.36 6 0.45 61 0.94 0.72*1.20<br />
3 Physicians 7 0.93 9 0.99 [0.14] 0.00 3 0.58 12 0.86 31 0.86 0.59*1.22<br />
4 Dentists 3 0.44 9 0.69 [0.05] 0.00 9 1.92 9 0.71 30 0.81 0.55*1.15<br />
5 Nurses 129 0.95 111 0.95 4 1.20 84 0.87 199 0.93 527 0.93 0.86*1.02<br />
6 Assistant nurses 94 0.98 131 1.00 4 0.85 90 0.92 342 0.96 661 0.97 0.89*1.04<br />
7 ‘‘Other health workers’’ 93 1.20 98 0.98 [0.92] 0.00 92 0.91 120 1.03 403 1.02 0.92*1.12<br />
8 Teachers 167 1.02 217 0.93 8 1.41 144 0.77 435 0.90 971 0.91 0.85*0.97<br />
9 Religious workers etc 18 0.80 87 0.94 [0.89] 0.00 47 1.00 126 0.88 278 0.91 0.81*1.02<br />
10 Artistic workers 9 0.73 16 0.91 [0.69] 0.00 23 1.52 26 0.88 74 0.98 0.77*1.23<br />
11 Journalists 2 0.78 5 0.43 [0.17] 0.00 6 1.63 12 0.89 25 0.79 0.51*1.17<br />
12 Administrators 78 1.06 43 1.11 [0.62] 0.00 65 1.28 77 1.10 263 1.12 1.00*1.27<br />
13 Clerical workers 699 1.03 756 1.04 19 1.07 599 0.95 1 252 1.07 3 325 1.03 1.00*1.07<br />
14 Sales agents 1 0.16 131 1.06 [2.03] 0.00 100 0.96 204 1.06 436 1.02 0.93*1.12<br />
15 Shop workers 479 0.99 428 0.99 10 0.85 550 0.97 862 1.05 2 329 1.00 0.96*1.05<br />
16 Farmers 247 0.74 290 0.87 11 1.19 356 0.82 63 0.78 967 0.81 0.76*0.87<br />
17 Gardeners 48 1.11 859 0.96 [0.31] 0.00 214 0.83 176 0.79 1 297 0.91 0.86*0.96<br />
18 Fishermen [1.68] 0.00 [1.81] 0.00 1 3.60 4 1.44 1 1.38 6 0.82 0.30*1.79<br />
19 Forestry workers 1 2.28 1 0.29 [0.04] 0.00 [4.43] 0.00 3 0.67 5 0.39 0.13*0.91<br />
20 Miners <strong>and</strong> quarry workers [0.04] 0.00 [1.61] 0.00 [0.01] 0.00 1 5.44 2 2.03 3 1.06 0.22*3.11<br />
21 Seamen [0.30] 0.00 [0.00] 0.00 [0.63] 0.00 [0.09] 0.00 [1.02] 0.00 0.00*3.61<br />
22 Transport workers 1 2.05 27 1.16 [0.32] 0.00 2 0.74 16 1.35 46 1.19 0.87*1.59<br />
23 Drivers 11 0.92 8 0.88 [0.13] 0.00 11 1.03 48 1.75 78 1.32 1.04*1.64<br />
24 Postal workers 28 1.09 123 0.91 5 1.23 123 0.96 249 1.12 528 1.03 0.94*1.12<br />
25 Textile workers 202 1.25 306 0.98 6 0.73 254 1.10 506 0.97 1 274 1.03 0.98*1.09<br />
26 Shoe <strong>and</strong> leather workers 14 1.18 29 0.76 1 2.42 29 1.79 45 1.16 118 1.12 0.93*1.34<br />
27 Smelting workers 2 0.68 9 1.00 [0.02] 0.00 1 0.74 13 1.52 25 1.14 0.74*1.69<br />
28 Mechanics 38 1.37 47 1.24 [0.06] 0.00 24 1.33 101 1.12 210 1.20 1.05*1.38<br />
29 Plumbers [0.30] 0.00 [0.07] 0.00 [0.11] 0.00 [0.09] 0.00 [0.57] 0.00 0.00*6.50<br />
30 Welders 3 1.14 [0.00] 0.00 [1.01] 0.00 6 2.11 9 1.39 0.64*2.64<br />
31 Electrical workers 34 0.87 21 1.00 [0.06] 0.00 20 1.07 50 1.01 125 0.97 0.82*1.16<br />
32 Wood workers 10 0.77 76 0.94 [0.12] 0.00 6 0.99 19 1.32 111 0.97 0.81*1.17<br />
33 Painters [0.52] 0.00 13 1.44 [0.03] 0.00 2 1.40 6 1.47 21 1.39 0.86*2.12<br />
34 ‘‘Other construction workers’’ [0.42] 0.00 35 1.01 [0.02] 0.00 [0.56] 0.00 1 2.41 36 1.00 0.70*1.39<br />
35 Bricklayers [0.08] 0.00 [1.09] 0.00 [0.03] 0.00 [0.01] 0.00 [1.20] 0.00 0.00*3.07<br />
36 Printers 17 1.12 38 1.01 1 1.53 15 0.84 49 1.22 120 1.08 0.90*1.29<br />
37 Chemical process workers 32 1.33 26 1.28 [0.31] 0.00 14 0.86 32 0.97 104 1.11 0.91*1.34<br />
38 Food workers 136 1.17 99 0.92 13 0.84 126 1.15 104 0.98 478 1.05 0.96*1.15<br />
39 Beverage workers 25 2.16 4 0.64 [0.04] 0.00 1 1.16 4 0.57 34 1.32 0.92*1.85<br />
40 Tobacco workers 22 1.40 2 0.57 5 1.28 3 0.80 32 1.19 0.81*1.68<br />
41 Glass makers etc 37 1.32 65 0.89 [0.40] 0.00 36 1.05 97 1.13 235 1.06 0.93*1.20<br />
42 Packers 13 1.60 115 0.89 4 2.51 87 1.03 138 1.04 357 1.00 0.90*1.11<br />
43 Engine operators [0.21] 0.00 19 0.94 [0.02] 0.00 [0.89] 0.00 8 1.26 27 0.98 0.64*1.42<br />
44 Public safety workers [1.06] 0.00 2 0.43 [0.31] 0.00 6 0.54 12 1.44 20 0.79 0.48*1.22<br />
45 Cooks <strong>and</strong> stewards 1 3.15 132 0.89 6 0.97 124 0.96 250 1.17 513 1.03 0.94*1.12<br />
46 Domestic assistants 191 1.05 148 1.00 2 1.06 314 0.96 482 0.96 1 137 0.98 0.92*1.04<br />
47 Waiters 43 1.37 122 1.06 1 1.50 149 1.16 232 1.11 547 1.13 1.04*1.23<br />
48 Building caretakers 564 1.05 571 1.09 16 1.30 619 1.14 637 1.19 2 407 1.12 1.08*1.17<br />
49 Chimney sweeps [0.05] 0.00 [0.24] 0.00 1 12.38 [0.01] 0.00 1 2.68 0.07*14.91<br />
50 Hairdressers 32 1.05 48 1.09 [0.58] 0.00 41 1.29 97 1.25 218 1.18 1.03*1.35<br />
51 Launderers 77 1.27 40 0.93 5 2.34 59 1.16 124 1.07 305 1.12 1.00*1.25<br />
52 Military personnel [0.31] 0.00 [0.29] 0.00 [0.12] 0.00 [0.19] 0.00 [0.91] 0.00 0.00*4.07<br />
53 ‘‘Other workers’’ 162 1.07 153 1.00 13 1.09 290 1.05 278 1.20 896 1.09 1.02*1.16<br />
54 Economically inactive 4 140 0.97 3 970 1.03 37 0.87 4 082 1.01 11 294 0.98 23 523 0.99 0.98*1.00<br />
1 54 All categories 7 943 1.00 9 498 1.00 170 1.00 8 855 1.00 18 902 1.00 45 368 1.00 Ref.<br />
Obs observed number of cases; SIR st<strong>and</strong>ardised incidence ratio; 95% CI 95% confidence interval.<br />
<strong>Occupation</strong> <strong>and</strong> <strong>cancer</strong> in Nordic countries 693
Acta Oncol Downloaded from informahealthcare.com by 212.35.100.66 on 04/06/11<br />
For personal use only.<br />
694 E. Pukkala et al.<br />
SIRs. The lowest SIRs were observed among military<br />
personnel (0.43, 0.22 0.77), teachers, gardeners,<br />
<strong>and</strong> farmers (Table 30).<br />
Female woodworkers had an elevated SIR (1.88,<br />
0.90 3.46). The SIR was borderline significant<br />
among female packers, loaders <strong>and</strong> warehouse workers<br />
(1.52, 0.99 2.23), based on the high SIR in<br />
Norway (10 cases; Table 31).<br />
The SIR for adenocarcinoma of the nose among<br />
male woodworkers was 5.50 (4.60 6.56). Among<br />
women, there were only 141 cases of nasal <strong>cancer</strong><br />
classified as adenocarcinoma <strong>and</strong> no significant<br />
findings (http://astra.<strong>cancer</strong>.fi/NOCCA/Incidence/<br />
nose-adenocarcinoma).<br />
Comment. Several occupations <strong>and</strong> industrial exposures<br />
have been associated with an increased risk<br />
of nasal <strong>cancer</strong> [73]. However, due to the rarity of<br />
these tumours, the identification of high risk groups<br />
has frequently been based on few cases. There has<br />
been little evidence of non-occupational causes for<br />
this disease. Relative risks well in excess of 5 10 in<br />
the boot <strong>and</strong> shoe manufacturing industries have<br />
been reported [74]. Shoe <strong>and</strong> leather workers are<br />
exposed to dust from leather <strong>and</strong> to benzene from<br />
the glue [75]. In the earlier Nordic study based on<br />
census occupations <strong>and</strong> follow-up from 1971 1991<br />
[1], shoe <strong>and</strong> leather workers experienced the highest<br />
risk of nasal <strong>cancer</strong> with an SIR of 2.94 (95% CI<br />
1.47 5.26). In the present follow-up there was no<br />
longer any such excess risk, possibly reflecting<br />
decreasing exposure levels in the shoe <strong>and</strong> leather<br />
industry.<br />
In the present study, woodworkers had the highest<br />
SIR, <strong>and</strong> the excess was consistent over countries<br />
<strong>and</strong> genders. Most of the available cohort <strong>and</strong> casecontrol<br />
studies of nasal <strong>cancer</strong> have shown increased<br />
/ 100 000<br />
8<br />
6<br />
4<br />
2<br />
Denmark<br />
Finl<strong>and</strong><br />
Icel<strong>and</strong><br />
Norway<br />
Sweden<br />
Men<br />
0<br />
1945 1960 1975 1990 2005<br />
/ 100 000<br />
risks associated with exposure to wood dust [76].<br />
The highest relative risk ever reported for any<br />
occupational risk (RR 500) is the one between<br />
hard wood dust <strong>and</strong> sinonasal adenocarcinoma<br />
[77]. Our study did not replicate such an extreme<br />
risk, but an SIR of 5.50, possibly because the<br />
majority of woodworkers in the Nordic countries<br />
are exposed to soft wood.<br />
An excess risk of nasal <strong>cancer</strong> in workers exposed<br />
to benzene in gasoline vapours has been reported<br />
[78], but the present study did not suggest such<br />
associations. Increased risk of nasal <strong>cancer</strong> has also<br />
been found to be associated with exposures to<br />
employment in the nickel process industry [79].<br />
In the present study, nickel process workers are<br />
included in the broad group of smelting workers.<br />
An elevated SIR was seen in Norway where an<br />
important nickel refinery is located [80].<br />
Laryngeal <strong>cancer</strong><br />
The gender ratio for larynx <strong>cancer</strong> is large, with rates<br />
being 12 20 times higher for men than for women in<br />
Finl<strong>and</strong> <strong>and</strong> approximately 5 12 times higher in the<br />
other countries, throughout the period. In Finnish<br />
men, rates peaked during the 1960s <strong>and</strong> have been<br />
decreasing ever since. In the other countries the<br />
incidence increased until around 1990 (Figure 26).<br />
Elevated SIRs were seen in several groups, most<br />
pronounced among male waiters (SIR 3.52, 95% CI<br />
2.90 4.27), beverage manufacture workers, cooks<br />
<strong>and</strong> stewards, seamen, <strong>and</strong> hairdressers. Male farmers<br />
(0.46, 0.44 0.49), laboratory assistants, teachers<br />
<strong>and</strong> physicians were all at low risk (Table 32).<br />
Among women, ‘‘other construction workers’’<br />
(7.39, 3.54 13.58), public <strong>and</strong> safety protection<br />
workers (5 cases), mechanics, waitresses, printers,<br />
8<br />
6<br />
4<br />
2<br />
Denmark<br />
Finl<strong>and</strong><br />
Icel<strong>and</strong><br />
Norway<br />
Sweden<br />
Women<br />
0<br />
1945 1960 1975 1990 2005<br />
Figure 26. Age st<strong>and</strong>ardised (World) incidence rates for laryngeal <strong>cancer</strong> 1943 2005, by country <strong>and</strong> gender. Modified from NORDCAN<br />
[49].
Acta Oncol Downloaded from informahealthcare.com by 212.35.100.66 on 04/06/11<br />
For personal use only.<br />
Table 30. Observed number of nasal <strong>cancer</strong> among men in the Nordic countries <strong>and</strong> st<strong>and</strong>ardised incidence ratios 1961 2005, by country<br />
<strong>and</strong> occupational category.<br />
Denmark Finl<strong>and</strong> Icel<strong>and</strong> Norway Sweden Total<br />
No <strong>Occupation</strong>al category Obs SIR Obs SIR Obs SIR Obs SIR Obs SIR Obs SIR 95% CI<br />
1 Technical workers, etc 56 1.15 24 0.78 [0.47] 0.00 15 0.56 111 0.88 206 0.88 0.77*1.01<br />
2 Laboratory assistants 1 1.04 [0.76] 0.00 [0.08] 0.00 [1.33] 0.00 [0.62] 0.00 1 0.27 0.01*1.48<br />
3 Physicians 3 0.75 [1.75] 0.00 [0.19] 0.00 5 1.37 4 0.70 12 0.78 0.40*1.37<br />
4 Dentists [1.17] 0.00 1 2.75 [0.05] 0.00 2 1.22 [2.85] 0.00 3 0.49 0.10*1.45<br />
5 Nurses [0.05] 0.00 [0.11] 0.00 [0.00] 0.00 [0.16] 0.00 1 3.01 1 1.54 0.04*8.58<br />
6 Assistant nurses 2 1.72 [0.10] 0.00 [0.02] 0.00 [0.64] 0.00 4 1.90 6 1.49 0.55*3.25<br />
7 ‘‘Other health workers’’ 3 0.87 2 1.15 [0.05] 0.00 [1.45] 0.00 4 0.82 9 0.78 0.36*1.48<br />
8 Teachers 21 0.99 6 0.48 [0.66] 0.00 11 0.55 22 0.68 60 0.69 0.53*0.89<br />
9 Religious workers etc 6 0.67 9 1.28 [0.46] 0.00 12 1.14 19 0.75 46 0.88 0.65*1.18<br />
10 Artistic workers 3 1.09 4 1.63 [0.13] 0.00 2 0.65 3 0.39 12 0.74 0.38*1.30<br />
11 Journalists [1.30] 0.00 1 0.83 [0.07] 0.00 1 0.75 4 1.10 6 0.80 0.29*1.73<br />
12 Administrators 54 0.99 25 1.31 2 1.70 43 1.16 40 0.81 164 1.02 0.87*1.19<br />
13 Clerical workers 25 1.06 13 1.03 2 1.46 23 0.83 42 0.79 105 0.89 0.73*1.07<br />
14 Sales agents 14 1.12 15 0.83 [0.67] 0.00 21 0.64 68 0.88 118 0.84 0.70*1.00<br />
15 Shop workers 45 0.83 8 1.03 [0.48] 0.00 14 1.13 28 1.15 95 0.95 0.77*1.17<br />
16 Farmers 65 0.61 72 0.84 3 1.48 83 0.88 118 0.87 341 0.81 0.72*0.90<br />
17 Gardeners 6 0.40 12 0.97 [0.07] 0.00 14 0.60 40 0.81 72 0.72 0.56*0.91<br />
18 Fishermen 9 1.81 1 0.89 2 1.82 36 1.21 8 1.51 56 1.33 1.00*1.72<br />
19 Forestry workers 2 0.92 16 1.09 [0.01] 0.00 19 1.09 38 1.05 75 1.06 0.84*1.33<br />
20 Miners <strong>and</strong> quarry workers 1 1.50 2 0.84 [0.02] 0.00 3 0.63 6 0.67 12 0.72 0.37*1.25<br />
21 Seamen 6 1.12 1 0.32 1 3.32 21 0.91 12 1.55 41 1.03 0.74*1.40<br />
22 Transport workers 13 1.10 6 0.64 [0.63] 0.00 13 1.05 24 0.93 56 0.93 0.70*1.21<br />
23 Drivers 40 1.05 23 0.77 [0.88] 0.00 46 1.36 75 1.18 184 1.11 0.96*1.28<br />
24 Postal workers 4 0.53 2 0.44 [0.12] 0.00 8 1.20 18 1.27 32 0.97 0.66*1.37<br />
25 Textile workers 4 0.59 4 1.37 [0.21] 0.00 9 1.24 21 1.33 38 1.15 0.82*1.58<br />
26 Shoe <strong>and</strong> leather workers 6 3.62 2 1.56 [0.04] 0.00 3 0.94 6 0.93 17 1.35 0.79*2.16<br />
27 Smelting workers 15 1.00 3 0.66 [0.28] 0.00 22 2.24 26 1.03 66 1.20 0.93*1.53<br />
28 Mechanics 40 0.99 31 1.05 [0.87] 0.00 55 1.18 105 0.91 231 0.99 0.87*1.13<br />
29 Plumbers 2 0.55 3 0.61 [0.14] 0.00 2 0.37 20 1.50 27 0.99 0.65*1.44<br />
30 Welders 5 1.05 [0.05] 0.00 8 1.37 16 1.07 29 1.13 0.76*1.62<br />
31 Electrical workers 5 0.52 11 0.87 [0.50] 0.00 24 1.16 39 0.99 79 0.95 0.76*1.19<br />
32 Wood workers 74 2.64 46 1.46 1 1.94 74 1.35 160 2.04 355 1.84 1.66*2.04<br />
33 Painters 14 1.52 4 0.61 [0.19] 0.00 7 0.75 18 0.80 43 0.90 0.65*1.21<br />
34 ‘‘Other construction workers’’ 39 1.12 36 1.75 1 1.00 10 0.92 51 1.19 137 1.24 1.05*1.47<br />
35 Bricklayers 9 0.89 3 0.91 4 0.73 13 1.28 29 1.00 0.67*1.43<br />
36 Printers 8 1.24 1 0.33 [0.15] 0.00 5 0.91 8 0.66 22 0.81 0.51*1.22<br />
37 Chemical process workers 9 1.51 7 1.40 [0.09] 0.00 10 0.80 21 1.10 47 1.10 0.81*1.46<br />
38 Food workers 13 0.67 3 0.84 2 2.42 13 0.92 16 0.84 47 0.83 0.61*1.10<br />
39 Beverage workers 6 2.58 [0.24] 0.00 [0.02] 0.00 [0.13] 0.00 2 1.79 8 2.09 0.90*4.12<br />
40 Tobacco workers 1 2.63 1 24.56 [0.00] 0.00 1 4.44 [0.08] 0.00 3 4.10 0.85*11.98<br />
41 Glass makers etc 10 0.88 6 1.14 1 6.87 14 2.09 19 0.91 50 1.13 0.84*1.49<br />
42 Packers 10 0.99 13 1.19 1 2.12 14 0.66 39 1.02 77 0.95 0.75*1.19<br />
43 Engine operators 8 0.78 18 1.23 1 1.65 11 0.95 34 1.08 72 1.05 0.82*1.32<br />
44 Public safety workers 9 0.93 12 1.42 [0.45] 0.00 8 0.89 13 0.72 42 0.92 0.66*1.24<br />
45 Cooks <strong>and</strong> stewards 2 2.69 [0.55] 0.00 1 5.15 2 0.52 6 1.81 11 1.27 0.63*2.27<br />
46 Domestic assistants [0.01] 0.00 [0.03] 0.00 [0.00] 0.00 [0.03] 0.00 [0.31] 0.00 [0.39] 0.00 0.00*9.58<br />
47 Waiters 3 1.94 1 1.86 [0.02] 0.00 1 0.59 3 1.74 8 1.45 0.63*2.86<br />
48 Building caretakers 14 1.38 10 1.40 [0.19] 0.00 5 1.08 9 0.60 38 1.02 0.72*1.41<br />
49 Chimney sweeps [0.26] 0.00 1 1.87 [0.47] 0.00 1 0.96 2 0.86 0.10*3.12<br />
50 Hairdressers 2 0.69 [0.15] 0.00 [0.03] 0.00 3 2.21 3 0.81 8 0.98 0.42*1.94<br />
51 Launderers 4 2.80 [0.15] 0.00 [0.02] 0.00 [0.81] 0.00 4 1.51 8 1.58 0.68*3.12<br />
52 Military personnel 1 0.20 1 0.36 3 0.42 6 0.57 11 0.43 0.22*0.77<br />
53 ‘‘Other workers’’ 38 1.23 6 0.70 1 0.58 39 0.95 40 0.86 124 0.96 0.81*1.15<br />
54 Economically inactive 22 0.78 49 1.07 2 1.61 31 1.38 77 1.03 181 1.05 0.91*1.22<br />
1 54 All categories 747 1.00 520 1.00 21 1.00 770 1.00 1 465 1.00 3 523 1.00 Ref.<br />
Obs observed number of cases; SIR st<strong>and</strong>ardised incidence ratio; 95% CI 95% confidence interval.<br />
<strong>Occupation</strong> <strong>and</strong> <strong>cancer</strong> in Nordic countries 695
Acta Oncol Downloaded from informahealthcare.com by 212.35.100.66 on 04/06/11<br />
For personal use only.<br />
696 E. Pukkala et al.<br />
Table 31. Observed number of nasal <strong>cancer</strong> among women in the Nordic countries <strong>and</strong> st<strong>and</strong>ardised incidence ratios 1961 2005, by<br />
country <strong>and</strong> occupational category.<br />
Denmark Finl<strong>and</strong> Icel<strong>and</strong> Norway Sweden Total<br />
No <strong>Occupation</strong>al category Obs SIR Obs SIR Obs SIR Obs SIR Obs SIR Obs SIR 95% CI<br />
1 Technical workers, etc 1 0.70 1 0.51 [0.05] 0.00 1 1.82 5 1.34 8 1.04 0.45*2.05<br />
2 Laboratory assistants [1.01] 0.00 [1.13] 0.00 [0.08] 0.00 1 1.39 [1.00] 0.00 1 0.25 0.01*1.41<br />
3 Physicians [0.48] 0.00 [0.48] 0.00 [0.02] 0.00 [0.31] 0.00 [0.84] 0.00 [2.11] 0.00 0.00*1.74<br />
4 Dentists [0.43] 0.00 1 1.80 [0.01] 0.00 [0.27] 0.00 1 1.50 2 1.04 0.13*3.75<br />
5 Nurses 8 0.95 4 0.70 1 2.41 4 0.72 11 0.98 28 0.89 0.59*1.29<br />
6 Assistant nurses 7 1.16 5 0.82 [0.53] 0.00 3 0.56 21 1.08 36 0.96 0.67*1.33<br />
7 ‘‘Other health workers’’ 6 1.23 2 0.42 [0.12] 0.00 5 0.88 3 0.46 16 0.73 0.42*1.18<br />
8 Teachers 12 1.14 8 0.74 [0.71] 0.00 8 0.74 27 1.05 55 0.94 0.71*1.22<br />
9 Religious workers etc [1.44] 0.00 2 0.41 [0.11] 0.00 [2.67] 0.00 7 0.84 9 0.52 0.24*0.98<br />
10 Artistic workers [0.74] 0.00 2 2.39 [0.09] 0.00 [0.85] 0.00 1 0.62 3 0.72 0.15*2.12<br />
11 Journalists [0.16] 0.00 1 1.81 [0.02] 0.00 [0.21] 0.00 1 1.34 2 1.18 0.14*4.28<br />
12 Administrators 3 0.67 1 0.55 [0.08] 0.00 [2.85] 0.00 2 0.53 6 0.46 0.17*1.01<br />
13 Clerical workers 37 0.86 44 1.28 3 1.40 38 1.09 69 1.11 191 1.08 0.94*1.25<br />
14 Sales agents [0.40] 0.00 4 0.75 1 4.00 8 1.42 12 1.27 25 1.19 0.77*1.76<br />
15 Shop workers 27 0.91 17 0.88 [1.42] 0.00 24 0.80 32 0.81 100 0.84 0.69*1.02<br />
16 Farmers 15 0.72 9 0.71 1 0.95 18 0.81 3 0.75 46 0.76 0.55*1.01<br />
17 Gardeners 1 0.37 37 1.02 [0.03] 0.00 9 0.69 15 1.44 62 0.99 0.76*1.28<br />
18 Fishermen [0.11] 0.00 [0.08] 0.00 [0.04] 0.00 [0.15] 0.00 [0.04] 0.00 [0.40] 0.00 0.00*9.17<br />
19 Forestry workers [0.03] 0.00 [0.15] 0.00 [0.00] 0.00 [0.22] 0.00 [0.22] 0.00 [0.62] 0.00 0.00*5.92<br />
20 Miners <strong>and</strong> quarry workers [0.00] 0.00 [0.06] 0.00 [0.00] 0.00 [0.01] 0.00 [0.05] 0.00 [0.13] 0.00 0.00*28.73<br />
21 Seamen [0.02] 0.00 [0.03] 0.00 [0.01] 0.00 [0.06] 0.00 0.00*64.46<br />
22 Transport workers [0.03] 0.00 2 2.06 [0.04] 0.00 [0.15] 0.00 [0.62] 0.00 2 1.11 0.13*4.00<br />
23 Drivers 1 1.36 1 2.36 [0.02] 0.00 [0.59] 0.00 4 2.69 6 1.85 0.68*4.02<br />
24 Postal workers [1.58] 0.00 5 0.86 1 2.00 10 1.43 13 1.17 29 1.11 0.75*1.60<br />
25 Textile workers 11 1.12 12 0.90 [0.85] 0.00 9 0.73 27 1.13 59 0.98 0.75*1.27<br />
26 Shoe <strong>and</strong> leather workers 1 1.38 2 1.22 [0.05] 0.00 1 1.16 [1.80] 0.00 4 0.79 0.21*2.02<br />
27 Smelting workers [0.17] 0.00 1 2.60 [0.00] 0.00 [0.08] 0.00 [0.45] 0.00 1 0.92 0.02*5.11<br />
28 Mechanics 3 1.74 [1.68] 0.00 [0.01] 0.00 1 1.03 7 1.50 11 1.21 0.61*2.17<br />
29 Plumbers [0.02] 0.00 [0.00] 0.00 [0.01] 0.00 [0.01] 0.00 [0.03] 0.00 0.00*110.64<br />
30 Welders [0.13] 0.00 [0.00] 0.00 [0.06] 0.00 [0.17] 0.00 [0.36] 0.00 0.00*10.33<br />
31 Electrical workers 3 1.25 1 0.96 [0.01] 0.00 2 1.96 4 1.55 10 1.42 0.68*2.60<br />
32 Wood workers 3 3.71 4 1.18 [0.01] 0.00 [0.32] 0.00 3 3.92 10 1.88 0.90*3.46<br />
33 Painters [0.03] 0.00 [0.40] 0.00 [0.00] 0.00 [0.08] 0.00 [0.21] 0.00 [0.72] 0.00 0.00*5.15<br />
34 ‘‘Other construction workers’’ [0.02] 0.00 1 0.71 [0.00] 0.00 [0.03] 0.00 [0.03] 0.00 1 0.68 0.02*3.76<br />
35 Bricklayers [0.00] 0.00 [0.05] 0.00 [0.00] 0.00 [0.00] 0.00 [0.05] 0.00 0.00*70.69<br />
36 Printers [0.91] 0.00 [1.65] 0.00 [0.07] 0.00 1 1.01 4 1.98 5 0.89 0.29*2.07<br />
37 Chemical process workers 1 0.70 [0.87] 0.00 [0.03] 0.00 2 2.28 2 1.24 5 1.04 0.34*2.42<br />
38 Food workers 10 1.41 3 0.66 2 1.16 9 1.56 7 1.41 31 1.29 0.87*1.83<br />
39 Beverage workers 2 3.03 1 3.89 [0.00] 0.00 [0.04] 0.00 [0.32] 0.00 3 2.33 0.48*6.82<br />
40 Tobacco workers 1 1.10 [0.15] 0.00 [0.22] 0.00 [0.19] 0.00 1 0.69 0.02*3.83<br />
41 Glass makers etc 2 1.17 1 0.32 [0.05] 0.00 2 1.08 6 1.42 11 1.00 0.50*1.80<br />
42 Packers 3 6.05 7 1.26 [0.17] 0.00 10 2.25 6 0.94 26 1.52 0.99*2.23<br />
43 Engine operators [0.01] 0.00 1 1.13 [0.00] 0.00 [0.05] 0.00 [0.37] 0.00 1 0.76 0.02*4.22<br />
44 Public safety workers [0.05] 0.00 [0.20] 0.00 [0.03] 0.00 [0.55] 0.00 1 1.98 1 0.75 0.02*4.15<br />
45 Cooks <strong>and</strong> stewards [0.02] 0.00 8 1.27 [0.64] 0.00 5 0.73 7 0.71 20 0.85 0.52*1.31<br />
46 Domestic assistants 11 0.99 9 1.40 [0.19] 0.00 13 0.76 31 1.22 64 1.06 0.82*1.35<br />
47 Waiters 2 1.08 3 0.58 [0.07] 0.00 7 1.03 8 0.82 20 0.84 0.52*1.30<br />
48 Building caretakers 28 0.87 31 1.43 3 2.29 34 1.20 18 0.70 114 1.04 0.87*1.25<br />
49 Chimney sweeps [0.00] 0.00 [0.01] 0.00 [0.00] 0.00 [0.00] 0.00 [0.02] 0.00 0.00*204.43<br />
50 Hairdressers 3 1.60 3 1.54 [0.07] 0.00 [1.75] 0.00 7 1.76 13 1.35 0.72*2.31<br />
51 Launderers 5 1.37 2 1.13 [0.21] 0.00 3 1.13 4 0.76 14 1.03 0.56*1.73<br />
52 Military personnel [0.02] 0.00 [0.02] 0.00 [0.01] 0.00 [0.02] 0.00 [0.06] 0.00 0.00*64.05<br />
53 ‘‘Other workers’’ 9 1.00 4 0.61 1 0.75 12 0.82 11 0.97 37 0.86 0.61*1.19<br />
54 Economically inactive 253 1.05 156 1.04 6 1.35 243 1.08 529 0.98 1 187 1.02 0.97*1.08<br />
1 54 All categories 469 1.00 396 1.00 19 1.00 483 1.00 909 1.00 2 276 1.00 Ref.<br />
Obs observed number of cases; SIR st<strong>and</strong>ardised incidence ratio;95% CI 95% confidence interval.
Acta Oncol Downloaded from informahealthcare.com by 212.35.100.66 on 04/06/11<br />
For personal use only.<br />
Table 32. Observed number of laryngeal <strong>cancer</strong> among men in the Nordic countries <strong>and</strong> st<strong>and</strong>ardised incidence ratios1961 2005, by<br />
country <strong>and</strong> occupational category.<br />
Denmark Finl<strong>and</strong> Icel<strong>and</strong> Norway Sweden Total<br />
No <strong>Occupation</strong>al category Obs SIR Obs SIR Obs SIR Obs SIR Obs SIR Obs SIR 95% CI<br />
1 Technical workers, etc 266 0.83 95 0.50 1 0.47 71 0.52 466 0.81 899 0.74 0.69*0.79<br />
2 Laboratory assistants 4 0.63 3 0.64 [0.38] 0.00 4 0.61 [2.68] 0.00 11 0.53 0.27*0.96<br />
3 Physicians 17 0.66 4 0.37 1 1.29 13 0.76 12 0.47 47 0.59 0.43*0.78<br />
4 Dentists 8 1.04 [2.28] 0.00 [0.22] 0.00 4 0.52 14 1.09 26 0.85 0.55*1.24<br />
5 Nurses [0.38] 0.00 [0.51] 0.00 [0.01] 0.00 [0.78] 0.00 [1.22] 0.00 [2.89] 0.00 0.00*1.28<br />
6 Assistant nurses 6 0.78 [0.47] 0.00 [0.09] 0.00 1 0.34 14 1.57 21 1.04 0.65*1.60<br />
7 ‘‘Other health workers’’ 13 0.58 10 0.91 [0.21] 0.00 7 1.05 22 1.01 52 0.84 0.63*1.10<br />
8 Teachers 75 0.53 32 0.41 1 0.35 46 0.48 99 0.68 253 0.55 0.48*0.62<br />
9 Religious workers etc 47 0.83 27 0.63 1 0.53 31 0.64 78 0.70 184 0.70 0.61*0.81<br />
10 Artistic workers 17 0.97 19 1.22 [0.52] 0.00 16 1.10 40 1.14 92 1.11 0.89*1.36<br />
11 Journalists 10 1.18 9 1.16 2 6.53 3 0.47 26 1.59 50 1.27 0.95*1.68<br />
12 Administrators 323 0.92 108 0.88 6 1.28 156 0.91 254 1.14 847 0.97 0.91*1.04<br />
13 Clerical workers 131 0.85 61 0.74 5 0.96 115 0.87 261 1.08 573 0.93 0.86*1.01<br />
14 Sales agents 93 1.14 118 1.00 7 2.58 193 1.28 428 1.22 839 1.19 1.12*1.28<br />
15 Shop workers 344 0.99 49 1.01 5 2.67 52 0.86 130 1.16 580 1.02 0.94*1.10<br />
16 Farmers 252 0.38 413 0.69 1 0.14 148 0.37 238 0.39 1 052 0.46 0.44*0.49<br />
17 Gardeners 52 0.56 55 0.67 [0.24] 0.00 56 0.54 128 0.57 291 0.58 0.51*0.65<br />
18 Fishermen 52 1.61 5 0.65 6 1.18 160 1.21 18 0.75 241 1.20 1.05*1.36<br />
19 Forestry workers 11 0.81 119 1.21 [0.04] 0.00 36 0.48 89 0.54 255 0.73 0.64*0.82<br />
20 Miners <strong>and</strong> quarry workers 4 0.96 16 1.00 [0.08] 0.00 24 1.09 36 0.88 80 0.96 0.76*1.20<br />
21 Seamen 62 1.75 30 1.47 4 3.06 196 1.75 86 2.41 378 1.85 1.67*2.04<br />
22 Transport workers 85 1.10 49 0.80 [2.50] 0.00 65 1.12 114 0.96 313 0.98 0.88*1.10<br />
23 Drivers 346 1.39 233 1.21 4 1.05 244 1.51 399 1.37 1 226 1.37 1.29*1.45<br />
24 Postal workers 48 0.96 33 1.12 [0.44] 0.00 26 0.87 65 1.02 172 0.99 0.85*1.15<br />
25 Textile workers 47 1.10 25 1.27 1 1.35 30 0.91 79 1.09 182 1.08 0.94*1.25<br />
26 Shoe <strong>and</strong> leather workers 11 1.06 15 1.71 [0.15] 0.00 18 1.30 43 1.49 87 1.40 1.12*1.73<br />
27 Smelting workers 130 1.32 40 1.32 1 0.90 60 1.33 143 1.24 374 1.29 1.17*1.43<br />
28 Mechanics 285 1.08 213 1.12 2 0.54 268 1.20 588 1.11 1 356 1.12 1.06*1.18<br />
29 Plumbers 21 0.89 26 0.82 1 1.71 28 1.07 73 1.20 149 1.04 0.89*1.22<br />
30 Welders 42 1.43 [0.22] 0.00 28 0.94 76 1.11 146 1.14 0.97*1.34<br />
31 Electrical workers 82 1.29 75 0.94 1 0.45 109 1.10 210 1.17 477 1.13 1.03*1.23<br />
32 Wood workers 170 0.94 200 0.95 2 0.99 193 0.77 254 0.72 819 0.82 0.77*0.88<br />
33 Painters 70 1.18 54 1.23 1 1.22 58 1.37 120 1.17 303 1.22 1.09*1.36<br />
34 ‘‘Other construction workers’’ 256 1.16 201 1.43 5 1.18 64 1.26 225 1.16 751 1.23 1.15*1.32<br />
35 Bricklayers 75 1.16 19 0.86 29 1.15 44 0.95 167 1.05 0.90*1.23<br />
36 Printers 44 1.05 25 1.33 [0.69] 0.00 29 1.12 75 1.36 173 1.21 1.04*1.41<br />
37 Chemical process workers 58 1.53 42 1.29 [0.36] 0.00 72 1.28 75 0.87 247 1.16 1.02*1.31<br />
38 Food workers 166 1.34 25 1.07 6 1.99 86 1.34 96 1.11 379 1.26 1.14*1.39<br />
39 Beverage workers 43 2.89 3 1.91 [0.05] 0.00 2 2.64 11 2.20 59 2.65 2.02*3.42<br />
40 Tobacco workers 2 0.85 [0.26] 0.00 [0.00] 0.00 2 2.03 [0.39] 0.00 4 1.00 0.27*2.57<br />
41 Glass makers etc 81 1.12 37 1.08 1 1.80 40 1.26 125 1.32 284 1.22 1.08*1.37<br />
42 Packers 87 1.37 94 1.29 [1.74] 0.00 140 1.45 215 1.24 536 1.32 1.21*1.43<br />
43 Engine operators 80 1.20 116 1.23 2 0.79 65 1.15 172 1.21 435 1.20 1.09*1.32<br />
44 Public safety workers 60 0.98 45 0.81 [1.74] 0.00 55 1.34 73 0.89 233 0.97 0.85*1.10<br />
45 Cooks <strong>and</strong> stewards 14 2.88 7 2.20 1 1.14 47 2.51 27 1.84 96 2.27 1.84*2.77<br />
46 Domestic assistants [0.05] 0.00 [0.19] 0.00 [0.00] 0.00 1 6.52 [1.10] 0.00 1 0.67 0.02*3.73<br />
47 Waiters 59 5.91 4 1.29 [0.09] 0.00 23 2.86 16 2.05 102 3.52 2.90*4.27<br />
48 Building caretakers 86 1.34 54 1.13 [0.68] 0.00 40 1.90 75 1.14 255 1.28 1.13*1.45<br />
49 Chimney sweeps 2 1.16 4 1.09 [2.19] 0.00 7 1.46 13 1.05 0.56*1.80<br />
50 Hairdressers 13 0.71 1 0.99 [0.13] 0.00 12 1.94 40 2.35 66 1.55 1.20*1.97<br />
51 Launderers 4 0.44 1 1.01 [0.07] 0.00 5 1.35 15 1.23 25 0.96 0.62*1.42<br />
52 Military personnel 31 0.91 13 0.78 33 0.91 53 1.10 130 0.96 0.81*1.14<br />
53 ‘‘Other workers’’ 318 1.61 77 1.33 10 1.45 200 1.12 230 1.10 835 1.28 1.20*1.37<br />
54 Economically inactive 226 1.32 516 1.50 7 1.40 125 1.40 448 1.41 1 322 1.42 1.35*1.50<br />
1 54 All categories 4 787 1.00 3 462 1.00 85 1.00 3 529 1.00 6 625 1.00 18 488 1.00 Ref.<br />
Obs observed number of cases; SIR st<strong>and</strong>ardised incidence ratio; 95% CI 95% confidence interval.<br />
<strong>Occupation</strong> <strong>and</strong> <strong>cancer</strong> in Nordic countries 697
Acta Oncol Downloaded from informahealthcare.com by 212.35.100.66 on 04/06/11<br />
For personal use only.<br />
698 E. Pukkala et al.<br />
Table 33. Observed number of laryngeal <strong>cancer</strong> among women in the Nordic countries <strong>and</strong> st<strong>and</strong>ardised incidence ratios 1961 2005, by<br />
country <strong>and</strong> occupational category.<br />
Denmark Finl<strong>and</strong> Icel<strong>and</strong> Norway Sweden Total<br />
No <strong>Occupation</strong>al category Obs SIR Obs SIR Obs SIR Obs SIR Obs SIR Obs SIR 95% CI<br />
1 Technical workers, etc 5 1.50 [1.62] 0.00 [0.05] 0.00 [0.68] 0.00 4 0.98 9 0.92 0.42*1.75<br />
2 Laboratory assistants 2 0.79 1 1.01 [0.09] 0.00 [0.82] 0.00 2 1.67 5 0.89 0.29*2.07<br />
3 Physicians 1 0.91 [0.39] 0.00 [0.01] 0.00 [0.32] 0.00 [0.97] 0.00 1 0.36 0.01*2.00<br />
4 Dentists [0.96] 0.00 1 2.21 [0.01] 0.00 [0.27] 0.00 1 1.41 2 0.83 0.10*3.01<br />
5 Nurses 8 0.42 [4.98] 0.00 [0.40] 0.00 3 0.46 2 0.17 13 0.30 0.16*0.52<br />
6 Assistant nurses 13 0.89 1 0.19 1 2.12 2 0.30 24 1.09 41 0.84 0.60*1.13<br />
7 ‘‘Other health workers’’ 9 0.83 [4.07] 0.00 [0.12] 0.00 8 1.24 10 1.37 27 0.94 0.62*1.36<br />
8 Teachers 8 0.32 3 0.32 [0.70] 0.00 6 0.50 17 0.62 34 0.46 0.32*0.64<br />
9 Religious workers etc 3 0.91 4 0.98 [0.10] 0.00 [3.01] 0.00 3 0.33 10 0.51 0.25*0.95<br />
10 Artistic workers 2 1.27 1 1.39 [0.09] 0.00 1 1.13 2 1.13 6 1.19 0.44*2.60<br />
11 Journalists 1 2.74 [0.48] 0.00 [0.02] 0.00 [0.25] 0.00 [0.83] 0.00 1 0.51 0.01*2.87<br />
12 Administrators 15 1.55 [1.56] 0.00 [0.07] 0.00 2 0.70 6 1.56 23 1.28 0.81*1.92<br />
13 Clerical workers 94 0.92 35 1.16 2 0.98 47 1.21 65 0.94 243 1.00 0.89*1.14<br />
14 Sales agents 1 1.13 3 0.67 [0.21] 0.00 1 0.21 14 1.61 19 0.99 0.60*1.55<br />
15 Shop workers 56 0.85 8 0.47 1 0.79 30 0.95 42 1.04 137 0.88 0.74*1.04<br />
16 Farmers 15 0.32 7 0.68 3 3.43 8 0.41 2 0.61 35 0.43 0.30*0.60<br />
17 Gardeners 5 0.83 19 0.60 [0.03] 0.00 5 0.42 5 0.47 34 0.56 0.39*0.79<br />
18 Fishermen 1 4.09 [0.07] 0.00 [0.04] 0.00 [0.17] 0.00 [0.03] 0.00 1 1.83 0.05*10.18<br />
19 Forestry workers [0.07] 0.00 [0.13] 0.00 [0.00] 0.00 [0.24] 0.00 [0.23] 0.00 [0.67] 0.00 0.00*5.50<br />
20 Miners <strong>and</strong> quarry workers [0.00] 0.00 [0.06] 0.00 [0.00] 0.00 [0.01] 0.00 [0.06] 0.00 [0.13] 0.00 0.00*27.37<br />
21 Seamen [0.01] 0.00 [0.04] 0.00 [0.01] 0.00 [0.06] 0.00 0.00*62.94<br />
22 Transport workers [0.07] 0.00 2 2.29 [0.03] 0.00 [0.18] 0.00 3 4.66 5 2.79 0.90*6.50<br />
23 Drivers 3 1.73 [0.37] 0.00 [0.02] 0.00 [0.64] 0.00 6 3.48 9 2.00 0.92*3.80<br />
24 Postal workers 2 0.57 2 0.39 [0.44] 0.00 7 0.94 10 0.84 21 0.74 0.46*1.13<br />
25 Textile workers 19 0.85 7 0.61 [0.63] 0.00 8 0.75 18 0.82 52 0.77 0.58*1.01<br />
26 Shoe <strong>and</strong> leather workers 1 0.59 3 2.07 [0.03] 0.00 [0.78] 0.00 4 2.33 8 1.41 0.61*2.78<br />
27 Smelting workers [0.41] 0.00 1 2.88 [0.00] 0.00 1 9.54 [0.54] 0.00 2 1.42 0.17*5.14<br />
28 Mechanics 8 1.87 5 3.34 1 95.06 4 3.93 9 1.74 27 2.25 1.48*3.28<br />
29 Plumbers [0.03] 0.00 [0.00] 0.00 [0.01] 0.00 [0.01] 0.00 [0.05] 0.00 0.00*77.74<br />
30 Welders 1 8.65 [0.00] 0.00 [0.08] 0.00 1 4.86 2 4.93 0.60*17.81<br />
31 Electrical workers 12 2.02 3 3.31 [0.01] 0.00 2 1.78 4 1.38 21 1.93 1.19*2.95<br />
32 Wood workers 1 0.52 3 0.99 [0.01] 0.00 1 2.58 2 2.31 7 1.12 0.45*2.31<br />
33 Painters [0.07] 0.00 [0.35] 0.00 [0.00] 0.00 1 11.65 1 4.42 2 2.70 0.33*9.75<br />
34 ‘‘Other construction workers’’ [0.05] 0.00 10 8.09 [0.00] 0.00 [0.03] 0.00 [0.03] 0.00 10 7.39 3.54*13.58<br />
35 Bricklayers [0.01] 0.00 [0.04] 0.00 [0.00] 0.00 [0.00] 0.00 [0.05] 0.00 0.00*69.36<br />
36 Printers 3 1.40 3 2.08 [0.06] 0.00 4 4.19 4 1.91 14 2.09 1.14*3.51<br />
37 Chemical process workers 2 0.60 [0.77] 0.00 [0.03] 0.00 2 2.33 2 1.23 6 0.91 0.33*1.97<br />
38 Food workers 30 1.82 3 0.76 2 1.40 5 0.93 6 1.30 46 1.44 1.06*1.92<br />
39 Beverage workers 5 3.27 [0.22] 0.00 [0.00] 0.00 [0.05] 0.00 [0.28] 0.00 5 2.39 0.78*5.58<br />
40 Tobacco workers 5 2.35 [0.13] 0.00 [0.18] 0.00 [0.20] 0.00 5 1.89 0.62*4.42<br />
41 Glass makers etc 6 1.45 3 1.09 [0.04] 0.00 2 1.06 7 1.57 18 1.36 0.80*2.14<br />
42 Packers 1 0.85 6 1.22 [0.13] 0.00 5 1.11 5 0.78 17 0.99 0.58*1.59<br />
43 Engine operators [0.04] 0.00 4 4.97 [0.00] 0.00 [0.07] 0.00 [0.48] 0.00 4 2.87 0.78*7.35<br />
44 Public safety workers [0.11] 0.00 1 5.84 [0.02] 0.00 [0.54] 0.00 4 7.33 5 3.61 1.17*8.42<br />
45 Cooks <strong>and</strong> stewards [0.04] 0.00 4 0.75 [0.47] 0.00 12 2.08 16 1.88 32 1.59 1.09*2.24<br />
46 Domestic assistants 32 1.28 5 0.92 [0.13] 0.00 12 0.76 21 0.87 70 0.99 0.77*1.25<br />
47 Waiters 19 4.33 8 1.75 [0.05] 0.00 10 1.49 18 1.92 55 2.19 1.65*2.85<br />
48 Building caretakers 101 1.40 27 1.43 1 0.99 40 1.36 46 1.86 215 1.47 1.29*1.68<br />
49 Chimney sweeps [0.00] 0.00 [0.01] 0.00 [0.00] 0.00 [0.00] 0.00 [0.02] 0.00 0.00*183.92<br />
50 Hairdressers 2 0.46 9 5.30 [0.06] 0.00 4 2.31 6 1.40 21 1.74 1.07*2.65<br />
51 Launderers 7 0.87 5 3.25 1 7.50 4 1.69 5 1.08 22 1.31 0.82*1.99<br />
52 Military personnel [0.04] 0.00 [0.02] 0.00 [0.01] 0.00 [0.02] 0.00 [0.09] 0.00 0.00*43.20<br />
53 ‘‘Other workers’’ 38 1.86 5 0.88 [1.07] 0.00 23 1.52 15 1.33 81 1.51 1.20*1.88<br />
54 Economically inactive 486 0.97 134 1.08 4 1.11 169 1.01 462 0.93 1 255 0.97 0.92*1.03<br />
1 54 All categories 1 022 1.00 337 1.00 16 1.00 429 1.00 874 1.00 2 678 1.00 Ref.<br />
Obs observed number of cases; SIR st<strong>and</strong>ardised incidence ratio; 95% CI 95% confidence interval.
Acta Oncol Downloaded from informahealthcare.com by 212.35.100.66 on 04/06/11<br />
For personal use only.<br />
electrical workers, hairdressers, cooks <strong>and</strong> stewards,<br />
building caretakers <strong>and</strong> cleaners <strong>and</strong> food workers<br />
were at elevated risk (Table 33). Low risks were seen<br />
among nurses (0.30, 0.16 0.52), farmers, teachers,<br />
religious workers, <strong>and</strong> gardeners.<br />
Comment. The separate <strong>and</strong> joint effects of tobacco<br />
<strong>and</strong> alcohol account for the major proportion of<br />
larynx <strong>cancer</strong> cases [81]. <strong>Occupation</strong>al factors<br />
related to risk include exposure to sulphur acid<br />
mist <strong>and</strong> asbestos, <strong>and</strong> possibly to solvents <strong>and</strong><br />
wood dust. Most of the variation in risk across<br />
occupations can probably be explained by smoking<br />
<strong>and</strong> drinking habits.<br />
Lung <strong>cancer</strong><br />
Lung <strong>cancer</strong> was the second most frequent <strong>cancer</strong> in<br />
men in the present study <strong>and</strong> number four among<br />
women. The lung <strong>cancer</strong> incidence among men<br />
reached its peak in the early 1970s in Finl<strong>and</strong> <strong>and</strong><br />
then began to fall (Figure 27). The peak came later<br />
in the other countries. The rates have been much<br />
lower in women but are increasing.<br />
The highest SIRs in men were observed among<br />
waiters (SIR 1.90, 95% CI 1.75 2.05), tobacco<br />
manufacture workers, seamen, miners <strong>and</strong> quarry<br />
workers, cooks <strong>and</strong> stewards, chimney sweeps,<br />
plumbers <strong>and</strong> beverage manufacture workers. The<br />
SIRs were lowest among male nurses (0.40, 0.19<br />
0.73), teachers, dentists, physicians, farmers, religious<br />
workers <strong>and</strong> gardeners (Table 34).<br />
Among women the highest SIRs were found<br />
among engine operators (2.61, 2.19 3.11), tobacco<br />
workers, <strong>and</strong> ‘‘other construction workers’’. Painters,<br />
waiters, beverage workers, transport workers, electrical<br />
workers, printers, welders, mechanics, packers,<br />
/ 100 000<br />
80<br />
60<br />
40<br />
20<br />
0<br />
Denmark<br />
Finl<strong>and</strong><br />
Icel<strong>and</strong><br />
Norway<br />
Sweden<br />
Men<br />
1945 1960 1975 1990 2005<br />
/ 100 000<br />
chemical process workers, drivers <strong>and</strong> glass makers<br />
also had significant SIRs above 1.4. The lowest<br />
SIRs among women were found among farmers<br />
(0.46, 0.44 0.49), followed by gardeners <strong>and</strong><br />
teachers (Table 35).<br />
The occupational SIR patterns were similar for<br />
adenocarcinoma, squamous cell carcinoma, small<br />
cell carcinoma <strong>and</strong> other <strong>and</strong> unspecified types<br />
of lung <strong>cancer</strong> (Table 36).<br />
Comment. Although tobacco smoking is the main<br />
cause of lung <strong>cancer</strong>, the attributable fraction of<br />
occupational exposures is estimated to up to 20%<br />
[82,83]. Some occupational exposures act in concert<br />
with smoking to synergistically increase risk<br />
[84 86]. The International Agency for Research on<br />
Cancer has listed a wide range of occupational lung<br />
carcinogens [87].<br />
Throughout our study period there has been an<br />
invert social gradient in smoking, so that those with<br />
higher education <strong>and</strong> in higher socio-economic<br />
positions quit smoking, while those in manual work<br />
<strong>and</strong> with a lower education continued or started<br />
smoking [6,88 90]. In the present study, the occupational<br />
categories with high SIRs are all manual<br />
workers with low education likely to smoke more<br />
than others.<br />
Much of the observed variation in risk can be<br />
explained by smoking habits. Tobacco workers are<br />
known to have had easy access to tobacco. Waiters<br />
have until recently been heavily exposed to passive<br />
smoking in addition to their own smoking. Many<br />
of the high SIR occupations are also likely to be<br />
exposed to various known or suspected occupational<br />
carcinogens [82]. Miners <strong>and</strong> quarry workers may be<br />
exposed to radon, silica dust, diesel exhaust, <strong>and</strong><br />
asbestos; plumbers to asbestos; smelting workers<br />
80<br />
60<br />
40<br />
20<br />
0<br />
<strong>Occupation</strong> <strong>and</strong> <strong>cancer</strong> in Nordic countries 699<br />
Denmark<br />
Finl<strong>and</strong><br />
Icel<strong>and</strong><br />
Norway<br />
Sweden<br />
Women<br />
1945 1960 1975 1990 2005<br />
Figure 27. Age st<strong>and</strong>ardised (World) incidence rates for lung <strong>cancer</strong> 1943 2005, by country <strong>and</strong> gender. Modified from NORDCAN [49].
Acta Oncol Downloaded from informahealthcare.com by 212.35.100.66 on 04/06/11<br />
For personal use only.<br />
700 E. Pukkala et al.<br />
Table 34. Observed number of lung <strong>cancer</strong> among men in the Nordic countries <strong>and</strong> st<strong>and</strong>ardised incidence ratios 1961 2005, by country<br />
<strong>and</strong> occupational category.<br />
Denmark Finl<strong>and</strong> Icel<strong>and</strong> Norway Sweden Total<br />
No <strong>Occupation</strong>al category Obs SIR Obs SIR Obs SIR Obs SIR Obs SIR Obs SIR 95% CI<br />
1 Technical workers, etc 3 019 0.91 1 503 0.58 9 0.41 855 0.61 5 154 0.93 10 540 0.82 0.80*0.83<br />
2 Laboratory assistants 70 1.04 55 0.89 3 0.71 51 0.75 17 0.70 196 0.87 0.75*1.00<br />
3 Physicians 144 0.53 45 0.30 6 0.67 82 0.46 178 0.73 455 0.53 0.49*0.58<br />
4 Dentists 36 0.46 9 0.27 [2.08] 0.00 55 0.68 59 0.47 159 0.50 0.43*0.58<br />
5 Nurses [3.48] 0.00 1 0.20 1 23.30 4 0.56 4 0.42 10 0.40 0.19*0.73<br />
6 Assistant nurses 61 0.78 1 0.25 [0.97] 0.00 24 0.76 84 1.01 170 0.86 0.74*1.00<br />
7 ‘‘Other health workers’’ 210 0.87 93 0.59 1 0.41 62 0.90 199 0.95 565 0.83 0.76*0.90<br />
8 Teachers 769 0.54 371 0.33 17 0.52 428 0.43 834 0.59 2419 0.49 0.47*0.51<br />
9 Religious workers etc 377 0.61 296 0.51 22 1.03 253 0.50 783 0.75 1731 0.62 0.60*0.65<br />
10 Artistic workers 160 0.82 142 0.65 8 1.36 146 0.95 391 1.16 847 0.93 0.87*1.00<br />
11 Journalists 85 0.94 76 0.69 6 1.80 59 0.89 169 1.08 395 0.93 0.84*1.02<br />
12 Administrators 3 415 0.90 1 000 0.56 49 0.86 1 523 0.84 1 992 0.92 7979 0.83 0.81*0.85<br />
13 Clerical workers 1 412 0.85 936 0.75 64 1.00 1 177 0.84 2 432 1.04 6 021 0.90 0.88*0.92<br />
14 Sales agents 855 0.98 1 365 0.80 44 1.35 1 604 1.01 3 796 1.12 7 664 1.01 0.99*1.03<br />
15 Shop workers 3 803 0.98 518 0.78 20 0.90 598 0.95 1 204 1.10 6 143 0.98 0.95*1.00<br />
16 Farmers 3 465 0.47 7 611 0.77 49 0.52 1 995 0.46 2 417 0.40 15 537 0.56 0.55*0.57<br />
17 Gardeners 808 0.77 1 056 0.84 4 1.36 637 0.57 1 361 0.61 3866 0.68 0.66*0.71<br />
18 Fishermen 461 1.29 127 1.02 78 1.52 1 654 1.17 227 0.96 2 547 1.16 1.12*1.21<br />
19 Forestry workers 139 0.88 2 074 1.41 [0.47] 0.00 486 0.60 878 0.54 3577 0.88 0.85*0.91<br />
20 Miners <strong>and</strong> quarry workers 48 0.97 450 1.93 1 1.18 325 1.40 621 1.57 1445 1.58 1.50*1.67<br />
21 Seamen 547 1.43 353 1.19 23 1.57 2 036 1.74 624 1.82 3583 1.62 1.57*1.68<br />
22 Transport workers 896 1.07 729 0.78 37 1.22 601 0.97 1 201 1.03 3 464 0.96 0.93*1.00<br />
23 Drivers 3 762 1.37 2 897 1.05 46 1.07 2 415 1.44 3 762 1.34 12 882 1.28 1.26*1.31<br />
24 Postal workers 536 1.05 312 0.72 4 0.70 278 0.88 653 1.06 1 783 0.95 0.90*0.99<br />
25 Textile workers 527 1.07 291 0.95 6 0.62 309 0.87 721 1.02 1 854 0.99 0.94*1.04<br />
26 Shoe <strong>and</strong> leather workers 133 1.08 148 1.07 5 2.34 159 1.07 297 1.04 742 1.06 0.99*1.14<br />
27 Smelting workers 1 488 1.38 586 1.28 16 1.18 715 1.50 1 422 1.27 4227 1.34 1.30*1.38<br />
28 Mechanics 3 595 1.24 2 979 1.10 43 1.07 3 123 1.34 6 463 1.27 16 203 1.24 1.22*1.26<br />
29 Plumbers 399 1.55 591 1.33 8 1.20 420 1.55 807 1.37 2225 1.42 1.36*1.48<br />
30 Welders 443 1.17 2 0.83 444 1.44 909 1.38 1798 1.33 1.27*1.40<br />
31 Electrical workers 777 1.15 1 055 0.96 26 1.09 1 072 1.04 1 780 1.03 4 710 1.03 1.00*1.06<br />
32 Wood workers 2 085 1.05 3 801 1.16 17 0.71 2 370 0.88 2 668 0.77 10 941 0.96 0.94*0.97<br />
33 Painters 858 1.30 792 1.21 8 0.81 593 1.32 1 167 1.17 3418 1.23 1.19*1.28<br />
34 ‘‘Other construction workers’’ 3 075 1.19 3 402 1.59 45 0.96 741 1.40 2 217 1.18 9480 1.32 1.29*1.35<br />
35 Bricklayers 899 1.24 477 1.40 344 1.28 513 1.13 2233 1.25 1.20*1.30<br />
36 Printers 545 1.20 236 0.91 9 1.16 325 1.21 711 1.33 1826 1.20 1.14*1.26<br />
37 Chemical process workers 534 1.21 522 1.11 6 1.34 786 1.32 857 1.02 2 705 1.15 1.11*1.19<br />
38 Food workers 1 700 1.22 342 1.00 45 1.18 861 1.26 1 000 1.18 3948 1.19 1.16*1.23<br />
39 Beverage workers 275 1.54 19 0.78 2 3.31 7 0.98 65 1.33 368 1.42 1.28*1.57<br />
40 Tobacco workers 51 1.76 8 2.07 [0.05] 0.00 18 1.74 7 1.87 84 1.79 1.43*2.21<br />
41 Glass makers etc 1 007 1.21 537 1.08 7 1.06 470 1.42 1 034 1.12 3055 1.18 1.14*1.22<br />
42 Packers 883 1.18 1 390 1.28 21 0.96 1 449 1.42 2 170 1.29 5913 1.30 1.26*1.33<br />
43 Engine operators 815 1.11 1 501 1.13 25 0.89 828 1.43 1 679 1.22 4848 1.20 1.17*1.23<br />
44 Public safety workers 686 1.02 688 0.85 16 0.78 476 1.09 787 1.00 2 653 0.97 0.93*1.01<br />
45 Cooks <strong>and</strong> stewards 89 1.64 41 0.99 17 1.81 292 1.51 240 1.74 679 1.56 1.44*1.68<br />
46 Domestic assistants 1 1.74 [3.29] 0.00 [0.03] 0.00 3 1.93 6 0.64 10 0.68 0.32*1.24<br />
47 Waiters 248 2.03 40 1.04 1 1.04 145 1.73 169 2.32 603 1.90 1.75*2.05<br />
48 Building caretakers 978 1.30 738 1.01 10 1.05 317 1.45 752 1.18 2795 1.19 1.15*1.24<br />
49 Chimney sweeps 30 1.58 62 1.14 41 1.77 79 1.71 212 1.49 1.30*1.70<br />
50 Hairdressers 241 1.14 12 0.79 2 1.48 87 1.33 218 1.32 560 1.22 1.12*1.33<br />
51 Launderers 121 1.18 15 1.04 [0.92] 0.00 59 1.50 158 1.33 353 1.28 1.15*1.42<br />
52 Military personnel 292 0.87 137 0.63 372 0.97 494 1.06 1 295 0.92 0.88*0.98<br />
53 ‘‘Other workers’’ 2 981 1.29 1 121 1.29 97 1.15 2 128 1.12 2 186 1.07 8513 1.18 1.16*1.21<br />
54 Economically inactive 3 010 1.19 8 195 1.47 70 1.19 1 032 1.15 3 761 1.23 16 068 1.33 1.31*1.35<br />
1 54 All categories 53 401 1.00 52 189 1.00 996 1.00 37 334 1.00 64 377 1.00 208 297 1.00 Ref.<br />
Obs observed number of cases; SIR st<strong>and</strong>ardised incidence ratio; 95% CI 95% confidence interval.
Acta Oncol Downloaded from informahealthcare.com by 212.35.100.66 on 04/06/11<br />
For personal use only.<br />
Table 35. Observed number of lung <strong>cancer</strong> among women in the Nordic countries <strong>and</strong> st<strong>and</strong>ardised incidence ratios 1961 2005, by<br />
country <strong>and</strong> occupational category.<br />
Denmark Finl<strong>and</strong> Icel<strong>and</strong> Norway Sweden Total<br />
No <strong>Occupation</strong>al category Obs SIR Obs SIR Obs SIR Obs SIR Obs SIR Obs SIR 95% CI<br />
1 Technical workers, etc 91 1.06 51 0.91 1 0.42 26 1.05 145 0.96 314 0.98 0.88*1.10<br />
2 Laboratory assistants 60 0.91 36 1.09 5 1.38 24 0.82 37 0.71 162 0.88 0.76*1.03<br />
3 Physicians 24 0.86 13 0.97 [0.65] 0.00 5 0.45 20 0.54 62 0.68 0.52*0.88<br />
4 Dentists 11 0.45 10 0.63 [0.27] 0.00 5 0.54 20 0.78 46 0.61 0.45*0.81<br />
5 Nurses 351 0.72 121 0.73 10 0.56 143 0.60 306 0.70 931 0.69 0.65*0.74<br />
6 Assistant nurses 447 1.19 163 0.91 17 0.69 241 0.99 814 1.00 1 682 1.03 0.98*1.08<br />
7 ‘‘Other health workers’’ 185 0.67 108 0.78 [4.99] 0.00 189 0.83 243 0.88 725 0.79 0.73*0.84<br />
8 Teachers 373 0.59 186 0.59 12 0.39 215 0.51 559 0.55 1 345 0.55 0.53*0.58<br />
9 Religious workers etc 48 0.57 92 0.66 2 0.43 70 0.65 292 0.84 504 0.74 0.68*0.81<br />
10 Artistic workers 28 0.70 26 1.07 3 0.77 27 0.88 81 1.25 165 1.01 0.87*1.17<br />
11 Journalists 11 1.14 33 2.06 1 1.01 8 0.91 38 1.23 91 1.37 1.10*1.68<br />
12 Administrators 285 1.16 71 1.35 3 0.91 88 0.91 134 0.94 581 1.07 0.99*1.16<br />
13 Clerical workers 2 652 1.01 1 255 1.25 79 0.82 1 427 1.04 2 964 1.18 8 377 1.10 1.08*1.13<br />
14 Sales agents 19 0.85 191 1.26 10 0.93 180 1.17 368 1.22 768 1.20 1.12*1.29<br />
15 Shop workers 1 776 1.06 603 1.07 75 1.19 1 169 1.07 1 617 1.19 5 240 1.10 1.07*1.13<br />
16 Farmers 516 0.44 192 0.54 20 0.42 301 0.47 60 0.51 1 089 0.46 0.44*0.49<br />
17 Gardeners 105 0.69 544 0.52 3 1.91 183 0.46 233 0.67 1 068 0.54 0.51*0.58<br />
18 Fishermen 7 1.13 2 0.90 1 0.63 4 0.68 1 0.89 15 0.89 0.50*1.46<br />
19 Forestry workers 2 1.21 4 0.94 1 4.60 7 0.83 10 1.23 24 1.06 0.68*1.57<br />
20 Miners <strong>and</strong> quarry workers [0.11] 0.00 1 0.54 [0.04] 0.00 2 4.25 [2.16] 0.00 3 0.65 0.13*1.89<br />
21 Seamen 1 2.15 [0.00] 0.00 [1.37] 0.00 [0.28] 0.00 1 0.47 0.01*2.63<br />
22 Transport workers 6 3.53 60 2.08 2 1.18 12 1.89 34 1.52 114 1.87 1.56*2.25<br />
23 Drivers 54 1.21 20 1.60 1 1.31 23 1.03 112 1.75 210 1.46 1.27*1.67<br />
24 Postal workers 85 0.96 172 1.00 18 0.82 238 0.94 449 1.08 962 1.01 0.95*1.08<br />
25 Textile workers 759 1.32 361 0.94 31 0.79 397 1.14 791 1.12 2 339 1.14 1.09*1.19<br />
26 Shoe <strong>and</strong> leather workers 53 1.22 43 0.89 1 0.49 25 0.98 69 1.25 191 1.09 0.95*1.26<br />
27 Smelting workers 21 1.96 14 1.23 [0.10] 0.00 5 1.31 22 1.14 62 1.37 1.05*1.75<br />
28 Mechanics 189 1.70 82 1.67 [0.39] 0.00 62 1.77 272 1.49 605 1.60 1.48*1.73<br />
29 Plumbers 1 1.45 [0.11] 0.00 [0.30] 0.00 2 6.17 3 2.10 0.43*6.14<br />
30 Welders 5 1.35 [0.02] 0.00 5 1.64 15 1.89 25 1.70 1.10*2.51<br />
31 Electrical workers 289 1.86 57 1.89 1 3.09 77 1.96 164 1.60 588 1.79 1.66*1.95<br />
32 Wood workers 74 1.48 103 1.03 1 1.58 20 1.45 37 1.18 235 1.20 1.06*1.36<br />
33 Painters 3 1.60 20 1.72 [0.17] 0.00 9 2.96 15 1.88 47 1.90 1.40*2.53<br />
34 ‘‘Other construction workers’’ 3 2.12 88 2.17 [0.10] 0.00 1 0.85 4 3.42 96 2.17 1.75*2.65<br />
35 Bricklayers [0.27] 0.00 1 0.76 [0.08] 0.00 [0.04] 0.00 1 0.59 0.01*3.27<br />
36 Printers 74 1.33 72 1.49 8 2.46 54 1.69 153 2.12 361 1.71 1.54*1.90<br />
37 Chemical process workers 153 1.77 20 0.79 2 1.33 41 1.42 75 1.36 291 1.48 1.32*1.66<br />
38 Food workers 529 1.25 158 1.19 120 1.51 227 1.27 213 1.41 1 247 1.29 1.22*1.37<br />
39 Beverage workers 82 2.05 10 1.33 [0.21] 0.00 3 1.65 15 1.65 110 1.88 1.56*2.26<br />
40 Tobacco workers 128 2.30 6 1.42 23 4.10 12 1.74 169 2.33 2.01*2.71<br />
41 Glass makers etc 161 1.50 115 1.26 3 1.44 102 1.58 224 1.48 605 1.45 1.34*1.57<br />
42 Packers 48 1.59 230 1.41 10 1.27 238 1.56 331 1.53 857 1.50 1.41*1.61<br />
43 Engine operators 5 4.61 68 2.61 1 9.61 7 2.74 44 2.43 125 2.61 2.19*3.11<br />
44 Public safety workers 1 0.35 8 1.38 1 0.67 22 1.21 29 1.37 61 1.23 0.94*1.58<br />
45 Cooks <strong>and</strong> stewards 1 0.94 191 1.06 24 0.81 199 1.07 346 1.25 761 1.13 1.05*1.21<br />
46 Domestic assistants 709 1.11 153 0.84 6 0.68 465 0.90 923 1.08 2 256 1.02 0.98*1.07<br />
47 Waiters 276 2.40 320 2.12 7 2.08 396 1.74 525 1.71 1 524 1.89 1.80*1.99<br />
48 Building caretakers 2 319 1.26 818 1.31 68 1.12 1 262 1.25 1 190 1.41 5 657 1.29 1.26*1.32<br />
49 Chimney sweeps [0.11] 0.00 [0.32] 0.00 [0.15] 0.00 [0.03] 0.00 [0.61] 0.00 0.00*6.06<br />
50 Hairdressers 105 0.94 81 1.43 1 0.33 86 1.46 223 1.48 496 1.30 1.19*1.42<br />
51 Launderers 269 1.31 58 1.13 13 1.33 89 1.15 183 1.24 612 1.25 1.15*1.35<br />
52 Military personnel [1.07] 0.00 [0.51] 0.00 1 2.93 [0.79] 0.00 1 0.37 0.01*2.06<br />
53 ‘‘Other workers’’ 719 1.37 230 1.21 61 1.01 528 1.02 540 1.40 2 078 1.23 1.18*1.29<br />
54 Economically inactive 12 141 0.94 4 032 0.97 244 1.17 5 086 1.01 14 458 0.90 35 961 0.94 0.93*0.95<br />
1 54 All categories 26 248 1.00 11 299 1.00 867 1.00 14 017 1.00 29 412 1.00 81 843 1.00 Ref.<br />
Obs observed number of cases; SIR st<strong>and</strong>ardised incidence ratio; 95% CI 95% confidence interval.<br />
<strong>Occupation</strong> <strong>and</strong> <strong>cancer</strong> in Nordic countries 701
Acta Oncol Downloaded from informahealthcare.com by 212.35.100.66 on 04/06/11<br />
For personal use only.<br />
702 E. Pukkala et al.<br />
Table 36. St<strong>and</strong>ardised incidence ratio for histological subtypes of lung <strong>cancer</strong>, 1961 2005, by gender <strong>and</strong> occupational category. Only<br />
occupations with more than 30 observed cases in sum are listed.<br />
No <strong>Occupation</strong>al category<br />
Adenocarcinoma<br />
Small cell<br />
carcinoma<br />
Men Women<br />
Squamous<br />
cell<br />
carcinoma Other Types<br />
Adenocarcinoma<br />
Small cell<br />
carcinoma<br />
Squamous cell<br />
carcinoma<br />
1 Technical workers, etc 0.93 0.69 0.79 0.79 1.10 0.71 1.01 0.89<br />
2 Laboratory assistants 0.91 0.88 0.74 0.81 0.89 0.74 1.03 0.88<br />
3 Physicians 0.69 0.40 0.53 0.49 0.81 0.39 0.94 0.45<br />
4 Dentists 0.55 0.51 0.42 0.45 0.83 0.62 0.39 0.62<br />
5 Nurses 0.75 0.46 0.76 0.67<br />
6 Assistant nurses 0.55 0.63 1.13 0.88 1.07 0.94 1.04 0.94<br />
7 ‘‘Other health workers’’ 0.93 0.70 0.87 0.77 0.88 0.85 0.66 0.83<br />
8 Teachers 0.58 0.38 0.44 0.50 0.67 0.37 0.41 0.56<br />
9 Religious workers etc 0.80 0.55 0.59 0.61 0.76 0.64 0.74 0.83<br />
10 Artistic workers 1.05 1.10 0.90 0.84 0.98 0.89 1.02 1.36<br />
11 Journalists 0.97 1.11 0.90 0.83 1.43 0.88 1.20 1.74<br />
12 Administrators 0.93 0.71 0.79 0.80 0.95 0.98 1.17 1.13<br />
13 Clerical workers 0.98 0.81 0.87 0.93 1.16 1.09 1.04 1.17<br />
14 Sales agents 1.06 0.95 0.99 1.04 1.25 1.16 1.33 1.13<br />
15 Shop workers 1.00 0.89 0.98 0.99 1.09 1.06 1.12 1.15<br />
16 Farmers 0.54 0.62 0.55 0.61 0.55 0.34 0.41 0.48<br />
17 Gardeners 0.62 0.73 0.69 0.67 0.69 0.41 0.42 0.54<br />
18 Fishermen 1.07 1.23 1.23 1.12<br />
19 Forestry workers 0.74 1.08 0.87 0.91<br />
20 Miners <strong>and</strong> quarry workers 1.20 1.59 1.75 1.67<br />
21 Seamen 1.71 1.58 1.58 1.63<br />
22 Transport workers 0.99 0.98 0.95 0.90 1.69 1.83 2.10 1.75<br />
23 Drivers 1.24 1.29 1.33 1.20 1.57 1.79 1.63 1.23<br />
24 Postal workers 1.04 0.79 0.93 0.93 0.94 1.06 1.06 1.04<br />
25 Textile workers 1.08 0.85 1.00 0.93 1.16 1.08 1.13 1.08<br />
26 Shoe <strong>and</strong> leather workers 1.01 0.99 1.15 1.07 1.19 1.55 0.98 0.91<br />
27 Smelting workers 1.33 1.46 1.32 1.26 1.17 1.08 1.65 1.34<br />
28 Mechanics 1.27 1.25 1.25 1.21 1.34 1.90 1.99 1.47<br />
29 Plumbers 1.40 1.50 1.38 1.40<br />
30 Welders 1.51 1.24 1.35 1.24<br />
31 Electrical workers 0.98 0.99 1.09 1.00 1.75 2.10 1.75 1.70<br />
32 Wood workers 0.92 1.02 0.97 0.92 1.04 1.37 1.24 1.18<br />
33 Painters 1.16 1.28 1.26 1.17 1.59 1.33 3.06 1.84<br />
34 ‘‘Other construction workers’’ 1.19 1.54 1.34 1.39 1.82 2.74 3.24 1.75<br />
35 Bricklayers 1.21 1.38 1.20 1.30<br />
36 Printers 1.22 1.05 1.21 1.20 1.53 2.19 1.86 1.75<br />
37 Chemical process workers 1.07 1.25 1.16 1.03 1.47 2.07 1.37 1.01<br />
38 Food workers 1.06 1.13 1.27 1.17 1.15 1.50 1.50 1.22<br />
39 Beverage workers 1.31 1.04 1.52 1.09 1.30 3.02 1.64 1.55<br />
40 Tobacco workers 1.24 2.65 1.93 1.93 2.32 3.67 2.08 2.15<br />
41 Glass makers etc 1.07 1.33 1.23 1.12 1.35 1.69 1.41 1.38<br />
42 Packers 1.20 1.28 1.34 1.33 1.38 1.77 1.63 1.41<br />
43 Engine operators 1.18 1.22 1.25 1.16 2.24 2.97 3.07 2.58<br />
44 Public safety workers 1.02 0.92 0.93 0.99 1.22 1.67 0.76 1.34<br />
45 Cooks <strong>and</strong> stewards 1.72 1.22 1.53 1.53 1.21 1.46 1.00 1.02<br />
46 Domestic assistants 1.08 0.99 1.01 0.96<br />
47 Waiters 2.05 1.69 1.77 2.05 1.66 1.88 2.36 1.79<br />
48 Building caretakers 1.17 1.17 1.20 1.11 1.17 1.47 1.45 1.27<br />
49 Chimney sweeps 1.38 1.11 1.42 1.61<br />
50 Hairdressers 1.33 0.94 1.21 1.35 1.38 1.19 1.28 1.53<br />
51 Launderers 1.28 1.03 1.31 1.29 1.33 1.43 1.46 1.00<br />
52 Military personnel 1.04 0.85 0.91 0.95<br />
53 ‘‘Other workers’’ 1.15 1.21 1.18 1.13 1.16 1.30 1.27 1.16<br />
54 Economically inactive 1.18 1.29 1.30 1.44 0.93 0.92 0.92 0.95<br />
1 54 All categories 1.00 1.00 1.00 1.00 1.00 1.00 1.00 1.00<br />
Other<br />
types
Acta Oncol Downloaded from informahealthcare.com by 212.35.100.66 on 04/06/11<br />
For personal use only.<br />
e.g. to arsenic, nickel <strong>and</strong> chromium compounds;<br />
welders to welding fumes, nickel <strong>and</strong> chromium<br />
compounds; drivers to diesel exhaust; bricklayers<br />
<strong>and</strong> other construction workers to silica dust <strong>and</strong><br />
asbestos; <strong>and</strong> chemical workers <strong>and</strong> mechanics to<br />
mixed exposures. A high prevalence of cigarette<br />
smoking <strong>and</strong> an excess risk of lung <strong>cancer</strong> have<br />
been demonstrated among seamen [91 93]. Among<br />
seamen working in the machine room, exposure to<br />
asbestos, polyaromatic hydrocarbons <strong>and</strong> oil mist<br />
may also contribute to the elevated lung <strong>cancer</strong> risk.<br />
In the present study the lowest SIRs for lung<br />
<strong>cancer</strong> were seen among those with a high level of<br />
education, such as physicians, dentists, nurses <strong>and</strong><br />
teachers, but also among farmers. These groups<br />
smoke less than others [5,32,94].<br />
The findings for the histological subtypes of lung<br />
<strong>cancer</strong> did not suggest that aetiological factors would<br />
be specific to one subtype only.<br />
Mesothelioma in the pleura/peritoneum<br />
Mesothelioma is a rare disease. Of all mesotheliomas,<br />
over 80% are of pleural origin. Figure 28<br />
shows the time trends for pleural <strong>cancer</strong>, the great<br />
majority of which are the mesothelioma type. Pleural<br />
<strong>cancer</strong> has increased in men, but the incidence<br />
has always remained low in women.<br />
Despite the rareness of mesothelioma, 14 of<br />
the 53 occupational categories had a statistically<br />
significant excess risk in men, <strong>and</strong> 18 of the groups<br />
had a statistically significant deficit risk. In men,<br />
the risk varied almost by 20-fold from an SIR<br />
of 4.74 (95% CI 4.18 5.38) in plumbers to 0.22<br />
(0.04 0.63) among the journalists. The high risk<br />
occupational categories include seamen, mechanics,<br />
electrical workers, smelting workers, welders<br />
<strong>and</strong> painters (Table 37). In women, only a few<br />
/ 100 000<br />
2<br />
1<br />
Denmark<br />
Finl<strong>and</strong><br />
Icel<strong>and</strong><br />
Norway<br />
Sweden<br />
Men<br />
0<br />
1945 1960 1975 1990 2005<br />
/ 100 000<br />
occupations have a statistically significant excess<br />
or deficit risk. The high risk groups were woodworkers<br />
(2.12, 1.06 3.80), glass makers, textile<br />
workers <strong>and</strong> building caretakers. The low risk<br />
groups included farmers (0.65, 0.43 0.96) <strong>and</strong><br />
gardeners (Table 38).<br />
Comment. Asbestos exposure is the overwhelming<br />
cause of mesothelioma [95], <strong>and</strong> the proportion<br />
attributable to asbestos has been estimated to be<br />
about 85% [82].<br />
An increased risk of mesothelioma has been convincingly<br />
shown in occupational categories exposed<br />
to asbestos: miners, insulation workers, manufacturers<br />
of cement, textiles, thermoelectric power plant<br />
workers, oil refining, pulp <strong>and</strong> paper production,<br />
petroleum industry, cigarette <strong>and</strong> filter manufacturing<br />
<strong>and</strong> the railroad industry [95]. All occupational<br />
categories with increased mesothelioma risk in our<br />
study involve exposure to asbestos, while the low risk<br />
categories were probably unexposed.<br />
Breast <strong>cancer</strong><br />
Breast <strong>cancer</strong> accounts for nearly one third of all<br />
incident <strong>cancer</strong> among women in the Nordic countries.<br />
The incidence is a 100-fold higher than among<br />
men, <strong>and</strong> has been rising rapidly during the past five<br />
decades (Figure 29). During most of the period the<br />
incidence was highest in Denmark <strong>and</strong> lowest in<br />
Finl<strong>and</strong>. An increase in the rates was observed along<br />
with the implementation of the organised mammography<br />
(breast <strong>cancer</strong> screening programmes) e.g. in<br />
Finl<strong>and</strong> (1986) <strong>and</strong> Norway (1994).<br />
In the present study, the risk among males<br />
was highest among journalists (SIR 2.72, 95% CI<br />
1.49 4.56), followed by cooks <strong>and</strong> stewards, printers,<br />
artistic workers <strong>and</strong> building caretakers. It was<br />
2<br />
1<br />
<strong>Occupation</strong> <strong>and</strong> <strong>cancer</strong> in Nordic countries 703<br />
Denmark<br />
Finl<strong>and</strong><br />
Icel<strong>and</strong><br />
Norway<br />
Sweden<br />
Women<br />
0<br />
1945 1960 1975 1990 2005<br />
Figure 28. Age st<strong>and</strong>ardised (World) incidence rates for pleural <strong>cancer</strong> 1943 2005, by country <strong>and</strong> gender. Modified from NORDCAN<br />
[49].
Acta Oncol Downloaded from informahealthcare.com by 212.35.100.66 on 04/06/11<br />
For personal use only.<br />
704 E. Pukkala et al.<br />
Table 37. Observed number of mesothelioma in the pleura/peritoneum among men in the Nordic countries <strong>and</strong> st<strong>and</strong>ardised incidence<br />
ratios 1961 2005, by country <strong>and</strong> occupational category.<br />
Denmark Finl<strong>and</strong> Icel<strong>and</strong> Norway Sweden Total<br />
No <strong>Occupation</strong>al category Obs SIR Obs SIR Obs SIR Obs SIR Obs SIR Obs SIR 95% CI<br />
1 Technical workers, etc 136 1.53 98 1.43 [0.59] 0.00 46 0.97 285 1.17 565 1.26 1.16*1.36<br />
2 Laboratory assistants 1 0.56 3 1.70 1 8.64 2 0.93 2 1.27 9 1.22 0.56*2.32<br />
3 Physicians 4 0.56 2 0.50 [0.23] 0.00 2 0.36 5 0.44 13 0.46 0.24*0.79<br />
4 Dentists 1 0.47 [0.79] 0.00 [0.06] 0.00 1 0.40 2 0.37 4 0.37 0.10*0.94<br />
5 Nurses [0.10] 0.00 [0.23] 0.00 [0.00] 0.00 [0.30] 0.00 1 1.52 1 0.78 0.02*4.33<br />
6 Assistant nurses [2.15] 0.00 1 4.58 [0.02] 0.00 [0.91] 0.00 5 1.35 6 0.86 0.31*1.86<br />
7 ‘‘Other health workers’’ 5 0.79 2 0.55 [0.06] 0.00 1 0.48 6 0.67 14 0.67 0.36*1.12<br />
8 Teachers 14 0.36 14 0.49 [0.85] 0.00 13 0.40 39 0.59 80 0.48 0.38*0.60<br />
9 Religious workers etc 7 0.44 13 0.83 [0.53] 0.00 6 0.38 25 0.51 51 0.53 0.40*0.70<br />
10 Artistic workers 6 1.20 4 0.74 1 6.92 5 1.08 9 0.61 25 0.84 0.54*1.24<br />
11 Journalists [2.40] 0.00 2 0.77 [0.08] 0.00 [2.06] 0.00 1 0.15 3 0.22 0.04*0.63<br />
12 Administrators 87 0.89 34 0.82 1 0.77 37 0.69 55 0.64 214 0.76 0.67*0.87<br />
13 Clerical workers 28 0.64 26 1.01 1 0.71 23 0.55 67 0.71 145 0.70 0.59*0.82<br />
14 Sales agents 14 0.60 32 0.83 [0.75] 0.00 26 0.57 78 0.56 150 0.61 0.52*0.71<br />
15 Shop workers 63 0.64 12 0.68 [0.50] 0.00 9 0.46 31 0.68 115 0.63 0.53*0.76<br />
16 Farmers 32 0.18 54 0.35 1 0.49 18 0.16 51 0.26 156 0.24 0.21*0.28<br />
17 Gardeners 9 0.34 6 0.24 [0.06] 0.00 13 0.43 17 0.22 45 0.28 0.20*0.38<br />
18 Fishermen 4 0.43 1 0.49 1 0.74 16 0.43 4 0.49 26 0.44 0.29*0.65<br />
19 Forestry workers 1 0.26 10 0.33 [0.01] 0.00 7 0.33 11 0.19 29 0.26 0.17*0.37<br />
20 Miners <strong>and</strong> quarry workers 1 0.83 5 1.02 [0.02] 0.00 4 0.62 10 0.68 20 0.73 0.45*1.13<br />
21 Seamen 26 2.53 18 2.68 1 2.84 61 1.74 37 2.77 143 2.18 1.85*2.56<br />
22 Transport workers 21 0.97 15 0.81 2 2.96 10 0.56 37 0.80 85 0.81 0.65*1.00<br />
23 Drivers 56 0.78 56 0.86 1 0.96 24 0.48 63 0.54 200 0.66 0.57*0.75<br />
24 Postal workers 9 0.64 8 0.86 [0.11] 0.00 5 0.56 11 0.45 33 0.58 0.40*0.82<br />
25 Textile workers 9 0.73 3 0.51 [0.20] 0.00 6 0.62 21 0.83 39 0.73 0.52*1.00<br />
26 Shoe <strong>and</strong> leather workers 2 0.67 1 0.40 [0.04] 0.00 3 0.80 4 0.44 10 0.54 0.26*1.00<br />
27 Smelting workers 101 3.53 6 0.65 1 3.29 22 1.66 46 1.12 176 1.90 1.64*2.20<br />
28 Mechanics 187 2.46 104 1.63 [0.98] 0.00 148 2.11 412 1.95 851 2.02 1.88*2.16<br />
29 Plumbers 27 3.92 36 3.29 1 6.34 47 5.68 129 5.29 240 4.74 4.18*5.38<br />
30 Welders 22 1.98 [0.06] 0.00 20 1.99 49 1.66 91 1.79 1.44*2.20<br />
31 Electrical workers 31 1.69 70 2.52 1 1.61 62 1.98 128 1.70 292 1.90 1.70*2.13<br />
32 Wood workers 109 2.13 84 1.39 [0.54] 0.00 145 1.92 156 1.23 494 1.57 1.44*1.71<br />
33 Painters 22 1.28 30 2.22 [0.23] 0.00 19 1.55 73 1.92 144 1.77 1.51*2.09<br />
34 ‘‘Other construction workers’’ 56 0.88 53 1.34 2 1.77 33 2.17 124 1.80 268 1.42 1.26*1.60<br />
35 Bricklayers 20 1.07 13 2.07 16 2.15 28 1.68 77 1.57 1.24*1.96<br />
36 Printers 11 0.90 4 0.59 [0.20] 0.00 6 0.75 14 0.63 35 0.71 0.49*0.99<br />
37 Chemical process workers 14 1.28 10 0.93 [0.10] 0.00 25 1.58 45 1.49 94 1.39 1.12*1.70<br />
38 Food workers 16 0.45 5 0.65 [0.76] 0.00 5 0.27 12 0.37 38 0.40 0.28*0.55<br />
39 Beverage workers 3 0.67 1 2.12 1 82.99 [0.28] 0.00 2 1.21 7 1.02 0.41*2.09<br />
40 Tobacco workers 2 2.91 [0.09] 0.00 [0.00] 0.00 [0.26] 0.00 [0.15] 0.00 2 1.68 0.20*6.07<br />
41 Glass makers etc 17 0.81 15 1.36 1 6.97 14 1.44 50 1.42 97 1.26 1.02*1.53<br />
42 Packers 19 1.03 24 1.10 [0.44] 0.00 30 1.09 60 1.01 133 1.04 0.88*1.23<br />
43 Engine operators 34 1.78 41 1.26 2 2.95 26 1.45 54 0.96 157 1.24 1.06*1.45<br />
44 Public safety workers 14 0.81 14 0.79 [0.46] 0.00 13 1.06 33 0.98 74 0.91 0.71*1.14<br />
45 Cooks <strong>and</strong> stewards [1.45] 0.00 [1.13] 0.00 1 4.27 4 0.68 5 0.81 10 0.67 0.32*1.23<br />
46 Domestic assistants [0.02] 0.00 [0.05] 0.00 [0.00] 0.00 [0.06] 0.00 [0.50] 0.00 [0.62] 0.00 0.00*5.92<br />
47 Waiters 3 0.97 1 0.89 [0.03] 0.00 [2.43] 0.00 2 0.62 6 0.61 0.22*1.32<br />
48 Building caretakers 16 0.86 12 0.86 1 5.47 12 1.95 28 1.21 69 1.11 0.86*1.41<br />
49 Chimney sweeps 1 1.99 2 1.90 [0.64] 0.00 5 2.63 8 1.95 0.84*3.85<br />
50 Hairdressers 2 0.38 [0.29] 0.00 [0.04] 0.00 [1.78] 0.00 2 0.32 4 0.29 0.08*0.75<br />
51 Launderers 1 0.39 1 3.23 [0.02] 0.00 1 0.94 4 0.90 7 0.83 0.34*1.72<br />
52 Military personnel 12 1.28 2 0.30 14 1.14 17 0.83 45 0.92 0.67*1.23<br />
53 ‘‘Other workers’’ 65 1.11 11 0.67 1 0.53 44 0.90 58 0.80 179 0.90 0.78*1.04<br />
54 Economically inactive 46 0.82 65 0.91 1 0.78 18 0.82 108 0.99 238 0.92 0.81*1.04<br />
1 54 All categories 1 365 1.00 1 046 1.00 23 1.00 1 062 1.00 2 521 1.00 6 017 1.00 Ref.<br />
Obs observed number of cases; SIR st<strong>and</strong>ardised incidence ratio; 95% CI 95% confidence interval.
Acta Oncol Downloaded from informahealthcare.com by 212.35.100.66 on 04/06/11<br />
For personal use only.<br />
Table 38. Observed number of mesothelioma in the pleura/peritoneum among women in the Nordic countries <strong>and</strong> st<strong>and</strong>ardised incidence<br />
ratios 1961 2005, by country <strong>and</strong> occupational category.<br />
Denmark Finl<strong>and</strong> Icel<strong>and</strong> Norway Sweden Total<br />
No <strong>Occupation</strong>al category Obs SIR Obs SIR Obs SIR Obs SIR Obs SIR Obs SIR 95% CI<br />
1 Technical workers, etc [1.16] 0.00 2 0.94 [0.00] 0.00 1 3.29 3 1.24 6 1.00 0.37*2.17<br />
2 Laboratory assistants [0.81] 0.00 4 3.10 [0.00] 0.00 [0.37] 0.00 1 1.55 5 1.60 0.52*3.74<br />
3 Physicians [0.38] 0.00 2 3.94 [0.00] 0.00 [0.14] 0.00 1 1.83 3 1.91 0.39*5.57<br />
4 Dentists 1 2.96 1 1.69 [0.00] 0.00 [0.11] 0.00 [0.43] 0.00 2 1.36 0.16*4.92<br />
5 Nurses 6 0.88 2 0.30 [0.03] 0.00 4 1.37 7 0.96 19 0.80 0.48*1.26<br />
6 Assistant nurses 1 0.21 5 0.72 1 18.60 8 2.62 14 1.10 29 1.05 0.70*1.50<br />
7 ‘‘Other health workers’’ 4 1.03 4 0.75 [0.01] 0.00 2 0.70 5 1.17 15 0.92 0.51*1.52<br />
8 Teachers 8 0.96 15 1.24 [0.05] 0.00 4 0.77 15 0.93 42 1.00 0.72*1.36<br />
9 Religious workers etc [1.14] 0.00 3 0.56 [0.01] 0.00 [1.35] 0.00 7 1.33 10 0.76 0.37*1.41<br />
10 Artistic workers 1 1.63 2 2.13 [0.01] 0.00 [0.38] 0.00 3 2.89 6 2.01 0.74*4.38<br />
11 Journalists [0.13] 0.00 1 1.59 [0.00] 0.00 1 9.20 [0.48] 0.00 2 1.48 0.18*5.35<br />
12 Administrators 2 0.55 3 1.51 [0.01] 0.00 3 2.42 [2.30] 0.00 8 0.87 0.38*1.72<br />
13 Clerical workers 42 1.22 44 1.13 [0.19] 0.00 18 1.05 42 1.03 146 1.11 0.94*1.30<br />
14 Sales agents 1 3.14 11 1.93 [0.03] 0.00 2 1.01 5 0.91 19 1.40 0.84*2.19<br />
15 Shop workers 23 0.95 20 0.91 [0.14] 0.00 18 1.28 34 1.35 95 1.11 0.90*1.36<br />
16 Farmers 9 0.55 5 0.40 [0.11] 0.00 8 0.93 4 1.91 26 0.65 0.43*0.96<br />
17 Gardeners 3 1.40 26 0.65 [0.00] 0.00 4 0.74 2 0.31 35 0.65 0.45*0.90<br />
18 Fishermen [0.08] 0.00 [0.08] 0.00 [0.00] 0.00 1 13.42 [0.02] 0.00 1 3.76 0.10*20.97<br />
19 Forestry workers [0.02] 0.00 [0.16] 0.00 [0.00] 0.00 [0.11] 0.00 [0.14] 0.00 [0.44] 0.00 0.00*8.38<br />
20 Miners <strong>and</strong> quarry workers [0.00] 0.00 [0.07] 0.00 [0.01] 0.00 [0.03] 0.00 [0.11] 0.00 0.00*32.79<br />
21 Seamen [0.02] 0.00 [0.02] 0.00 [0.00] 0.00 [0.04] 0.00 0.00*96.38<br />
22 Transport workers [0.02] 0.00 3 2.70 [0.00] 0.00 [0.08] 0.00 [0.40] 0.00 3 1.85 0.38*5.41<br />
23 Drivers 2 3.31 1 2.05 [0.00] 0.00 [0.28] 0.00 1 1.02 4 1.70 0.46*4.35<br />
24 Postal workers 1 0.79 9 1.37 [0.05] 0.00 3 0.94 11 1.52 24 1.31 0.84*1.95<br />
25 Textile workers 10 1.23 19 1.29 1 9.16 4 0.88 26 1.81 60 1.44 1.10*1.85<br />
26 Shoe <strong>and</strong> leather workers 2 3.36 2 1.08 [0.00] 0.00 [0.33] 0.00 [1.11] 0.00 4 1.03 0.28*2.63<br />
27 Smelting workers [0.15] 0.00 [0.44] 0.00 [0.00] 0.00 [0.05] 0.00 [0.31] 0.00 [0.94] 0.00 0.00*3.91<br />
28 Mechanics 1 0.70 4 2.11 [0.00] 0.00 1 2.23 2 0.65 8 1.17 0.51*2.31<br />
29 Plumbers [0.01] 0.00 [0.00] 0.00 [0.00] 0.00 [0.00] 0.00 [0.03] 0.00 0.00*142.40<br />
30 Welders [0.15] 0.00 [0.04] 0.00 [0.12] 0.00 [0.30] 0.00 0.00*12.30<br />
31 Electrical workers 3 1.50 1 0.86 [0.00] 0.00 1 2.00 4 2.34 9 1.67 0.76*3.18<br />
32 Wood workers 2 3.03 9 2.34 [0.00] 0.00 [0.18] 0.00 [0.51] 0.00 11 2.12 1.06*3.80<br />
33 Painters [0.03] 0.00 1 2.24 [0.00] 0.00 [0.04] 0.00 [0.14] 0.00 1 1.54 0.04*8.58<br />
34 ‘‘Other construction workers’’ [0.02] 0.00 3 1.97 [0.00] 0.00 [0.01] 0.00 [0.02] 0.00 3 1.90 0.39*5.57<br />
35 Bricklayers [0.00] 0.00 1 19.68 [0.00] 0.00 [0.00] 0.00 1 17.73 0.45*98.76<br />
36 Printers [0.77] 0.00 2 1.08 [0.01] 0.00 1 2.48 2 1.57 5 1.16 0.38*2.71<br />
37 Chemical process workers [1.22] 0.00 [0.97] 0.00 [0.00] 0.00 1 2.70 1 0.98 2 0.56 0.07*2.02<br />
38 Food workers 5 0.86 6 1.19 [0.19] 0.00 5 2.13 7 2.36 23 1.40 0.89*2.11<br />
39 Beverage workers [0.58] 0.00 [0.28] 0.00 [0.00] 0.00 [0.02] 0.00 1 5.48 1 0.93 0.02*5.19<br />
40 Tobacco workers [0.80] 0.00 1 6.20 [0.07] 0.00 [0.12] 0.00 1 0.87 0.02*4.83<br />
41 Glass makers etc 3 2.10 7 1.99 [0.00] 0.00 1 1.22 5 1.84 16 1.89 1.08*3.06<br />
42 Packers 3 7.30 7 1.12 [0.02] 0.00 [1.99] 0.00 5 1.24 15 1.18 0.66*1.95<br />
43 Engine operators [0.01] 0.00 3 2.94 [0.03] 0.00 1 3.85 4 3.02 0.82*7.74<br />
44 Public safety workers [0.05] 0.00 [0.22] 0.00 [0.00] 0.00 [0.24] 0.00 1 3.14 1 1.20 0.03*6.66<br />
45 Cooks <strong>and</strong> stewards [0.02] 0.00 9 1.33 [0.08] 0.00 3 1.22 6 1.07 18 1.21 0.72*1.91<br />
46 Domestic assistants 16 1.75 3 0.44 [0.03] 0.00 4 0.59 9 0.61 32 0.85 0.58*1.20<br />
47 Waiters 2 1.25 8 1.36 [0.01] 0.00 5 1.70 7 1.15 22 1.33 0.84*2.02<br />
48 Building caretakers 25 0.93 33 1.40 [0.16] 0.00 14 1.06 27 1.76 99 1.25 1.02*1.52<br />
49 Chimney sweeps [0.00] 0.00 [0.01] 0.00 [0.00] 0.00 [0.00] 0.00 [0.02] 0.00 0.00*212.47<br />
50 Hairdressers 1 0.64 [2.18] 0.00 [0.01] 0.00 [0.76] 0.00 2 0.76 3 0.42 0.09*1.23<br />
51 Launderers 2 0.66 4 2.06 [0.03] 0.00 1 0.97 3 0.97 10 1.10 0.53*2.02<br />
52 Military personnel [0.02] 0.00 [0.02] 0.00 [0.00] 0.00 [0.01] 0.00 [0.05] 0.00 0.00*71.35<br />
53 ‘‘Other workers’’ 10 1.32 7 0.97 [0.15] 0.00 4 0.59 8 1.15 29 1.01 0.68*1.45<br />
54 Economically inactive 204 0.98 132 0.86 [0.48] 0.00 58 0.90 276 0.87 670 0.90 0.84*0.97<br />
1 54 All categories 393 1.00 425 1.00 2 1.00 180 1.00 548 1.00 1 548 1.00 Ref.<br />
Obs observed number of cases; SIR st<strong>and</strong>ardised incidence ratio; 95% CI 95% confidence interval.<br />
<strong>Occupation</strong> <strong>and</strong> <strong>cancer</strong> in Nordic countries 705
Acta Oncol Downloaded from informahealthcare.com by 212.35.100.66 on 04/06/11<br />
For personal use only.<br />
706 E. Pukkala et al.<br />
lowest in engine operators (0.63, 0.42 0.90) <strong>and</strong><br />
forestry workers (Table 39).<br />
In women, the occupational groups with the<br />
highest SIRs were military personnel (1.57, 1.03<br />
2.30), dentists, journalists, physicians, administrators<br />
<strong>and</strong> artistic workers (Table 40). The SIR was<br />
lowest among fishermen (0.69, 0.50 0.92); followed<br />
by forestry workers, wood workers, gardeners <strong>and</strong><br />
farmers.<br />
The contrast between the highest <strong>and</strong> the lowest<br />
SIRs was somewhat stronger for lobular <strong>cancer</strong><br />
(around 10% of breast <strong>cancer</strong>; http://astra.can<br />
cer.fi/NOCCA/Incidence/breast-lobular), than for<br />
ductal <strong>cancer</strong> (around 80% of breast <strong>cancer</strong>; http://<br />
astra.<strong>cancer</strong>.fi/NOCCA/Incidence/breast-ductal).<br />
The highest SIR for the lobular type was 1.79 (1.39<br />
2.28) for journalists, followed by physicians (1.71,<br />
1.36 2.13), dentists (1.66, 1.22 2.20) <strong>and</strong> administrators<br />
(1.51, 1.34 1.71). The lowest SIRs were seen<br />
for engine operators (0.43, 0.24 0.72) <strong>and</strong> woodworkers<br />
(0.53, 0.39 0.71).<br />
Comment. Among men, the occupations with the<br />
highest incidence were characterised by shift- or<br />
night work. Shift work that involves night work<br />
(<strong>and</strong> thus circadian disruption) has been classified<br />
by the International Agency for Cancer Research as<br />
probably carcinogenic to humans, with the human<br />
evidence based on breast <strong>cancer</strong> research [96]. In the<br />
present study the results for women were less<br />
suggestive of an association with shift or night<br />
work. This could be related to the fact that for<br />
women, the most important non-genetic risk factors<br />
for breast <strong>cancer</strong> are hormonal factors, strongly<br />
connected with reproductive behaviour [97].<br />
Young age at first birth <strong>and</strong> an increasing number<br />
of births are associated with lowered risk. The<br />
/ 100 000<br />
100<br />
80<br />
60<br />
40<br />
20<br />
Denmark<br />
Finl<strong>and</strong><br />
Icel<strong>and</strong><br />
Norway<br />
Sweden<br />
Women<br />
0<br />
1945 1960 1975 1990 2005<br />
Figure 29. Age st<strong>and</strong>ardised (World) incidence rates for breast <strong>cancer</strong> 1943 2005, by country. Modified from NORDCAN [49].<br />
present results showed the highest SIRs in occupations<br />
that require high education <strong>and</strong> cause women<br />
to postpone their first childbirth. Other established<br />
risk factors for breast <strong>cancer</strong> include ionising radiation,<br />
lack of physical activity, high body mass index<br />
<strong>and</strong> alcohol consumption. These factors were not<br />
particularly reflected in the present results, except<br />
for a tendency for occupations with high levels of<br />
physical activity to have the lowest SIRs. The<br />
contrasts seen between occupations were considerably<br />
higher among men than women, which might<br />
indicate a stronger occupationally related aetiology<br />
among the men.<br />
Cervical <strong>cancer</strong><br />
Incidence of cervical <strong>cancer</strong> has decreased in<br />
all Nordic countries since the 1960s, except for in<br />
Norway where the decrease started in the mid 1970s<br />
(Figure 30). This can mainly be explained by the<br />
introduction of organised screening programmes.<br />
The lowest rate, in Finl<strong>and</strong>, has always been less<br />
than half of the highest rate, in Denmark.<br />
The highest SIRs were seen among beverage<br />
manufacture workers (SIR 2.01, 95% CI 1.51<br />
2.61), ‘‘other construction workers’’, waiters, tobacco<br />
manufacture workers, drivers <strong>and</strong> electrical<br />
workers. The SIRs were lowest among the dentists<br />
(0.48, 0.30 0.74), physicians, teachers, farmers<br />
<strong>and</strong> nurses (Table 41).<br />
Comment. Infection with oncogenic types of human<br />
papilloma virus (HPV) is the main cause of cervical<br />
<strong>cancer</strong> [98]. Tobacco has an independent role in<br />
cervical <strong>cancer</strong> carcinogenesis.<br />
In previous research, high rates have been found<br />
among cleaners, food preparation workers <strong>and</strong> wait-
Acta Oncol Downloaded from informahealthcare.com by 212.35.100.66 on 04/06/11<br />
For personal use only.<br />
Table 39. Observed number of breast <strong>cancer</strong> among men in the Nordic countries <strong>and</strong> st<strong>and</strong>ardised incidence ratios 1961 2005, by country<br />
<strong>and</strong> occupational category.<br />
Denmark Finl<strong>and</strong> Icel<strong>and</strong> Norway Sweden Total<br />
No <strong>Occupation</strong>al category Obs SIR Obs SIR Obs SIR Obs SIR Obs SIR Obs SIR 95% CI<br />
1 Technical workers, etc 32 1.01 24 1.30 2 3.15 10 0.68 103 1.05 171 1.04 0.90*1.21<br />
2 Laboratory assistants [0.62] 0.00 [0.47] 0.00 [0.12] 0.00 1 1.42 [0.46] 0.00 1 0.42 0.01*2.34<br />
3 Physicians 4 1.50 1 0.92 1 3.90 1 0.51 4 0.89 11 1.05 0.52*1.88<br />
4 Dentists [0.76] 0.00 [0.23] 0.00 [0.06] 0.00 3 3.45 2 0.89 5 1.20 0.39*2.80<br />
5 Nurses [0.04] 0.00 [0.07] 0.00 [0.00] 0.00 1 12.43 [0.25] 0.00 1 2.29 0.06*12.75<br />
6 Assistant nurses 1 1.34 [0.06] 0.00 [0.03] 0.00 [0.33] 0.00 1 0.63 2 0.73 0.09*2.63<br />
7 ‘‘Other health workers’’ 3 1.34 1 1.00 [0.07] 0.00 1 1.34 6 1.58 11 1.40 0.70*2.50<br />
8 Teachers 11 0.79 9 1.18 [0.93] 0.00 13 1.19 34 1.33 67 1.14 0.88*1.44<br />
9 Religious workers etc 3 0.50 6 1.41 [0.60] 0.00 6 1.07 17 0.86 32 0.89 0.61*1.25<br />
10 Artistic workers 4 2.22 3 2.05 [0.16] 0.00 6 3.68 5 0.83 18 1.63 0.97*2.57<br />
11 Journalists 1 1.18 [0.70] 0.00 [0.09] 0.00 1 1.41 12 4.28 14 2.72 1.49*4.56<br />
12 Administrators 36 1.00 15 1.35 [1.47] 0.00 15 0.76 51 1.33 117 1.10 0.91*1.31<br />
13 Clerical workers 16 1.04 11 1.53 2 1.19 20 1.36 49 1.19 98 1.22 0.99*1.49<br />
14 Sales agents 9 1.12 18 1.71 1 1.18 12 0.70 60 1.01 100 1.04 0.86*1.27<br />
15 Shop workers 41 1.15 4 0.86 [0.61] 0.00 4 0.61 17 0.90 66 0.99 0.77*1.26<br />
16 Farmers 58 0.81 29 0.63 4 1.63 50 1.01 86 0.82 227 0.83 0.72*0.94<br />
17 Gardeners 9 0.90 7 0.99 [0.08] 0.00 9 0.76 39 1.02 64 0.95 0.73*1.22<br />
18 Fishermen 4 1.26 1 1.61 1 0.66 14 0.92 5 1.23 25 1.02 0.66*1.50<br />
19 Forestry workers 2 1.37 4 0.49 [0.01] 0.00 7 0.78 17 0.62 30 0.65 0.44*0.93<br />
20 Miners <strong>and</strong> quarry workers 2 4.66 1 0.76 [0.03] 0.00 6 2.46 8 1.19 17 1.55 0.90*2.49<br />
21 Seamen 4 1.20 2 1.11 [0.41] 0.00 10 0.83 7 1.18 23 0.98 0.62*1.46<br />
22 Transport workers 6 0.78 6 1.19 [0.78] 0.00 7 1.06 21 1.05 40 1.00 0.71*1.36<br />
23 Drivers 14 0.58 7 0.41 [1.17] 0.00 13 0.74 56 1.15 90 0.83 0.66*1.02<br />
24 Postal workers 2 0.42 1 0.39 [0.14] 0.00 5 1.46 11 1.01 19 0.87 0.52*1.36<br />
25 Textile workers 2 0.46 2 1.19 1 4.04 5 1.32 10 0.82 20 0.90 0.55*1.39<br />
26 Shoe <strong>and</strong> leather workers 1 0.92 [0.72] 0.00 [0.05] 0.00 1 0.63 5 1.02 7 0.84 0.34*1.73<br />
27 Smelting workers 11 1.16 1 0.39 2 5.74 4 0.79 16 0.84 34 0.93 0.64*1.30<br />
28 Mechanics 31 1.20 18 1.05 [1.16] 0.00 25 1.03 84 0.94 158 1.00 0.86*1.17<br />
29 Plumbers 1 0.44 1 0.34 [0.18] 0.00 2 0.72 8 0.78 12 0.65 0.34*1.14<br />
30 Welders 5 1.72 [0.07] 0.00 3 0.96 13 1.13 21 1.19 0.74*1.82<br />
31 Electrical workers 13 2.17 3 0.40 [0.69] 0.00 15 1.39 20 0.66 51 0.92 0.68*1.21<br />
32 Wood workers 14 0.77 13 0.76 [0.65] 0.00 23 0.80 59 0.97 109 0.87 0.72*1.05<br />
33 Painters 7 1.20 3 0.80 [0.26] 0.00 8 1.68 19 1.10 37 1.16 0.82*1.60<br />
34 ‘‘Other construction workers’’ 18 0.79 13 1.18 1 0.77 5 0.89 22 0.68 59 0.81 0.61*1.04<br />
35 Bricklayers 6 0.92 2 1.13 1 0.35 9 1.15 18 0.95 0.56*1.50<br />
36 Printers 7 1.71 2 1.09 1 4.61 4 1.41 20 2.14 34 1.86 1.28*2.59<br />
37 Chemical process workers 8 2.08 6 2.08 [0.12] 0.00 9 1.42 14 0.96 37 1.33 0.94*1.84<br />
38 Food workers 13 1.04 3 1.43 [0.99] 0.00 2 0.28 16 1.09 34 0.91 0.63*1.27<br />
39 Beverage workers 2 1.37 [0.13] 0.00 [0.02] 0.00 1 12.82 [0.84] 0.00 3 1.19 0.24*3.47<br />
40 Tobacco workers [0.25] 0.00 [0.03] 0.00 [0.00] 0.00 [0.11] 0.00 [0.07] 0.00 [0.45] 0.00 0.00*8.16<br />
41 Glass makers etc 7 0.95 2 0.66 1 5.49 5 1.44 7 0.44 22 0.73 0.46*1.11<br />
42 Packers 3 0.46 13 2.14 [0.57] 0.00 8 0.74 27 0.93 51 0.96 0.72*1.27<br />
43 Engine operators 3 0.45 7 0.81 2 2.55 4 0.66 13 0.54 29 0.63 0.42*0.90<br />
44 Public safety workers 8 1.28 4 0.83 2 3.54 10 2.13 18 1.28 42 1.38 0.99*1.86<br />
45 Cooks <strong>and</strong> stewards 2 4.35 1 3.10 1 3.76 6 2.97 1 0.40 11 1.97 0.98*3.52<br />
46 Domestic assistants [0.01] 0.00 [0.02] 0.00 [0.00] 0.00 [0.02] 0.00 [0.22] 0.00 [0.27] 0.00 0.00*13.86<br />
47 Waiters 1 1.07 [0.32] 0.00 [0.03] 0.00 4 4.59 1 0.78 6 1.74 0.64*3.79<br />
48 Building caretakers 13 1.97 7 1.78 [0.24] 0.00 1 0.42 18 1.58 39 1.59 1.13*2.17<br />
49 Chimney sweeps [0.17] 0.00 [0.28] 0.00 [0.24] 0.00 1 1.25 1 0.67 0.02*3.74<br />
50 Hairdressers 2 1.06 [0.09] 0.00 [0.04] 0.00 2 2.95 3 1.05 7 1.26 0.51*2.60<br />
51 Launderers [0.95] 0.00 [0.09] 0.00 [0.02] 0.00 [0.41] 0.00 3 1.47 3 0.86 0.18*2.50<br />
52 Military personnel 4 1.24 2 1.16 4 1.05 7 0.85 17 1.00 0.58*1.60<br />
53 ‘‘Other workers’’ 26 1.33 7 1.50 2 0.91 23 1.11 26 0.74 84 1.02 0.81*1.26<br />
54 Economically inactive 21 1.18 29 1.16 3 1.84 12 1.06 76 1.40 141 1.28 1.09*1.51<br />
1 54 All categories 486 1.00 294 1.00 27 1.00 402 1.00 1 127 1.00 2 336 1.00 Ref.<br />
Obs observed number of cases; SIR st<strong>and</strong>ardised incidence ratio; 95% CI 95% confidence interval.<br />
<strong>Occupation</strong> <strong>and</strong> <strong>cancer</strong> in Nordic countries 707
Acta Oncol Downloaded from informahealthcare.com by 212.35.100.66 on 04/06/11<br />
For personal use only.<br />
708 E. Pukkala et al.<br />
resses, although these studies did not take HPV<br />
infection into account. There is a possibility that<br />
participation in the screening programmes varies by<br />
occupational category.<br />
Corpus uteri endometrial <strong>cancer</strong><br />
Incidence of <strong>cancer</strong> of the corpus uteri in the Nordic<br />
countries has been increasing steadily during<br />
the last decades, <strong>and</strong> currently SIRs are rather<br />
similar in all Nordic countries (Figure 31).<br />
Artistic workers (SIR 1.22, 95% CI 1.07 1.40),<br />
journalists (1.23, 0.99 1.51) <strong>and</strong> dentists (1.24,<br />
1.00 1.51) had the highest risk of <strong>cancer</strong> of corpus<br />
uteri, while female beverage workers <strong>and</strong> drivers<br />
presented the lowest risk, respectively (0.68, 0.47<br />
0.96 <strong>and</strong> 0.69 0.56 0.84) (Table 42).<br />
Comment. The differences between occupations with<br />
low <strong>and</strong> high risks were very small, <strong>and</strong> no real<br />
patterns emerged in our analysis. Endometrial can-<br />
/ 100 000<br />
30<br />
25<br />
20<br />
15<br />
10<br />
5<br />
Women<br />
Denmark<br />
Finl<strong>and</strong><br />
Icel<strong>and</strong><br />
Norway<br />
Sweden<br />
0<br />
1945 1960 1975 1990 2005<br />
Figure 30. Age st<strong>and</strong>ardised (World) incidence rates for <strong>cancer</strong> of the cervix uteri 1943 2005, by country. Modified from NORDCAN<br />
[49].<br />
/ 100 000<br />
10<br />
5<br />
0<br />
Denmark<br />
Finl<strong>and</strong><br />
Icel<strong>and</strong><br />
Norway<br />
Sweden<br />
cer is clearly associated with obesity <strong>and</strong> the use of<br />
hormone replacement therapy, in particular when<br />
estrogens are administered without concomitant use<br />
of progestins, or when progestins are not added to<br />
estrogens during all days of the month [99,100].<br />
Smoking decreases risk. So far, no occupational or<br />
environmental risk factors for endometrial <strong>cancer</strong><br />
have been identified, <strong>and</strong> in this sense, it is not at<br />
all surprising that we did not find work related<br />
associations.<br />
Choriocarcinoma<br />
There were only 127 cases of choriocarcinoma in<br />
all Nordic countries during the entire followup<br />
period (http://astra.<strong>cancer</strong>.fi/NOCCA/Incidence/<br />
choriocarcinoma).<br />
No occupations were identified with high or low<br />
risk for choriocarcinoma. Many of the observations<br />
of choriocarcinoma were done in economically<br />
inactive women (54 cases) who presented a weak<br />
Women<br />
1945 1960 1975 1990 2005<br />
Figure 31. Age st<strong>and</strong>ardised (World) incidence rates for <strong>cancer</strong> of the corpus uteri 1943 2005, by country. Modified from NORDCAN
Acta Oncol Downloaded from informahealthcare.com by 212.35.100.66 on 04/06/11<br />
For personal use only.<br />
Table 40. Observed number of breast <strong>cancer</strong> among women in the Nordic countries <strong>and</strong> st<strong>and</strong>ardised incidence ratios 1961 2005, by<br />
country <strong>and</strong> occupational category.<br />
Denmark Finl<strong>and</strong> Icel<strong>and</strong> Norway Sweden Total<br />
No <strong>Occupation</strong>al category Obs SIR Obs SIR Obs SIR Obs SIR Obs SIR Obs SIR 95% CI<br />
1 Technical workers, etc 248 1.23 771 1.32 8 0.94 156 1.36 1 130 1.18 2 313 1.24 1.19*1.29<br />
2 Laboratory assistants 192 1.21 358 1.18 15 1.25 167 1.29 457 1.20 1 189 1.21 1.14*1.28<br />
3 Physicians 108 1.61 211 1.41 1 0.57 66 1.23 316 1.28 702 1.35 1.25*1.45<br />
4 Dentists 102 1.74 184 1.57 1 1.31 53 1.26 198 1.24 538 1.42 1.31*1.55<br />
5 Nurses 1 324 1.13 2 024 1.31 60 1.17 1 153 1.13 3 121 1.14 7 682 1.18 1.15*1.20<br />
6 Assistant nurses 809 0.92 1 300 0.94 63 0.91 923 0.94 4 965 0.96 8 060 0.95 0.93*0.97<br />
7 ‘‘Other health workers’’ 835 1.25 1 367 1.18 19 1.21 1 008 1.05 2 019 1.13 5 248 1.14 1.11*1.17<br />
8 Teachers 1 971 1.27 3 467 1.35 109 1.16 2 231 1.16 7 537 1.18 15 315 1.22 1.20*1.24<br />
9 Religious workers etc 230 1.14 1 918 1.19 20 1.47 570 1.21 2 822 1.18 5 560 1.19 1.16*1.22<br />
10 Artistic workers 130 1.32 300 1.30 10 0.90 166 1.22 515 1.24 1 121 1.26 1.18*1.33<br />
11 Journalists 34 1.51 181 1.29 5 1.63 53 1.36 277 1.38 550 1.36 1.25*1.48<br />
12 Administrators 784 1.35 689 1.40 8 1.05 563 1.26 1 123 1.19 3 167 1.28 1.24*1.33<br />
13 Clerical workers 7 672 1.25 10 490 1.20 343 1.24 6 903 1.21 17 656 1.17 43 064 1.20 1.19*1.21<br />
14 Sales agents 63 1.19 1 171 1.07 32 1.21 813 1.16 2 073 1.09 4 152 1.10 1.06*1.13<br />
15 Shop workers 4 067 1.03 4 049 1.01 157 0.96 4 309 1.00 7 611 0.99 20 193 1.00 0.99*1.02<br />
16 Farmers 2 001 0.71 1 489 0.79 90 0.82 2 176 0.82 697 0.89 6 453 0.78 0.76*0.80<br />
17 Gardeners 283 0.79 4 230 0.74 4 1.07 1 184 0.75 1 599 0.83 7 300 0.76 0.74*0.78<br />
18 Fishermen 8 0.55 7 0.47 7 1.49 17 0.74 5 0.72 44 0.69 0.50*0.92<br />
19 Forestry workers 4 1.05 22 0.73 [0.59] 0.00 19 0.62 40 0.84 85 0.75 0.60*0.93<br />
20 Miners <strong>and</strong> quarry workers [0.23] 0.00 14 1.32 [0.07] 0.00 1 0.48 9 0.71 24 0.94 0.60*1.39<br />
21 Seamen 4 0.79 [0.02] 0.00 1 0.18 3 1.39 8 0.63 0.27*1.23<br />
22 Transport workers 2 0.51 217 1.30 6 1.45 34 1.22 139 0.96 398 1.15 1.04*1.27<br />
23 Drivers 78 0.77 74 0.69 1 0.43 84 0.88 331 0.84 568 0.81 0.75*0.88<br />
24 Postal workers 207 1.01 1 204 1.05 44 0.84 1 170 1.11 2 566 1.09 5 191 1.08 1.05*1.11<br />
25 Textile workers 1 243 0.94 2 519 1.01 85 1.01 1 538 1.02 3 957 0.99 9 342 0.99 0.97*1.01<br />
26 Shoe <strong>and</strong> leather workers 103 1.04 334 1.08 9 1.92 88 0.81 307 0.99 841 1.01 0.94*1.08<br />
27 Smelting workers 17 0.70 55 0.77 1 4.23 16 1.03 100 0.88 189 0.84 0.73*0.97<br />
28 Mechanics 213 0.86 306 0.85 2 1.87 152 1.05 1 041 0.95 1 714 0.93 0.88*0.97<br />
29 Plumbers 1 0.51 1 0.97 [1.15] 0.00 4 1.69 6 0.92 0.34*2.01<br />
30 Welders 22 0.65 [0.12] 0.00 10 0.76 42 0.82 74 0.75 0.59*0.95<br />
31 Electrical workers 338 0.97 271 0.95 1 1.22 167 1.04 568 0.92 1 345 0.95 0.90*1.00<br />
32 Wood workers 89 0.79 439 0.73 1 0.60 58 1.07 138 0.71 725 0.75 0.70*0.81<br />
33 Painters 6 1.41 71 0.93 [0.49] 0.00 14 1.19 41 0.84 132 0.93 0.78*1.10<br />
34 ‘‘Other construction workers’’ [3.23] 0.00 190 0.90 [0.31] 0.00 2 0.42 8 0.96 200 0.88 0.76*1.01<br />
35 Bricklayers 1 1.52 3 0.35 [0.27] 0.00 [0.30] 0.00 4 0.41 0.11*1.05<br />
36 Printers 157 1.24 386 1.13 6 0.74 192 1.37 468 1.08 1 209 1.15 1.09*1.22<br />
37 Chemical process workers 187 0.96 146 0.90 2 0.62 108 0.88 283 0.88 726 0.90 0.84*0.97<br />
38 Food workers 800 0.82 689 0.85 164 0.84 628 0.85 796 0.90 3 077 0.86 0.83*0.89<br />
39 Beverage workers 90 1.02 44 1.03 1 2.26 6 0.86 54 1.01 195 1.02 0.88*1.17<br />
40 Tobacco workers 137 1.11 21 0.85 25 0.95 39 1.03 222 1.04 0.92*1.19<br />
41 Glass makers etc 207 0.85 510 0.84 4 0.74 260 0.99 825 0.94 1 806 0.91 0.87*0.95<br />
42 Packers 62 0.91 1 007 0.95 16 0.92 588 0.97 1 199 0.95 2 872 0.95 0.92*0.99<br />
43 Engine operators 4 1.65 157 0.86 [0.28] 0.00 11 1.01 83 0.75 255 0.83 0.73*0.94<br />
44 Public safety workers 7 1.09 65 1.36 6 1.73 81 1.12 158 1.01 317 1.11 0.99*1.24<br />
45 Cooks <strong>and</strong> stewards 3 1.20 1 158 0.95 70 1.09 787 0.98 1 675 0.99 3 693 0.98 0.94*1.01<br />
46 Domestic assistants 1 316 0.89 1 346 0.92 19 1.09 2 003 0.93 5 226 0.93 9 910 0.93 0.91*0.94<br />
47 Waiters 297 1.16 1 072 0.96 9 1.11 948 1.01 1 745 0.98 4 071 0.99 0.96*1.03<br />
48 Building caretakers 3 692 0.87 3 291 0.83 102 0.76 3 404 0.86 4 463 0.87 14 952 0.86 0.84*0.87<br />
49 Chimney sweeps [0.36] 0.00 1 0.51 [0.49] 0.00 [0.23] 0.00 1 0.33 0.01*1.84<br />
50 Hairdressers 300 1.10 432 0.99 9 0.90 265 1.02 977 1.09 1 983 1.06 1.01*1.10<br />
51 Launderers 426 0.90 250 0.88 16 0.84 257 0.79 808 0.93 1 757 0.89 0.85*0.94<br />
52 Military personnel 5 2.06 10 1.52 3 2.00 8 1.32 26 1.57 1.03*2.30<br />
53 ‘‘Other workers’’ 1 270 1.04 1 213 0.92 145 0.99 2 029 0.96 2 165 0.92 6 822 0.95 0.93*0.98<br />
54 Economically inactive 30 068 0.97 22 004 0.96 491 0.98 25 539 0.99 87 868 0.96 165 970 0.97 0.96*0.97<br />
1 54 All categories 62 191 1.00 73 754 1.00 2 162 1.00 62 999 1.00 172 255 1.00 373 361 1.00 Ref.<br />
Obs observed number of cases; SIR st<strong>and</strong>ardised incidence ratio; 95% CI 95% confidence interval.<br />
<strong>Occupation</strong> <strong>and</strong> <strong>cancer</strong> in Nordic countries 709
Acta Oncol Downloaded from informahealthcare.com by 212.35.100.66 on 04/06/11<br />
For personal use only.<br />
710 E. Pukkala et al.<br />
Table 41. Observed number of <strong>cancer</strong> of the cervix uteri among women in the Nordic countries <strong>and</strong> st<strong>and</strong>ardised incidence ratios 1961<br />
2005, by country <strong>and</strong> occupational category.<br />
Denmark Finl<strong>and</strong> Icel<strong>and</strong> Norway Sweden Total<br />
No <strong>Occupation</strong>al category Obs SIR Obs SIR Obs SIR Obs SIR Obs SIR Obs SIR 95% CI<br />
1 Technical workers, etc 34 0.96 28 0.96 [1.01] 0.00 21 1.10 89 0.80 172 0.88 0.75*1.02<br />
2 Laboratory assistants 21 0.76 15 1.00 3 2.29 14 0.66 38 1.00 91 0.88 0.71*1.08<br />
3 Physicians 5 0.43 5 0.68 [0.18] 0.00 2 0.22 21 0.78 33 0.59 0.41*0.83<br />
4 Dentists 3 0.29 5 0.72 [0.07] 0.00 4 0.54 9 0.48 21 0.48 0.30*0.74<br />
5 Nurses 101 0.50 47 0.62 6 1.18 102 0.65 214 0.68 470 0.62 0.57*0.68<br />
6 Assistant nurses 166 1.08 61 0.81 5 0.69 140 0.96 607 1.05 979 1.02 0.96*1.09<br />
7 ‘‘Other health workers’’ 56 0.48 41 0.66 1 0.60 116 0.76 161 0.81 375 0.70 0.64*0.78<br />
8 Teachers 151 0.57 75 0.55 8 0.81 175 0.55 436 0.63 845 0.59 0.55*0.63<br />
9 Religious workers etc 26 0.74 55 0.73 1 0.71 46 0.61 184 0.69 312 0.69 0.62*0.77<br />
10 Artistic workers 20 1.17 13 1.11 1 0.96 14 0.61 51 1.07 99 0.98 0.80*1.20<br />
11 Journalists 3 0.75 8 1.10 1 3.41 6 0.94 23 1.03 41 1.01 0.73*1.38<br />
12 Administrators 100 0.97 25 0.98 [0.64] 0.00 74 1.05 118 1.12 317 1.04 0.93*1.16<br />
13 Clerical workers 975 0.90 446 0.99 27 0.97 815 0.85 1 746 1.02 4 009 0.95 0.92*0.98<br />
14 Sales agents 12 1.28 52 0.78 4 1.72 108 0.94 271 1.18 447 1.06 0.96*1.16<br />
15 Shop workers 710 1.02 224 1.00 19 1.23 692 1.00 1 141 1.19 2 786 1.07 1.04*1.12<br />
16 Farmers 238 0.49 144 0.93 2 0.22 246 0.61 55 0.62 685 0.60 0.55*0.64<br />
17 Gardeners 44 0.70 287 0.71 [0.34] 0.00 147 0.60 154 0.65 632 0.66 0.61*0.72<br />
18 Fishermen 2 0.78 [0.94] 0.00 [0.46] 0.00 8 2.35 2 2.42 12 1.47 0.76*2.56<br />
19 Forestry workers 1 1.48 [1.66] 0.00 [0.06] 0.00 8 1.71 8 1.45 17 1.35 0.79*2.17<br />
20 Miners <strong>and</strong> quarry workers [0.04] 0.00 2 2.63 [0.01] 0.00 1 3.25 1 0.75 4 1.63 0.44*4.16<br />
21 Seamen 1 3.80 [0.00] 0.00 [0.86] 0.00 [0.25] 0.00 1 0.72 0.02*4.04<br />
22 Transport workers [0.70] 0.00 18 1.60 [0.33] 0.00 4 0.83 25 1.31 47 1.30 0.96*1.73<br />
23 Drivers 22 1.21 11 2.03 [0.22] 0.00 23 1.58 66 1.55 122 1.51 1.26*1.80<br />
24 Postal workers 31 0.85 50 0.72 2 0.45 158 0.88 255 0.89 496 0.86 0.79*0.94<br />
25 Textile workers 298 1.26 180 1.16 6 0.87 284 1.08 586 1.10 1 354 1.13 1.07*1.19<br />
26 Shoe <strong>and</strong> leather workers 24 1.35 18 0.95 [0.41] 0.00 26 1.32 64 1.51 132 1.33 1.12*1.58<br />
27 Smelting workers 11 2.51 3 0.68 [0.02] 0.00 4 1.78 16 1.27 34 1.43 0.99*2.01<br />
28 Mechanics 68 1.52 20 0.98 [0.09] 0.00 28 1.11 161 1.25 277 1.26 1.12*1.42<br />
29 Plumbers [0.32] 0.00 [0.05] 0.00 [0.17] 0.00 [0.24] 0.00 [0.78] 0.00 0.00*4.72<br />
30 Welders 1 0.62 [0.01] 0.00 5 2.46 6 1.10 12 1.31 0.68*2.30<br />
31 Electrical workers 100 1.59 16 1.14 [0.08] 0.00 46 1.62 91 1.23 253 1.41 1.25*1.59<br />
32 Wood workers 29 1.43 51 1.31 [0.17] 0.00 5 0.61 24 1.09 109 1.22 1.01*1.47<br />
33 Painters [0.77] 0.00 10 2.14 [0.05] 0.00 2 1.04 6 1.04 18 1.36 0.81*2.15<br />
34 ‘‘Other construction workers’’ 1 1.71 33 2.07 [0.03] 0.00 [0.67] 0.00 [0.86] 0.00 34 1.88 1.30*2.63<br />
35 Bricklayers [0.12] 0.00 2 4.12 1 25.25 [0.03] 0.00 3 4.45 0.92*13.00<br />
36 Printers 32 1.41 20 0.97 1 1.27 36 1.47 61 1.14 150 1.23 1.05*1.44<br />
37 Chemical process workers 61 1.73 9 0.89 [0.28] 0.00 35 1.62 45 1.11 150 1.39 1.18*1.63<br />
38 Food workers 263 1.51 49 0.94 21 1.15 141 1.16 132 1.16 606 1.26 1.17*1.37<br />
39 Beverage workers 31 1.90 5 1.69 [0.04] 0.00 2 1.86 17 2.42 55 2.01 1.51*2.61<br />
40 Tobacco workers 38 1.67 [1.61] 0.00 7 1.36 8 1.66 53 1.54 1.16*2.02<br />
41 Glass makers etc 70 1.60 50 1.36 3 5.94 58 1.25 147 1.36 328 1.39 1.25*1.55<br />
42 Packers 15 1.23 100 1.55 1 0.66 130 1.27 222 1.39 468 1.38 1.26*1.51<br />
43 Engine operators [0.44] 0.00 13 1.23 [0.03] 0.00 3 1.82 13 1.13 29 1.20 0.80*1.72<br />
44 Public safety workers [1.21] 0.00 3 1.12 1 3.01 12 1.20 19 1.05 35 1.08 0.75*1.50<br />
45 Cooks <strong>and</strong> stewards 1 2.23 76 0.99 8 1.44 168 1.29 290 1.33 543 1.26 1.16*1.37<br />
46 Domestic assistants 285 1.08 79 0.92 1 0.70 340 0.98 779 1.17 1 484 1.09 1.04*1.15<br />
47 Waiters 106 2.26 102 1.61 1 1.26 239 1.54 368 1.59 816 1.64 1.53*1.75<br />
48 Building caretakers 990 1.30 359 1.38 9 0.79 810 1.33 937 1.54 3 105 1.38 1.34*1.43<br />
49 Chimney sweeps [0.05] 0.00 [0.13] 0.00 [0.07] 0.00 [0.02] 0.00 [0.28] 0.00 0.00*13.29<br />
50 Hairdressers 52 1.10 34 1.37 [1.18] 0.00 48 1.03 148 1.36 282 1.23 1.10*1.38<br />
51 Launderers 85 1.00 27 1.34 [1.49] 0.00 73 1.36 147 1.27 332 1.20 1.08*1.34<br />
52 Military personnel 1 2.27 1 4.22 [0.21] 0.00 [0.61] 0.00 2 1.33 0.16*4.82<br />
53 ‘‘Other workers’’ 280 1.28 96 1.18 19 1.40 341 1.01 378 1.33 1 114 1.19 1.12*1.26<br />
54 Economically inactive 5 446 0.99 1 846 1.02 51 1.10 4 944 1.05 11 170 0.94 23 457 0.98 0.97*0.99<br />
1 54 All categories 11 008 1.00 4 816 1.00 202 1.00 10 712 1.00 21 510 1.00 48 248 1.00 Ref.<br />
Obs observed number of cases; SIR st<strong>and</strong>ardised incidence ratio; 95% CI 95% confidence interval.
Acta Oncol Downloaded from informahealthcare.com by 212.35.100.66 on 04/06/11<br />
For personal use only.<br />
Table 42. Observed number of <strong>cancer</strong> of the corpus uteri among women in the Nordic countries <strong>and</strong> st<strong>and</strong>ardised incidence ratios 1961<br />
2005, by country <strong>and</strong> occupational category.<br />
Denmark Finl<strong>and</strong> Icel<strong>and</strong> Norway Sweden Total<br />
No <strong>Occupation</strong>al category Obs SIR Obs SIR Obs SIR Obs SIR Obs SIR Obs SIR 95% CI<br />
1 Technical workers, etc 54 1.10 100 1.11 [1.12] 0.00 29 1.23 188 1.04 371 1.07 0.97*1.19<br />
2 Laboratory assistants 31 0.88 57 1.04 1 0.57 35 1.24 44 0.89 168 0.99 0.85*1.15<br />
3 Physicians 24 1.44 25 1.13 [0.29] 0.00 17 1.50 44 1.06 110 1.19 0.99*1.44<br />
4 Dentists 15 1.02 44 1.85 [0.13] 0.00 9 0.97 30 0.95 98 1.24 1.00*1.51<br />
5 Nurses 326 1.14 315 1.14 7 0.84 210 0.94 587 1.09 1 445 1.08 1.03*1.14<br />
6 Assistant nurses 178 0.85 258 0.89 8 0.74 229 1.03 915 0.95 1 588 0.93 0.89*0.98<br />
7 ‘‘Other health workers’’ 215 1.29 263 1.18 2 0.86 219 1.01 288 0.90 987 1.06 1.00*1.13<br />
8 Teachers 414 1.14 607 1.21 15 1.03 457 1.10 1 295 1.06 2 788 1.11 1.07*1.15<br />
9 Religious workers etc 61 1.23 278 1.22 5 2.29 132 1.29 433 1.12 909 1.18 1.10*1.26<br />
10 Artistic workers 30 1.21 50 1.29 5 2.74 31 1.03 96 1.23 212 1.22 1.07*1.40<br />
11 Journalists 8 1.48 36 1.40 [0.49] 0.00 9 1.06 41 1.13 94 1.23 0.99*1.51<br />
12 Administrators 179 1.18 105 1.29 4 2.69 116 1.20 181 1.06 585 1.17 1.08*1.27<br />
13 Clerical workers 1 762 1.18 1 824 1.13 36 0.82 1 429 1.09 3 353 1.08 8 404 1.11 1.09*1.13<br />
14 Sales agents 19 1.39 244 1.07 3 0.62 183 1.13 406 1.02 855 1.06 0.99*1.13<br />
15 Shop workers 1 041 1.03 846 0.94 34 1.20 1 039 0.99 1 895 1.02 4 855 1.00 0.97*1.03<br />
16 Farmers 614 0.85 425 0.91 19 0.91 645 1.01 157 1.03 1 860 0.93 0.89*0.98<br />
17 Gardeners 81 0.86 1 427 0.94 2 2.90 349 0.90 506 1.04 2 365 0.95 0.91*0.99<br />
18 Fishermen 2 0.55 5 1.56 1 1.35 3 0.56 [1.50] 0.00 11 0.76 0.38*1.36<br />
19 Forestry workers 2 2.09 1 0.15 [0.10] 0.00 11 1.41 11 1.04 25 0.96 0.62*1.42<br />
20 Miners <strong>and</strong> quarry workers [0.04] 0.00 1 0.36 [0.02] 0.00 [0.44] 0.00 1 0.38 2 0.34 0.04*1.22<br />
21 Seamen [0.84] 0.00 [0.00] 0.00 [1.29] 0.00 [0.28] 0.00 [2.42] 0.00 0.00*1.53<br />
22 Transport workers 1 1.00 52 1.23 1 1.33 10 1.63 33 1.14 97 1.22 0.99*1.49<br />
23 Drivers 17 0.68 15 0.75 2 5.47 13 0.60 52 0.68 99 0.69 0.56*0.84<br />
24 Postal workers 61 1.15 265 1.01 5 0.51 247 1.00 614 1.13 1 192 1.07 1.01*1.13<br />
25 Textile workers 314 0.93 585 1.01 16 0.94 339 0.94 1 025 1.00 2 279 0.98 0.94*1.02<br />
26 Shoe <strong>and</strong> leather workers 28 1.12 80 1.09 [0.89] 0.00 25 0.94 91 1.13 224 1.09 0.95*1.24<br />
27 Smelting workers 9 1.51 19 1.10 [0.05] 0.00 1 0.29 21 0.88 50 0.99 0.73*1.30<br />
28 Mechanics 58 0.97 63 0.82 [0.17] 0.00 24 0.69 220 0.94 365 0.90 0.81*1.00<br />
29 Plumbers [0.56] 0.00 [0.17] 0.00 1 3.61 [0.32] 0.00 1 0.76 0.02*4.21<br />
30 Welders 5 0.83 [0.01] 0.00 1 0.35 10 1.12 16 0.90 0.51*1.45<br />
31 Electrical workers 87 1.04 37 0.74 [0.14] 0.00 35 0.91 115 0.89 274 0.91 0.81*1.02<br />
32 Wood workers 32 1.13 140 0.93 [0.29] 0.00 16 1.25 36 0.93 224 0.97 0.85*1.11<br />
33 Painters [1.00] 0.00 17 0.93 [0.07] 0.00 6 2.09 8 0.78 31 0.96 0.65*1.36<br />
34 ‘‘Other construction workers’’ [0.78] 0.00 53 0.91 [0.04] 0.00 3 2.79 [1.22] 0.00 56 0.91 0.69*1.18<br />
35 Bricklayers [0.17] 0.00 1 0.48 [0.07] 0.00 [0.04] 0.00 1 0.43 0.01*2.38<br />
36 Printers 27 0.87 63 0.85 1 0.71 33 1.01 99 1.04 223 0.95 0.83*1.08<br />
37 Chemical process workers 38 0.77 25 0.65 1 1.54 24 0.82 82 1.09 170 0.88 0.76*1.03<br />
38 Food workers 211 0.86 206 1.04 20 0.57 152 0.85 206 0.96 795 0.91 0.85*0.97<br />
39 Beverage workers 14 0.63 8 0.72 [0.09] 0.00 3 1.76 8 0.60 33 0.68 0.47*0.96<br />
40 Tobacco workers 26 0.85 5 0.80 6 0.95 12 1.28 49 0.93 0.69*1.23<br />
41 Glass makers etc 67 1.14 130 0.93 1 1.09 63 0.98 168 0.82 429 0.92 0.83*1.01<br />
42 Packers 11 0.64 219 0.87 2 0.59 156 1.04 310 1.05 698 0.97 0.90*1.05<br />
43 Engine operators 1 2.22 44 1.08 [0.04] 0.00 2 0.84 12 0.58 59 0.92 0.70*1.18<br />
44 Public safety workers 3 1.69 7 0.82 [0.65] 0.00 15 0.90 19 0.82 44 0.87 0.63*1.16<br />
45 Cooks <strong>and</strong> stewards 2 3.18 262 0.98 13 1.01 202 1.06 413 1.04 892 1.03 0.96*1.10<br />
46 Domestic assistants 363 0.95 286 1.06 4 1.07 529 1.03 1 150 1.06 2 332 1.03 0.99*1.08<br />
47 Waiters 47 0.74 203 0.86 [1.45] 0.00 194 0.86 361 0.82 805 0.83 0.78*0.89<br />
48 Building caretakers 985 0.91 812 0.89 35 1.31 899 0.93 1 046 0.92 3 777 0.92 0.89*0.95<br />
49 Chimney sweeps [0.11] 0.00 1 1.88 [0.13] 0.00 [0.02] 0.00 1 1.26 0.03*7.03<br />
50 Hairdressers 80 1.26 93 1.07 1 0.71 57 0.96 192 0.98 423 1.04 0.95*1.14<br />
51 Launderers 110 0.89 65 0.88 5 1.20 57 0.72 200 0.91 437 0.87 0.80*0.96<br />
52 Military personnel 1 1.49 [0.91] 0.00 [0.32] 0.00 [0.72] 0.00 1 0.38 0.01*2.13<br />
53 ‘‘Other workers’’ 298 0.97 262 0.92 27 1.01 447 0.90 512 1.00 1 546 0.95 0.90*1.00<br />
54 Economically inactive 7 676 0.98 5 807 0.99 111 1.19 5 821 1.00 22 847 0.99 42 262 0.99 0.98*1.00<br />
1 54 All categories 15 623 1.00 16 741 1.00 387 1.00 14 533 1.00 40 333 1.00 87 617 1.00 Ref.<br />
Obs observed number of cases; SIR st<strong>and</strong>ardised incidence ratio; 95% CI 95% confidence interval.<br />
<strong>Occupation</strong> <strong>and</strong> <strong>cancer</strong> in Nordic countries 711
Acta Oncol Downloaded from informahealthcare.com by 212.35.100.66 on 04/06/11<br />
For personal use only.<br />
712 E. Pukkala et al.<br />
non-significant elevated risk, <strong>and</strong> in clerical workers<br />
(11 cases) with a presentation of non-significant<br />
decreased risk.<br />
Comment. No previous study has identified occupational<br />
or environmental risk factors for choriocarcinoma.<br />
This is a rare type of malignancy, <strong>and</strong><br />
epidemiological studies are scarce, but there are<br />
indications that increasing maternal age <strong>and</strong> family<br />
history increase risk. All other hypothesised risk<br />
factors (use of oral contraceptives, HPV infections,<br />
smoking <strong>and</strong> alcohol use, paternal age, parity,<br />
endogenous hormone factors, history of other <strong>cancer</strong>s)<br />
are inconsistently related to risk [101]. We are<br />
not aware of studies on risk of choriocarcinoma<br />
according to occupational categories. Given the way<br />
our database was constructed we could only count<br />
incidence rates by women (<strong>and</strong> not by pregnancy<br />
which would be more appropriate).<br />
Ovarian <strong>cancer</strong><br />
Incidence of ovarian <strong>cancer</strong>, excluding borderline<br />
tumours, in the Nordic countries in the 1960s<br />
<strong>and</strong> 1970s was between 10 <strong>and</strong> 15 per 100 000,<br />
but rates have decreased in the last decades<br />
(Figure 32).<br />
There was a somewhat increased risk of ovarian<br />
<strong>cancer</strong>, excluding borderline tumours, among printers<br />
SIR 1.25 (95% CI 1.11 1.41) <strong>and</strong> hairdressers<br />
(1.16, 1.05 1.27) in the study population. None of<br />
the occupational categories showed a markedly<br />
lowered risk of ovarian <strong>cancer</strong> (Table 43).<br />
For borderline ovarian tumours (http://astra.<br />
<strong>cancer</strong>.fi/NOCCA/Incidence/ovary-borderline), the<br />
highest SIRs were observed among women working<br />
as printers (1.50, 1.09 2.01), mechanics (1.40,<br />
/ 100 000<br />
15<br />
10<br />
5<br />
Denmark<br />
Finl<strong>and</strong><br />
Icel<strong>and</strong><br />
Norway<br />
0<br />
Sweden<br />
1945 1960 1975 1990 2005<br />
1.10 1.75), postal workers (1.24, 1.07 1.44), cooks<br />
<strong>and</strong> stewards (1.21, 1.01 1.44). The lowest SIRs<br />
were found among physicians (0.45, 0.19 0.89),<br />
laboratory assistants (0.59, 0.36 0.91) <strong>and</strong> gardeners<br />
(0.80, 0.70 0.92).<br />
Comment. Increased risk of ovarian <strong>cancer</strong> is associated<br />
with reproductive factors leading to incessant<br />
ovulation [102]. Previous studies have also found<br />
indications of elevated risks associated with aromatic<br />
hydrocarbon solvents, leather dust, man-made vitreous<br />
fibres, asbestos <strong>and</strong> diesel, gasoline <strong>and</strong> engine<br />
exhausts. Female hairdressers <strong>and</strong> printers have also<br />
been previously reported to be at increased risk of<br />
ovarian <strong>cancer</strong> [87,103]. In this study the occupational<br />
variation of ovarian <strong>cancer</strong> incidence was<br />
small. In most epidemiological studies borderline<br />
ovarian tumours have the same risk factors as invasive<br />
ovarian <strong>cancer</strong>. So far no occupational study has<br />
accessed the risk of borderline tumours. The findings<br />
in our study suggest that borderline ovarian tumours<br />
may share the same occupational risk factors that<br />
have been suggested for invasive ovarian <strong>cancer</strong>.<br />
Fallopian tube <strong>cancer</strong>s<br />
Primary fallopian tube carcinoma is very rare. In<br />
Western countries, it accounts for about 1% of all<br />
female genital malignant tumours.<br />
Derived from six cases only, a significant fourfold<br />
risk of fallopian tube <strong>cancer</strong> was shown in smelting<br />
workers SIR 4.00 (95% CI 1.47 8.70). The other<br />
work groups with a high SIR were artistic workers,<br />
hairdressers, packers <strong>and</strong> nurses (Table 44). Farming<br />
was the occupation with the lowest risk (0.67,<br />
0.47 0.94).<br />
Comment. The aetiology of fallopian tube <strong>cancer</strong><br />
remains poorly known. The few existing studies<br />
Women<br />
Figure 32. Age st<strong>and</strong>ardised (World) incidence rates for ovarian <strong>cancer</strong> 1943 2005, by country. Modified from NORDCAN [49].
Acta Oncol Downloaded from informahealthcare.com by 212.35.100.66 on 04/06/11<br />
For personal use only.<br />
Table 43. Observed number of ovarian <strong>cancer</strong> among women in the Nordic countries <strong>and</strong> st<strong>and</strong>ardised incidence ratios 1961 2005, by<br />
country <strong>and</strong> occupational category.<br />
Denmark Finl<strong>and</strong> Icel<strong>and</strong> Norway Sweden Total<br />
No <strong>Occupation</strong>al category Obs SIR Obs SIR Obs SIR Obs SIR Obs SIR Obs SIR 95% CI<br />
1 Technical workers, etc 63 1.51 63 0.89 1 1.03 26 1.13 219 1.10 372 1.11 1.00*1.23<br />
2 Laboratory assistants 37 1.18 49 1.24 [1.42] 0.00 22 0.80 52 0.76 160 0.95 0.82*1.11<br />
3 Physicians 9 0.66 18 1.02 [0.25] 0.00 15 1.32 40 0.82 82 0.90 0.71*1.11<br />
4 Dentists 12 1.00 18 1.07 [0.10] 0.00 4 0.43 32 0.95 66 0.92 0.71*1.17<br />
5 Nurses 258 1.09 195 0.98 9 1.34 206 0.97 565 0.98 1 233 1.00 0.95*1.06<br />
6 Assistant nurses 180 1.00 191 0.96 11 1.21 199 0.96 1 043 0.99 1 624 0.98 0.94*1.03<br />
7 ‘‘Other health workers’’ 153 1.13 163 1.03 4 2.09 219 1.05 354 0.98 893 1.03 0.97*1.10<br />
8 Teachers 365 1.19 395 1.12 7 0.59 407 1.00 1 264 0.96 2 438 1.02 0.98*1.06<br />
9 Religious workers etc 39 0.95 219 1.18 2 1.10 89 0.90 487 1.04 836 1.05 0.98*1.12<br />
10 Artistic workers 31 1.53 36 1.23 [1.44] 0.00 29 0.97 91 1.06 187 1.12 0.97*1.30<br />
11 Journalists 2 0.43 24 1.29 [0.39] 0.00 6 0.73 39 0.96 71 0.98 0.76*1.23<br />
12 Administrators 139 1.13 62 0.99 2 1.76 106 1.10 192 1.00 501 1.05 0.97*1.15<br />
13 Clerical workers 1 404 1.12 1 245 1.07 26 0.73 1 342 1.05 3 448 1.08 7 465 1.08 1.05*1.10<br />
14 Sales agents 10 0.91 169 1.05 4 1.04 170 1.03 467 1.11 820 1.07 1.00*1.15<br />
15 Shop workers 837 1.01 643 1.07 36 1.59 1 071 1.07 1 935 1.08 4 522 1.07 1.04*1.10<br />
16 Farmers 488 0.85 338 1.03 16 0.97 582 0.93 169 0.99 1 593 0.93 0.88*0.97<br />
17 Gardeners 60 0.81 924 0.92 [0.57] 0.00 365 0.96 436 0.96 1 785 0.94 0.89*0.98<br />
18 Fishermen [2.98] 0.00 2 0.89 [0.59] 0.00 8 1.57 2 1.29 12 0.96 0.50*1.68<br />
19 Forestry workers 3 3.82 2 0.45 [0.08] 0.00 7 0.97 16 1.52 28 1.21 0.81*1.75<br />
20 Miners <strong>and</strong> quarry workers [0.06] 0.00 3 1.64 [0.01] 0.00 [0.42] 0.00 [2.66] 0.00 3 0.60 0.12*1.76<br />
21 Seamen [0.63] 0.00 [0.00] 0.00 [1.22] 0.00 [0.40] 0.00 [2.25] 0.00 0.00*1.64<br />
22 Transport workers 1 1.21 24 0.86 [0.59] 0.00 5 0.83 37 1.17 67 1.00 0.77*1.27<br />
23 Drivers 18 0.84 16 1.12 [0.29] 0.00 21 1.02 85 1.04 140 1.01 0.86*1.20<br />
24 Postal workers 50 1.14 192 1.08 4 0.53 231 0.95 552 1.04 1 029 1.03 0.97*1.09<br />
25 Textile workers 270 0.96 435 1.11 12 0.87 453 1.23 1 046 1.07 2 216 1.09 1.05*1.14<br />
26 Shoe <strong>and</strong> leather workers 24 1.14 41 0.84 [0.72] 0.00 29 1.08 96 1.26 190 1.09 0.95*1.26<br />
27 Smelting workers 5 0.96 5 0.44 [0.04] 0.00 2 0.62 26 1.07 38 0.86 0.61*1.18<br />
28 Mechanics 57 1.08 54 1.02 [0.13] 0.00 28 0.83 251 1.05 390 1.03 0.93*1.14<br />
29 Plumbers 1 2.55 [0.13] 0.00 1 3.98 2 4.64 4 3.33 0.91*8.52<br />
30 Welders 2 0.46 [0.01] 0.00 5 1.88 16 1.57 23 1.33 0.85*2.00<br />
31 Electrical workers 74 1.00 25 0.68 [0.12] 0.00 32 0.86 169 1.26 300 1.06 0.95*1.19<br />
32 Wood workers 31 1.30 80 0.81 [0.24] 0.00 14 1.17 51 1.25 176 1.00 0.86*1.16<br />
33 Painters [0.92] 0.00 8 0.66 [0.06] 0.00 5 1.85 7 0.66 20 0.76 0.46*1.17<br />
34 ‘‘Other construction workers’’ 1 1.41 39 1.02 [0.04] 0.00 1 0.98 [1.54] 0.00 41 0.99 0.71*1.34<br />
35 Bricklayers [0.14] 0.00 [1.33] 0.00 [0.06] 0.00 [0.06] 0.00 [1.59] 0.00 0.00*2.33<br />
36 Printers 23 0.85 67 1.31 1 0.86 42 1.28 128 1.32 261 1.25 1.11*1.41<br />
37 Chemical process workers 47 1.11 41 1.60 [0.51] 0.00 32 1.10 66 0.89 186 1.08 0.94*1.25<br />
38 Food workers 185 0.90 112 0.85 31 1.09 189 1.07 220 1.05 737 0.98 0.91*1.05<br />
39 Beverage workers 21 1.06 3 0.41 1 13.97 3 1.89 6 0.46 34 0.82 0.56*1.14<br />
40 Tobacco workers 22 0.80 4 0.97 10 1.50 15 1.71 51 1.09 0.81*1.43<br />
41 Glass makers etc 54 1.05 118 1.25 [0.75] 0.00 76 1.21 212 1.06 460 1.12 1.03*1.23<br />
42 Packers 10 0.69 188 1.13 4 1.47 154 1.06 332 1.14 688 1.11 1.03*1.19<br />
43 Engine operators 1 2.02 25 0.90 [0.04] 0.00 4 1.80 19 0.86 49 0.93 0.69*1.23<br />
44 Public safety workers 2 1.31 6 0.93 1 1.85 18 1.11 28 0.93 55 1.00 0.76*1.31<br />
45 Cooks <strong>and</strong> stewards [0.53] 0.00 211 1.13 9 0.86 215 1.11 459 1.14 894 1.13 1.06*1.20<br />
46 Domestic assistants 346 1.10 208 1.03 5 1.63 523 1.02 1 230 1.02 2 312 1.03 0.99*1.08<br />
47 Waiters 83 1.48 154 0.94 1 0.84 213 0.97 431 1.02 882 1.02 0.96*1.09<br />
48 Building caretakers 900 0.99 629 1.00 23 1.07 870 0.95 1 131 0.98 3 553 0.98 0.95*1.01<br />
49 Chimney sweeps [0.06] 0.00 1 2.98 [0.12] 0.00 [0.04] 0.00 1 1.79 0.05*9.99<br />
50 Hairdressers 66 1.20 77 1.24 [1.24] 0.00 71 1.19 220 1.12 434 1.16 1.05*1.27<br />
51 Launderers 111 1.09 56 1.14 4 1.17 89 1.13 216 1.02 476 1.07 0.98*1.17<br />
52 Military personnel 2 3.81 1 1.39 [0.29] 0.00 [1.06] 0.00 3 1.15 0.24*3.37<br />
53 ‘‘Other workers’’ 271 1.04 192 0.96 21 0.97 468 0.97 576 1.10 1 528 1.03 0.97*1.08<br />
54 Economically inactive 6 393 0.96 3 765 0.94 79 1.03 6 137 0.97 21 361 0.97 37 735 0.96 0.95*0.97<br />
1 54 All categories 13 159 1.00 11 538 1.00 314 1.0014 814 1.00 39 839 1.00 79 664 1.00 Ref.<br />
Obs observed number of cases; SIR st<strong>and</strong>ardised incidence ratio; 95% CI 95% confidence interval.<br />
<strong>Occupation</strong> <strong>and</strong> <strong>cancer</strong> in Nordic countries 713
Acta Oncol Downloaded from informahealthcare.com by 212.35.100.66 on 04/06/11<br />
For personal use only.<br />
714 E. Pukkala et al.<br />
Table 44. Observed number of <strong>cancer</strong> of the fallopian tube among women in the Nordic countries <strong>and</strong> st<strong>and</strong>ardised incidence ratios 1961<br />
2005, by country <strong>and</strong> occupational category.<br />
Denmark Finl<strong>and</strong> Icel<strong>and</strong> Norway Sweden Total<br />
No <strong>Occupation</strong>al category Obs SIR Obs SIR Obs SIR Obs SIR Obs SIR Obs SIR 95% CI<br />
1 Technical workers, etc [1.24] 0.00 5 1.29 [0.05] 0.00 [0.78] 0.00 2 0.39 7 0.63 0.25*1.30<br />
2 Laboratory assistants 2 2.11 1 0.45 [0.06] 0.00 [0.86] 0.00 2 0.97 5 0.81 0.26*1.89<br />
3 Physicians [0.41] 0.00 2 2.05 [0.01] 0.00 [0.33] 0.00 1 0.74 3 0.98 0.20*2.86<br />
4 Dentists 1 2.78 3 3.47 [0.00] 0.00 [0.26] 0.00 1 1.18 5 2.15 0.70*5.01<br />
5 Nurses 10 1.42 24 2.12 [0.23] 0.00 9 1.30 17 1.16 60 1.49 1.14*1.92<br />
6 Assistant nurses 5 0.92 18 1.66 1 3.11 11 1.58 20 0.72 55 1.07 0.81*1.40<br />
7 ‘‘Other health workers’’ 2 0.49 10 1.16 [0.08] 0.00 11 1.70 10 1.04 33 1.15 0.79*1.61<br />
8 Teachers 10 1.09 16 0.82 1 2.30 17 1.35 30 0.88 74 0.98 0.77*1.23<br />
9 Religious workers etc [1.23] 0.00 10 0.95 [0.06] 0.00 3 0.96 9 0.73 22 0.81 0.51*1.22<br />
10 Artistic workers [0.59] 0.00 4 2.50 [0.05] 0.00 4 4.64 6 2.71 14 2.64 1.44*4.42<br />
11 Journalists [0.14] 0.00 1 0.98 [0.01] 0.00 [0.26] 0.00 1 0.93 2 0.80 0.10*2.89<br />
12 Administrators 7 1.94 3 0.89 [0.03] 0.00 2 0.72 5 1.02 17 1.16 0.68*1.86<br />
13 Clerical workers 54 1.43 87 1.35 2 1.57 38 0.99 90 1.08 271 1.20 1.07*1.35<br />
14 Sales agents [0.33] 0.00 7 0.86 [0.10] 0.00 4 1.04 7 0.74 18 0.82 0.49*1.30<br />
15 Shop workers 28 1.15 37 1.14 [0.70] 0.00 29 1.02 65 1.58 159 1.25 1.07*1.46<br />
16 Farmers 8 0.47 9 0.65 1 2.33 15 0.98 1 0.27 34 0.67 0.47*0.94<br />
17 Gardeners 1 0.45 37 0.77 [0.01] 0.00 11 1.15 9 0.88 58 0.82 0.63*1.07<br />
18 Fishermen [0.09] 0.00 [0.11] 0.00 [0.02] 0.00 [0.16] 0.00 [0.03] 0.00 [0.41] 0.00 0.00*8.92<br />
19 Forestry workers [0.02] 0.00 [0.24] 0.00 [0.00] 0.00 [0.21] 0.00 [0.26] 0.00 [0.73] 0.00 0.00*5.02<br />
20 Miners <strong>and</strong> quarry workers [0.00] 0.00 [0.09] 0.00 [0.00] 0.00 [0.01] 0.00 [0.07] 0.00 [0.18] 0.00 0.00*21.06<br />
21 Seamen [0.03] 0.00 [0.00] 0.00 [0.04] 0.00 [0.01] 0.00 [0.08] 0.00 0.00*44.93<br />
22 Transport workers [0.02] 0.00 2 1.46 [0.02] 0.00 1 5.32 1 1.34 4 1.70 0.46*4.36<br />
23 Drivers 1 1.56 [0.80] 0.00 [0.01] 0.00 1 1.59 1 0.46 3 0.70 0.15*2.06<br />
24 Postal workers 2 1.53 11 1.20 [0.20] 0.00 7 1.01 18 1.40 38 1.25 0.88*1.71<br />
25 Textile workers 8 0.95 20 1.00 [0.30] 0.00 6 0.71 24 1.20 58 1.01 0.77*1.31<br />
26 Shoe <strong>and</strong> leather workers [0.63] 0.00 4 1.58 [0.02] 0.00 1 1.57 2 1.25 7 1.29 0.52*2.66<br />
27 Smelting workers [0.16] 0.00 2 3.39 [0.00] 0.00 [0.11] 0.00 4 6.23 6 4.00 1.47*8.70<br />
28 Mechanics 1 0.62 3 1.06 [0.01] 0.00 1 1.06 6 1.00 11 0.97 0.48*1.73<br />
29 Plumbers [0.01] 0.00 [0.01] 0.00 [0.01] 0.00 [0.01] 0.00 [0.04] 0.00 0.00*96.33<br />
30 Welders [0.25] 0.00 [0.00] 0.00 2 21.03 [0.28] 0.00 2 3.17 0.38*11.44<br />
31 Electrical workers 2 0.89 2 0.97 [0.00] 0.00 1 0.92 8 2.37 13 1.48 0.79*2.53<br />
32 Wood workers 2 2.76 4 0.80 [0.01] 0.00 2 5.22 3 2.83 11 1.53 0.76*2.74<br />
33 Painters 1 37.43 1 1.59 [0.00] 0.00 1 12.24 [0.26] 0.00 3 2.99 0.62*8.73<br />
34 ‘‘Other construction workers’’ [0.02] 0.00 1 0.56 [0.00] 0.00 [0.03] 0.00 [0.04] 0.00 1 0.53 0.01*2.95<br />
35 Bricklayers [0.00] 0.00 [0.07] 0.00 [0.00] 0.00 [0.00] 0.00 [0.08] 0.00 0.00*46.91<br />
36 Printers 3 3.73 4 1.52 [0.03] 0.00 2 2.34 2 0.87 11 1.66 0.83*2.97<br />
37 Chemical process workers 2 1.59 1 0.76 [0.01] 0.00 [0.76] 0.00 5 2.94 8 1.58 0.68*3.12<br />
38 Food workers 2 0.32 6 0.90 2 2.46 9 2.03 6 1.36 25 1.11 0.72*1.64<br />
39 Beverage workers [0.58] 0.00 [0.36] 0.00 [0.00] 0.00 [0.05] 0.00 [0.26] 0.00 [1.25] 0.00 0.00*2.95<br />
40 Tobacco workers 1 1.24 [0.21] 0.00 [0.14] 0.00 [0.21] 0.00 1 0.73 0.02*4.07<br />
41 Glass makers etc 2 1.29 5 1.02 [0.02] 0.00 4 2.36 5 1.06 16 1.24 0.71*2.02<br />
42 Packers [0.44] 0.00 12 1.38 [0.07] 0.00 6 1.53 14 2.12 32 1.62 1.11*2.29<br />
43 Engine operators [0.02] 0.00 2 1.36 [0.00] 0.00 1 12.60 [0.64] 0.00 3 1.36 0.28*3.98<br />
44 Public safety workers [0.04] 0.00 [0.33] 0.00 [0.02] 0.00 [0.45] 0.00 1 1.29 1 0.62 0.02*3.45<br />
45 Cooks <strong>and</strong> stewards [0.02] 0.00 10 1.08 1 4.16 7 1.58 5 0.63 23 1.05 0.67*1.58<br />
46 Domestic assistants 12 1.29 13 1.26 [0.06] 0.00 7 0.55 29 1.05 61 1.02 0.78*1.31<br />
47 Waiters 6 3.61 6 0.69 [0.04] 0.00 5 0.85 8 0.88 25 0.99 0.64*1.46<br />
48 Building caretakers 17 0.63 30 0.97 [0.50] 0.00 18 0.69 31 1.19 96 0.87 0.70*1.06<br />
49 Chimney sweeps [0.00] 0.00 [0.02] 0.00 [0.00] 0.00 [0.00] 0.00 [0.02] 0.00 0.00*152.94<br />
50 Hairdressers 3 1.86 8 2.47 [0.05] 0.00 2 1.23 12 2.45 25 2.19 1.41*3.23<br />
51 Launderers 7 2.33 1 0.42 [0.06] 0.00 1 0.53 3 0.72 12 1.05 0.54*1.83<br />
52 Military personnel [0.02] 0.00 [0.05] 0.00 [0.01] 0.00 [0.03] 0.00 [0.11] 0.00 0.00*34.80<br />
53 ‘‘Other workers’’ 11 1.43 6 0.60 [0.59] 0.00 13 0.94 10 0.83 40 0.90 0.65*1.23<br />
54 Economically inactive 173 0.91 143 0.80 1 0.49 106 0.87 410 0.90 833 0.88 0.82*0.94<br />
1 54 All categories 384 1.00 571 1.00 9 1.00 358 1.00 884 1.00 2 206 1.00 Ref.<br />
Obs observed number of cases; SIR st<strong>and</strong>ardised incidence ratio; 95% CI 95% confidence interval.
Acta Oncol Downloaded from informahealthcare.com by 212.35.100.66 on 04/06/11<br />
For personal use only.<br />
suggest that fallopian tube <strong>cancer</strong> may have a similar<br />
aetiology as epithelial ovarian <strong>cancer</strong>. High parity<br />
may decrease risk of fallopian tube <strong>cancer</strong> [104].<br />
Women of high socioeconomic class seem also to be<br />
at increased risk in comparison to women of low<br />
social class. We found no previous studies suggesting<br />
occupational or environmental causes of fallopian<br />
tube <strong>cancer</strong>, except for a Finnish study reporting an<br />
increased risk among academic, clerical <strong>and</strong> administrative<br />
workers, as well as private secretaries,<br />
nurses, hairdressers, barbers, <strong>and</strong> book-keepers <strong>and</strong><br />
accountants [105]. The subjects included in the<br />
Finnish study overlap with the subjects included in<br />
the present study. Our study did not identify clear<br />
patterns of occupations associated with this malignancy,<br />
<strong>and</strong> the occupations associated with ovarian<br />
<strong>cancer</strong> were not the same as the occupations<br />
associated with fallopian tube <strong>cancer</strong>s.<br />
Cancer of the vulva<br />
The incidence of <strong>cancer</strong> of the vulva has been<br />
around 1.5 per 100 000 in the Nordic countries,<br />
<strong>and</strong> it has been relatively stable over decades.<br />
High SIRs were found in domestic assistants<br />
(SIR 1.16, 95% CI 1.04 1.30) <strong>and</strong> building<br />
caretakers. Low SIRs were seen in nurses (0.72,<br />
0.58 0.88), ‘‘other health workers’’ <strong>and</strong> teachers<br />
(Table 45).<br />
Comment. Cancer of the vulva is most probably<br />
related to HPV infection [106]. Nothing is known<br />
about possible occupational risk factors, <strong>and</strong> no<br />
pattern related to occupational category could be<br />
seen in the present study.<br />
/ 100 000<br />
100<br />
75<br />
50<br />
25<br />
Denmark<br />
Finl<strong>and</strong><br />
Icel<strong>and</strong><br />
Norway<br />
Sweden<br />
Vaginal <strong>cancer</strong><br />
Cancer of the vagina is rare. In our study we have<br />
only 2 725 cases, not many more than male breast<br />
<strong>cancer</strong> cases.<br />
High SIRs were found in chemical process workers<br />
(SIR 2.61, 95% CI 1.46 4.30) <strong>and</strong> building<br />
caretakers. The lowest SIRs were found in gardeners<br />
(0.73, 0.54 0.97) <strong>and</strong> teachers (Table 46).<br />
Comment. Cancer of the vagina is most probably<br />
related to HPV infection [106]. No occupational risk<br />
factors have been identified.<br />
Prostate <strong>cancer</strong><br />
Prostate <strong>cancer</strong> was the most common <strong>cancer</strong> in the<br />
present study (340 000 cases) <strong>and</strong> accounts for<br />
nearly one third of all incident <strong>cancer</strong> among men<br />
in the Nordic countries. The incidence has increased<br />
by three to fourfold since 1960 in all countries<br />
except Denmark, where it has remained considerably<br />
lower than in the other countries (Figure 33).<br />
For Finl<strong>and</strong>, Norway <strong>and</strong> Sweden the steepest rise<br />
was seen after 1990, around the time when testing<br />
for prostate specific antigen (PSA) became widely<br />
used.<br />
In the present study the highest SIRs were observed<br />
among dentists (SIR 1.22, 95% CI 1.13 1.31),<br />
administrators <strong>and</strong> religious workers (Table 47).<br />
The SIR was lowest (0.80, 0.79 0.82) among the<br />
economically inactive, followed by forestry workers<br />
<strong>and</strong> fishermen.<br />
0<br />
1945 1960 1975 1990 2005<br />
Comment. Autopsies have revealed that the prevalence<br />
of latent prostate <strong>cancer</strong> is very high. More<br />
Figure 33. Age st<strong>and</strong>ardised (World) incidence rates for prostate <strong>cancer</strong> 1943 2005, by country. Modified from NORDCAN [49].<br />
Men<br />
<strong>Occupation</strong> <strong>and</strong> <strong>cancer</strong> in Nordic countries 715
Acta Oncol Downloaded from informahealthcare.com by 212.35.100.66 on 04/06/11<br />
For personal use only.<br />
716 E. Pukkala et al.<br />
Table 45. Observed number of <strong>cancer</strong> of the vulva among women in the Nordic countries <strong>and</strong> st<strong>and</strong>ardised incidence ratios 1961 2005, by<br />
country <strong>and</strong> occupational category.<br />
Denmark Finl<strong>and</strong> Icel<strong>and</strong> Norway Sweden Total<br />
No <strong>Occupation</strong>al category Obs SIR Obs SIR Obs SIR Obs SIR Obs SIR Obs SIR 95% CI<br />
1 Technical workers, etc 5 1.31 4 0.54 [0.10] 0.00 3 1.12 9 0.54 21 0.68 0.42*1.05<br />
2 Laboratory assistants 3 1.18 5 1.21 [0.14] 0.00 2 0.56 2 0.50 12 0.83 0.43*1.45<br />
3 Physicians 2 1.53 [1.77] 0.00 [0.02] 0.00 [1.51] 0.00 4 1.11 6 0.73 0.27*1.59<br />
4 Dentists 1 0.86 2 0.90 [0.01] 0.00 [1.32] 0.00 2 0.65 5 0.64 0.21*1.50<br />
5 Nurses 20 0.86 7 0.34 [0.62] 0.00 25 0.92 37 0.71 89 0.72 0.58*0.88<br />
6 Assistant nurses 16 1.01 13 0.58 1 1.04 24 0.89 81 0.93 135 0.88 0.75*1.05<br />
7 ‘‘Other health workers’’ 9 0.67 12 0.69 1 5.12 20 0.71 26 0.89 68 0.77 0.60*0.97<br />
8 Teachers 21 0.75 31 0.77 1 0.87 53 0.99 88 0.76 194 0.81 0.71*0.93<br />
9 Religious workers etc 3 0.77 17 0.93 1 5.72 13 0.97 23 0.62 57 0.78 0.59*1.01<br />
10 Artistic workers 5 2.31 1 0.31 [0.15] 0.00 1 0.23 4 0.55 11 0.64 0.32*1.15<br />
11 Journalists 1 2.40 2 0.97 [0.04] 0.00 1 0.95 4 1.20 8 1.16 0.50*2.28<br />
12 Administrators 9 0.71 9 1.28 [0.11] 0.00 12 0.83 13 0.75 43 0.83 0.60*1.12<br />
13 Clerical workers 120 1.06 111 0.86 4 1.09 159 0.92 260 0.93 654 0.94 0.87*1.01<br />
14 Sales agents 1 0.91 24 1.15 [0.36] 0.00 31 1.08 42 0.92 98 1.01 0.82*1.23<br />
15 Shop workers 73 0.89 69 0.96 3 1.33 157 1.03 195 1.03 497 1.00 0.91*1.09<br />
16 Farmers 45 0.78 63 1.16 [1.55] 0.00 94 0.81 21 1.09 223 0.89 0.78*1.02<br />
17 Gardeners 6 0.80 136 0.96 [0.06] 0.00 63 0.92 60 1.20 265 0.99 0.88*1.12<br />
18 Fishermen [0.29] 0.00 [0.30] 0.00 [0.06] 0.00 1 1.34 [0.17] 0.00 1 0.64 0.02*3.56<br />
19 Forestry workers [0.07] 0.00 [0.58] 0.00 [0.01] 0.00 3 2.60 [1.04] 0.00 3 1.05 0.22*3.07<br />
20 Miners <strong>and</strong> quarry workers [0.00] 0.00 [0.26] 0.00 [0.00] 0.00 [0.05] 0.00 [0.23] 0.00 [0.55] 0.00 0.00*6.75<br />
21 Seamen [0.06] 0.00 [0.00] 0.00 [0.17] 0.00 [0.03] 0.00 [0.26] 0.00 0.00*14.28<br />
22 Transport workers [0.08] 0.00 5 1.37 [0.06] 0.00 [0.77] 0.00 3 1.02 8 1.07 0.46*2.10<br />
23 Drivers 2 1.02 1 0.63 [0.03] 0.00 4 1.35 6 0.92 13 1.00 0.53*1.70<br />
24 Postal workers 5 1.15 19 0.86 [0.72] 0.00 34 0.97 51 1.00 109 0.96 0.80*1.16<br />
25 Textile workers 32 1.20 58 1.13 [1.32] 0.00 65 1.04 129 1.08 284 1.09 0.97*1.22<br />
26 Shoe <strong>and</strong> leather workers 1 0.52 6 0.97 [0.08] 0.00 6 1.36 11 1.23 24 1.11 0.71*1.66<br />
27 Smelting workers [0.46] 0.00 6 4.14 [0.00] 0.00 [0.38] 0.00 1 0.50 7 1.63 0.65*3.36<br />
28 Mechanics 5 1.14 6 0.95 [0.01] 0.00 4 0.82 22 1.03 37 1.00 0.71*1.38<br />
29 Plumbers [0.06] 0.00 [0.01] 0.00 [0.03] 0.00 [0.03] 0.00 [0.13] 0.00 0.00*29.02<br />
30 Welders [0.46] 0.00 [0.00] 0.00 [0.29] 0.00 1 1.40 1 0.68 0.02*3.77<br />
31 Electrical workers 8 1.30 5 1.31 [0.01] 0.00 5 0.99 12 1.02 30 1.12 0.75*1.60<br />
32 Wood workers 2 0.95 20 1.55 [0.03] 0.00 [1.63] 0.00 1 0.29 23 1.14 0.72*1.71<br />
33 Painters [0.08] 0.00 3 2.02 [0.01] 0.00 [0.38] 0.00 [0.98] 0.00 3 1.03 0.21*3.00<br />
34 ‘‘Other construction workers’’ [0.07] 0.00 10 1.83 [0.00] 0.00 [0.15] 0.00 [0.11] 0.00 10 1.73 0.83*3.18<br />
35 Bricklayers [0.01] 0.00 [0.18] 0.00 [0.01] 0.00 [0.00] 0.00 [0.20] 0.00 0.00*18.24<br />
36 Printers [2.41] 0.00 4 0.63 [0.11] 0.00 9 1.82 9 0.95 22 0.95 0.59*1.44<br />
37 Chemical process workers 5 1.29 2 0.61 [0.05] 0.00 7 1.58 12 1.56 26 1.34 0.88*1.97<br />
38 Food workers 21 1.10 22 1.26 2 0.70 28 0.94 31 1.27 104 1.11 0.92*1.35<br />
39 Beverage workers 3 1.69 1 1.00 [0.01] 0.00 [0.23] 0.00 1 0.63 5 1.08 0.35*2.53<br />
40 Tobacco workers 2 0.82 2 3.53 2 1.86 2 2.33 8 1.63 0.70*3.20<br />
41 Glass makers etc 7 1.58 9 0.75 [0.08] 0.00 15 1.62 26 1.30 57 1.25 0.94*1.62<br />
42 Packers 1 0.76 22 1.04 [0.27] 0.00 20 0.88 35 1.13 78 1.02 0.81*1.28<br />
43 Engine operators [0.03] 0.00 5 1.51 [0.01] 0.00 [0.25] 0.00 1 0.66 6 1.17 0.43*2.55<br />
44 Public safety workers [0.16] 0.00 [0.81] 0.00 [0.05] 0.00 4 1.36 4 1.76 8 1.28 0.55*2.53<br />
45 Cooks <strong>and</strong> stewards [0.05] 0.00 23 0.93 1 0.99 35 0.99 51 1.02 110 0.99 0.82*1.20<br />
46 Domestic assistants 32 1.05 20 0.77 [0.29] 0.00 112 1.27 144 1.19 308 1.16 1.04*1.30<br />
47 Waiters 6 1.22 31 1.60 1 8.36 38 1.10 47 0.97 123 1.14 0.96*1.36<br />
48 Building caretakers 99 1.12 110 1.29 1 0.49 161 1.11 127 1.02 498 1.12 1.02*1.22<br />
49 Chimney sweeps [0.01] 0.00 [0.04] 0.00 [0.02] 0.00 [0.00] 0.00 [0.07] 0.00 0.00*51.04<br />
50 Hairdressers 3 0.59 7 0.93 [0.14] 0.00 10 1.14 13 0.70 33 0.82 0.57*1.16<br />
51 Launderers 13 1.29 4 0.58 [0.32] 0.00 17 1.24 32 1.19 66 1.14 0.88*1.45<br />
52 Military personnel [0.05] 0.00 1 16.96 [0.03] 0.00 1 16.55 2 9.81 1.19*35.43<br />
53 ‘‘Other workers’’ 28 1.12 21 0.82 2 0.90 87 1.16 64 1.18 202 1.11 0.97*1.28<br />
54 Economically inactive 709 1.01 641 1.02 13 1.73 1 128 0.99 2 667 1.01 5 158 1.01 0.98*1.04<br />
1 54 All categories 1 324 1.00 1 570 1.00 31 1.00 2 453 1.00 4 375 1.00 9 753 1.00 Ref.<br />
Obs observed number of cases; SIR st<strong>and</strong>ardised incidence ratio; 95% CI 95% confidence interval.
Acta Oncol Downloaded from informahealthcare.com by 212.35.100.66 on 04/06/11<br />
For personal use only.<br />
Table 46. Observed number of vaginal <strong>cancer</strong> among women in the Nordic countries <strong>and</strong> st<strong>and</strong>ardised incidence ratios 1961 2005, by<br />
country <strong>and</strong> occupational category.<br />
Denmark Finl<strong>and</strong> Icel<strong>and</strong> Norway Sweden Total<br />
No <strong>Occupation</strong>al category Obs SIR Obs SIR Obs SIR Obs SIR Obs SIR Obs SIR 95% CI<br />
1 Technical workers, etc 3 1.82 1 0.48 [0.03] 0.00 1 1.72 7 1.36 12 1.26 0.65*2.21<br />
2 Laboratory assistants 1 0.87 2 1.73 [0.04] 0.00 1 1.34 [1.27] 0.00 4 0.92 0.25*2.34<br />
3 Physicians [0.55] 0.00 [0.50] 0.00 [0.01] 0.00 [0.31] 0.00 [1.14] 0.00 [2.51] 0.00 0.00*1.47<br />
4 Dentists [0.49] 0.00 [0.57] 0.00 [0.00] 0.00 [0.27] 0.00 [0.94] 0.00 [2.28] 0.00 0.00*1.62<br />
5 Nurses 14 1.45 10 1.69 [0.19] 0.00 1 0.17 5 0.32 30 0.80 0.54*1.15<br />
6 Assistant nurses 6 0.87 7 1.13 [0.25] 0.00 3 0.52 37 1.39 53 1.16 0.87*1.52<br />
7 ‘‘Other health workers’’ 2 0.36 8 1.65 [0.05] 0.00 7 1.18 13 1.45 30 1.18 0.80*1.69<br />
8 Teachers 10 0.83 9 0.81 [0.35] 0.00 8 0.72 25 0.71 52 0.74 0.56*0.98<br />
9 Religious workers etc 1 0.61 6 1.15 [0.05] 0.00 2 0.72 3 0.27 12 0.57 0.30*1.00<br />
10 Artistic workers 1 1.16 [0.89] 0.00 [0.04] 0.00 [0.86] 0.00 [2.23] 0.00 1 0.20 0.01*1.14<br />
11 Journalists [0.18] 0.00 [0.58] 0.00 [0.01] 0.00 [0.22] 0.00 1 0.98 1 0.50 0.01*2.77<br />
12 Administrators 13 2.52 2 1.02 [0.03] 0.00 2 0.71 4 0.78 21 1.39 0.86*2.12<br />
13 Clerical workers 42 0.85 34 0.95 3 3.19 31 0.86 109 1.26 219 1.05 0.92*1.20<br />
14 Sales agents [0.46] 0.00 8 1.45 [0.10] 0.00 8 1.51 19 1.44 35 1.42 0.99*1.98<br />
15 Shop workers 34 1.00 29 1.48 [0.58] 0.00 22 0.72 61 1.07 146 1.03 0.88*1.21<br />
16 Farmers 12 0.50 15 1.10 1 2.21 20 0.95 6 1.12 54 0.84 0.63*1.09<br />
17 Gardeners 4 1.29 26 0.69 [0.02] 0.00 12 0.95 8 0.54 50 0.73 0.54*0.97<br />
18 Fishermen [0.12] 0.00 [0.08] 0.00 [0.02] 0.00 2 12.99 1 20.68 3 7.09 1.46*20.73<br />
19 Forestry workers [0.03] 0.00 [0.15] 0.00 [0.00] 0.00 1 4.37 [0.31] 0.00 1 1.38 0.03*7.67<br />
20 Miners <strong>and</strong> quarry workers [0.00] 0.00 [0.07] 0.00 [0.00] 0.00 [0.01] 0.00 [0.07] 0.00 [0.15] 0.00 0.00*24.66<br />
21 Seamen [0.02] 0.00 [0.04] 0.00 [0.01] 0.00 [0.06] 0.00 0.00*61.87<br />
22 Transport workers [0.03] 0.00 1 0.98 [0.02] 0.00 [0.16] 0.00 1 1.13 2 0.94 0.11*3.41<br />
23 Drivers 1 1.18 1 2.26 [0.01] 0.00 1 1.69 3 1.50 6 1.54 0.56*3.35<br />
24 Postal workers 1 0.55 6 1.00 [0.19] 0.00 8 1.12 17 1.07 32 1.03 0.70*1.45<br />
25 Textile workers 7 0.62 12 0.87 [0.41] 0.00 11 0.93 47 1.35 77 1.07 0.84*1.34<br />
26 Shoe <strong>and</strong> leather workers [0.84] 0.00 [1.68] 0.00 [0.02] 0.00 [0.85] 0.00 6 2.27 6 1.00 0.37*2.17<br />
27 Smelting workers [0.20] 0.00 [0.40] 0.00 [0.00] 0.00 [0.09] 0.00 3 4.75 3 2.28 0.47*6.65<br />
28 Mechanics 3 1.51 2 1.15 [0.00] 0.00 3 3.00 7 1.07 15 1.33 0.74*2.19<br />
29 Plumbers [0.02] 0.00 [0.00] 0.00 [0.01] 0.00 [0.01] 0.00 [0.04] 0.00 0.00*94.10<br />
30 Welders 1 7.59 [0.00] 0.00 [0.07] 0.00 1 4.38 2 4.68 0.57*16.92<br />
31 Electrical workers 2 0.72 1 0.93 [0.00] 0.00 3 2.80 5 1.37 11 1.28 0.64*2.30<br />
32 Wood workers [0.93] 0.00 2 0.57 [0.01] 0.00 [0.34] 0.00 3 2.81 5 0.86 0.28*2.00<br />
33 Painters [0.04] 0.00 1 2.48 [0.00] 0.00 [0.08] 0.00 1 3.36 2 2.45 0.30*8.87<br />
34 ‘‘Other construction workers’’ [0.03] 0.00 2 1.39 [0.00] 0.00 [0.03] 0.00 [0.03] 0.00 2 1.30 0.16*4.70<br />
35 Bricklayers [0.01] 0.00 [0.05] 0.00 [0.00] 0.00 [0.00] 0.00 [0.05] 0.00 0.00*68.05<br />
36 Printers [1.05] 0.00 3 1.75 [0.03] 0.00 1 1.02 2 0.70 6 0.90 0.33*1.97<br />
37 Chemical process workers 3 1.80 3 3.35 [0.01] 0.00 2 2.28 7 3.04 15 2.61 1.46*4.30<br />
38 Food workers 6 0.73 2 0.43 1 1.25 7 1.24 10 1.41 26 0.99 0.64*1.44<br />
39 Beverage workers 2 2.59 [0.26] 0.00 [0.00] 0.00 [0.05] 0.00 [0.46] 0.00 2 1.30 0.16*4.68<br />
40 Tobacco workers 1 0.94 [0.15] 0.00 [0.21] 0.00 [0.27] 0.00 1 0.59 0.02*3.30<br />
41 Glass makers etc [1.97] 0.00 3 0.93 [0.02] 0.00 3 1.60 9 1.49 15 1.14 0.64*1.88<br />
42 Packers 2 3.50 9 1.58 [0.07] 0.00 6 1.34 9 0.98 26 1.30 0.85*1.90<br />
43 Engine operators [0.02] 0.00 3 3.29 [0.00] 0.00 [0.06] 0.00 1 2.00 4 2.70 0.73*6.90<br />
44 Public safety workers [0.07] 0.00 [0.22] 0.00 [0.02] 0.00 [0.55] 0.00 [0.68] 0.00 [1.53] 0.00 0.00*2.42<br />
45 Cooks <strong>and</strong> stewards [0.02] 0.00 6 0.91 [0.32] 0.00 10 1.55 19 1.35 35 1.27 0.89*1.77<br />
46 Domestic assistants 8 0.62 6 0.87 [0.10] 0.00 15 0.90 31 0.89 60 0.84 0.64*1.08<br />
47 Waiters 3 1.39 8 1.50 [0.03] 0.00 11 1.62 18 1.27 40 1.40 1.00*1.91<br />
48 Building caretakers 54 1.45 32 1.41 [0.64] 0.00 32 1.12 44 1.22 162 1.30 1.11*1.51<br />
49 Chimney sweeps [0.00] 0.00 [0.01] 0.00 [0.00] 0.00 [0.00] 0.00 [0.02] 0.00 0.00*198.01<br />
50 Hairdressers 2 0.92 3 1.46 [0.04] 0.00 1 0.57 2 0.35 8 0.68 0.30*1.35<br />
51 Launderers 7 1.67 3 1.64 [0.11] 0.00 2 0.78 13 1.70 25 1.53 0.99*2.26<br />
52 Military personnel [0.02] 0.00 [0.02] 0.00 [0.01] 0.00 [0.02] 0.00 [0.07] 0.00 0.00*56.25<br />
53 ‘‘Other workers’’ 15 1.43 7 1.01 3 4.98 11 0.74 23 1.44 59 1.21 0.92*1.56<br />
54 Economically inactive 287 1.01 137 0.88 1 0.42 215 1.05 714 0.92 1 354 0.95 0.90*1.00<br />
1 54 All categories 547 1.00 411 1.00 9 1.00 463 1.00 1 295 1.00 2 725 1.00 Ref.<br />
Obs observed number of cases; SIR st<strong>and</strong>ardised incidence ratio; 95% CI 95% confidence interval.<br />
<strong>Occupation</strong> <strong>and</strong> <strong>cancer</strong> in Nordic countries 717
Acta Oncol Downloaded from informahealthcare.com by 212.35.100.66 on 04/06/11<br />
For personal use only.<br />
718 E. Pukkala et al.<br />
than 20% of men who have reached the age of 50<br />
have prostatic carcinoma that meets the histopathologic<br />
criteria for malignancy, but most of those<br />
<strong>cancer</strong>s seem to have a low potential for growth<br />
[107]. Therefore, the incidence must be interpreted<br />
in the context of prostate <strong>cancer</strong>-related diagnostic<br />
activity. This is exemplified by the Danish experience<br />
during the past three decades, where both the<br />
level of diagnostic activity <strong>and</strong> the prostate <strong>cancer</strong><br />
incidence have been lower than in the other Nordic<br />
countries [108,109]. Before the introduction of<br />
PSA testing in the late 1980s, trans-urethral resections<br />
of the prostate (TURP), widely applied as a<br />
treatment for benign prostate hyperplasia, were<br />
responsible for a large number of incidental findings<br />
of prostate <strong>cancer</strong>.<br />
The aetiology of prostate <strong>cancer</strong> is poorly understood.<br />
Consumption of red meat <strong>and</strong> dairy products<br />
is probably associated with an increased risk,<br />
whereas tomatoes <strong>and</strong> tomato products, especially<br />
those with high lycopene content, are associated<br />
with a reduced risk [110]. There are no established<br />
occupational risk factors, but cadmium, polychlorinated<br />
biphenyls <strong>and</strong> high electromagnetic fields<br />
have been suggested. The present results do not<br />
support an association with industrial occupations,<br />
as SIRs were not elevated among miners, chemical<br />
process workers, smelting workers, welders, painters<br />
or chimney sweeps. Furthermore, the contrasts<br />
between the highest <strong>and</strong> lowest SIRs were small.<br />
On the other h<strong>and</strong>, the present results support an<br />
association with diagnostic activity, as higher SIRs<br />
were observed for occupations that are related to<br />
higher social status <strong>and</strong> thus presumably better<br />
access to health care.<br />
/ 100 000<br />
15<br />
10<br />
5<br />
0<br />
Denmark<br />
Finl<strong>and</strong><br />
Icel<strong>and</strong><br />
Norway<br />
Sweden<br />
Testicular <strong>cancer</strong><br />
Incidence in the Nordic countries has been increasing<br />
over time <strong>and</strong> is nowadays about twofold in<br />
Denmark <strong>and</strong> Norway as compared with the other<br />
Nordic countries (Figure 34). The rates in Denmark<br />
<strong>and</strong> Norway are among the highest in the world.<br />
The highest significant excess risk of testicular<br />
<strong>cancer</strong> was found in physicians (SIR 1.48, 95% CI<br />
1.15 1.88), followed by artistic workers, religious<br />
etc. workers, printers <strong>and</strong> administrators (Table 48).<br />
The lowest risk was observed in forestry workers<br />
(0.70, 0.54 0.88), engine operators <strong>and</strong> welders.<br />
Sixty percent of the testicular <strong>cancer</strong>s in the<br />
present series are seminomas (http://astra.<strong>cancer</strong>.<br />
fi/NOCCA/Incidence/testis-seminoma). Physicians<br />
had the highest risk of seminoma with an SIR of<br />
1.48 (95% CI 1.07 1.99), followed by artistic workers<br />
(1.47, 1.06 1.99) <strong>and</strong> religious etc. workers<br />
(1.33, 1.14 1.56). The lowest SIRs were observed<br />
among cooks <strong>and</strong> stewards (0.56, 0.29 0.98) <strong>and</strong><br />
forestry workers (0.64, 0.47 0.86).<br />
The occupational category of administrators<br />
was the only one with a significantly elevated<br />
SIR of testicular non-seminoma <strong>cancer</strong> (1.21,<br />
1.04 1.42; http://astra.<strong>cancer</strong>.fi/NOCCA/Incidence/<br />
testis-non-seminoma). The only SIRs significantly<br />
below 1.0 were observed among engine operators<br />
(0.60, 0.41 0.84) <strong>and</strong> public safety workers (0.67,<br />
0.43 0.99).<br />
Comment. The mean age at diagnosis of testicular<br />
<strong>cancer</strong> in the Nordic countries is only 30 years,<br />
i.e., relatively low as compared with other <strong>cancer</strong><br />
sites. Many of the <strong>cancer</strong>s were diagnosed before<br />
the starting age of follow-up in the present study<br />
Men<br />
1945 1960 1975 1990 2005<br />
Figure 34. Age st<strong>and</strong>ardised (World) incidence rates for testicular <strong>cancer</strong> 1943 2005, by country. Modified from NORDCAN [49].
Acta Oncol Downloaded from informahealthcare.com by 212.35.100.66 on 04/06/11<br />
For personal use only.<br />
Table 47. Observed number of prostate <strong>cancer</strong> among men in the Nordic countries <strong>and</strong> st<strong>and</strong>ardised incidence ratios 1961 2005, by<br />
country <strong>and</strong> occupational category.<br />
Denmark Finl<strong>and</strong> Icel<strong>and</strong> Norway Sweden Total<br />
No <strong>Occupation</strong>al category Obs SIR Obs SIR Obs SIR Obs SIR Obs SIR Obs SIR 95% CI<br />
1 Technical workers, etc 2 306 1.07 3886 1.17 49 1.16 2 373 1.06 17 827 1.11 26 441 1.11 1.09*1.12<br />
2 Laboratory assistants 41 0.96 82 1.04 8 1.00 118 1.07 84 1.13 333 1.06 0.95*1.18<br />
3 Physicians 217 1.16 240 1.24 23 1.22 332 1.05 771 1.07 1 583 1.10 1.05*1.16<br />
4 Dentists 62 1.21 48 1.19 1 0.24 184 1.29 441 1.20 736 1.22 1.13*1.31<br />
5 Nurses [2.23] 0.00 11 1.42 [0.03] 0.00 11 1.21 26 1.04 48 1.09 0.80*1.45<br />
6 Assistant nurses 44 0.88 8 1.33 2 1.26 55 1.01 213 0.93 322 0.94 0.85*1.05<br />
7 ‘‘Other health workers’’ 198 1.26 207 1.12 5 1.00 121 1.03 609 1.02 1 140 1.08 1.01*1.14<br />
8 Teachers 1 023 1.09 1638 1.12 80 1.22 1 822 1.08 4 485 1.07 9 048 1.09 1.06*1.11<br />
9 Religious workers etc 474 1.10 873 1.22 65 1.51 1 000 1.13 3 423 1.13 5 835 1.14 1.11*1.17<br />
10 Artistic workers 164 1.27 302 1.12 15 1.25 273 1.06 1 036 1.08 1 790 1.10 1.05*1.15<br />
11 Journalists 66 1.12 133 1.04 8 1.21 114 1.04 441 1.00 762 1.03 0.96*1.10<br />
12 Administrators 2 816 1.11 2851 1.31 137 1.12 3 603 1.14 7 249 1.16 16 656 1.17 1.15*1.19<br />
13 Clerical workers 1 102 1.03 1 614 1.14 143 1.06 2 480 1.06 7 119 1.07 12 458 1.07 1.05*1.09<br />
14 Sales agents 662 1.19 2151 1.07 85 1.23 3 084 1.11 10 450 1.09 16 432 1.10 1.08*1.12<br />
15 Shop workers 2 664 1.04 838 0.99 45 0.98 1 035 1.02 3 178 1.02 7 760 1.02 1.00*1.05<br />
16 Farmers 4 722 0.89 10 239 0.99 167 0.81 8 859 1.04 17 038 1.00 41 025 0.99 0.98*1.00<br />
17 Gardeners 710 0.96 1 203 0.84 6 0.96 1 792 0.90 5 503 0.89 9 214 0.89 0.87*0.91<br />
18 Fishermen 204 0.91 127 0.97 95 0.98 2 219 0.88 585 0.89 3 230 0.89 0.86*0.92<br />
19 Forestry workers 90 0.82 1 241 0.76 [0.98] 0.00 1 345 0.89 3 839 0.86 6 515 0.84 0.82*0.87<br />
20 Miners <strong>and</strong> quarry workers 27 0.84 252 0.99 [1.69] 0.00 358 0.92 928 0.87 1 565 0.89 0.85*0.94<br />
21 Seamen 263 1.17 418 1.19 25 0.84 1 860 0.99 1 047 1.12 3 613 1.05 1.02*1.09<br />
22 Transport workers 510 0.94 1 099 1.03 68 1.04 1 066 1.02 3 389 1.02 6 132 1.02 0.99*1.04<br />
23 Drivers 1 649 0.98 3 308 0.99 74 0.85 2 736 1.01 7 737 0.99 15 504 0.99 0.98*1.01<br />
24 Postal workers 328 1.03 513 1.02 20 1.68 546 0.99 1 768 1.02 3 175 1.02 0.99*1.06<br />
25 Textile workers 284 0.88 381 1.10 11 0.52 637 1.01 1 797 0.91 3 110 0.94 0.91*0.98<br />
26 Shoe <strong>and</strong> leather workers 70 0.86 139 0.93 2 0.43 256 0.95 812 1.05 1 279 1.00 0.95*1.06<br />
27 Smelting workers 657 1.00 459 0.90 19 0.67 859 1.06 2 802 0.91 4 796 0.95 0.92*0.97<br />
28 Mechanics 1 781 0.98 3 177 0.99 81 1.01 3 625 0.96 13 730 0.96 22 394 0.96 0.95*0.98<br />
29 Plumbers 177 1.12 563 1.06 15 1.10 398 0.94 1 639 0.99 2 792 1.00 0.97*1.04<br />
30 Welders 535 1.10 5 1.07 422 0.90 1 909 1.02 2 871 1.01 0.98*1.05<br />
31 Electrical workers 399 0.98 1 303 0.98 39 0.85 1 679 1.00 4 875 0.99 8 295 0.99 0.97*1.01<br />
32 Wood workers 1 219 0.94 3336 0.94 44 0.88 4 685 0.99 9 423 0.97 18 707 0.97 0.95*0.98<br />
33 Painters 384 0.93 721 0.98 14 0.68 764 0.99 2 758 0.99 4 641 0.98 0.96*1.01<br />
34 ‘‘Other construction workers’’ 1 481 0.88 2031 0.92 95 1.01 841 0.95 5 137 1.00 9 585 0.96 0.94*0.97<br />
35 Bricklayers 487 1.04 379 1.03 432 0.93 1 218 0.96 2 516 0.98 0.94*1.02<br />
36 Printers 295 1.05 349 1.09 15 0.97 439 0.98 1 508 1.00 2 606 1.02 0.98*1.05<br />
37 Chemical process workers 261 0.92 483 0.87 8 0.87 873 0.84 2 126 0.93 3 751 0.90 0.87*0.93<br />
38 Food workers 876 0.99 382 0.94 71 0.90 1 155 0.98 2 310 0.97 4 794 0.97 0.95*1.00<br />
39 Beverage workers 111 1.05 18 0.67 [1.35] 0.00 8 0.81 124 0.95 261 0.95 0.84*1.08<br />
40 Tobacco workers 22 1.16 4 0.78 [0.11] 0.00 13 0.73 11 1.06 50 0.95 0.71*1.26<br />
41 Glass makers etc 499 0.94 566 1.00 18 1.34 522 0.95 2 379 0.93 3 984 0.94 0.92*0.97<br />
42 Packers 484 1.00 1 155 0.97 40 0.87 1 752 1.00 4 424 0.97 7 855 0.98 0.96*1.00<br />
43 Engine operators 465 1.00 1 591 0.99 61 1.08 948 1.02 3 716 0.97 6 781 0.98 0.96*1.00<br />
44 Public safety workers 509 1.12 1073 1.16 47 1.10 781 1.04 2 483 1.10 4 893 1.11 1.08*1.14<br />
45 Cooks <strong>and</strong> stewards 40 1.26 42 0.84 19 1.05 311 1.01 339 0.90 751 0.96 0.89*1.03<br />
46 Domestic assistants 1 2.94 [4.25] 0.00 [0.06] 0.00 2 0.82 17 0.70 20 0.63 0.39*0.98<br />
47 Waiters 77 1.16 50 1.09 2 1.12 149 1.10 212 1.09 490 1.10 1.01*1.20<br />
48 Building caretakers 506 1.05 782 0.99 25 1.20 389 1.02 1 759 1.01 3 461 1.01 0.98*1.05<br />
49 Chimney sweeps 11 0.97 52 0.94 40 1.05 136 1.07 239 1.03 0.91*1.17<br />
50 Hairdressers 138 0.99 7 0.46 3 1.11 111 1.00 437 0.95 696 0.95 0.88*1.02<br />
51 Launderers 67 0.98 20 1.25 3 1.51 75 1.12 345 1.05 510 1.05 0.97*1.15<br />
52 Military personnel 240 1.16 325 1.07 641 1.06 1 510 1.11 2 716 1.10 1.06*1.14<br />
53 ‘‘Other workers’’ 1 401 1.00 774 0.86 195 1.09 3 346 0.98 5 402 0.97 11 118 0.97 0.95*0.99<br />
54 Economically inactive 1 510 1.03 3 673 0.81 97 0.85 1 239 0.72 6 175 0.78 12 694 0.80 0.79*0.82<br />
1 54 All categories 34 794 1.00 57 652 1.00 2 050 1.00 64 778 1.00 180 699 1.00 339 973 1.00 Ref.<br />
Obs observed number of cases; SIR st<strong>and</strong>ardised incidence ratio; 95% CI 95% confidence interval.<br />
<strong>Occupation</strong> <strong>and</strong> <strong>cancer</strong> in Nordic countries 719
Acta Oncol Downloaded from informahealthcare.com by 212.35.100.66 on 04/06/11<br />
For personal use only.<br />
720 E. Pukkala et al.<br />
Table 48. Observed number of testicular <strong>cancer</strong> among men in the Nordic countries <strong>and</strong> st<strong>and</strong>ardised incidence ratios 1961 2005, by<br />
country <strong>and</strong> occupational category.<br />
Denmark Finl<strong>and</strong> Icel<strong>and</strong> Norway Sweden Total<br />
No <strong>Occupation</strong>al category Obs SIR Obs SIR Obs SIR Obs SIR Obs SIR Obs SIR 95% CI<br />
1 Technical workers, etc 128 1.01 79 1.14 [2.34] 0.00 130 1.19 343 1.04 680 1.06 0.99*1.15<br />
2 Laboratory assistants 1 0.43 1 0.52 [0.50] 0.00 3 0.68 6 1.54 11 0.84 0.42*1.51<br />
3 Physicians 16 1.72 4 1.00 [0.59] 0.00 18 1.55 29 1.48 67 1.48 1.15*1.88<br />
4 Dentists 6 1.83 [0.83] 0.00 [0.17] 0.00 5 1.03 2 0.27 13 0.78 0.42*1.34<br />
5 Nurses 1 5.12 [0.55] 0.00 [0.03] 0.00 1 0.70 4 0.92 6 0.91 0.34*1.99<br />
6 Assistant nurses 2 0.63 [0.56] 0.00 [0.36] 0.00 4 2.40 7 0.66 13 0.80 0.42*1.36<br />
7 ‘‘Other health workers’’ 11 1.40 2 0.56 [0.21] 0.00 5 1.05 11 0.71 29 0.91 0.61*1.31<br />
8 Teachers 68 1.15 32 1.35 1 0.36 67 0.88 109 1.09 277 1.06 0.94*1.19<br />
9 Religious workers etc 17 0.92 26 1.42 3 1.62 42 1.22 140 1.38 228 1.30 1.15*1.49<br />
10 Artistic workers 4 0.65 11 2.12 2 4.14 11 1.23 32 1.45 60 1.40 1.07*1.80<br />
11 Journalists 5 1.63 1 0.42 [0.32] 0.00 6 1.31 16 1.46 28 1.31 0.87*1.90<br />
12 Administrators 121 1.04 46 1.39 [1.93] 0.00 110 1.10 130 1.39 407 1.18 1.07*1.30<br />
13 Clerical workers 81 1.37 25 1.24 6 1.54 74 0.96 128 1.10 314 1.14 1.02*1.27<br />
14 Sales agents 35 1.10 29 0.89 2 1.36 85 1.06 193 1.06 344 1.05 0.94*1.17<br />
15 Shop workers 134 1.19 11 0.66 2 0.97 49 1.19 50 0.88 246 1.07 0.95*1.22<br />
16 Farmers 155 0.84 81 1.10 5 1.21 128 1.00 152 1.07 521 0.97 0.89*1.06<br />
17 Gardeners 21 0.80 15 0.86 [0.19] 0.00 51 1.34 70 0.99 157 1.03 0.88*1.20<br />
18 Fishermen 11 0.95 1 0.76 9 1.13 45 0.87 6 0.83 72 0.90 0.70*1.13<br />
19 Forestry workers 2 0.58 18 0.86 [0.06] 0.00 15 0.62 35 0.67 70 0.70 0.54*0.88<br />
20 Miners <strong>and</strong> quarry workers 1 0.88 1 0.28 [0.12] 0.00 14 1.30 7 0.44 23 0.73 0.46*1.10<br />
21 Seamen 14 0.93 12 2.29 [1.34] 0.00 52 0.78 12 0.74 90 0.86 0.69*1.06<br />
22 Transport workers 22 0.92 16 1.30 [1.18] 0.00 27 1.00 55 1.15 120 1.07 0.89*1.28<br />
23 Drivers 85 0.93 42 0.81 2 0.61 99 1.01 151 0.96 379 0.94 0.85*1.04<br />
24 Postal workers 20 0.98 10 1.23 [0.30] 0.00 25 1.48 32 0.88 87 1.06 0.85*1.31<br />
25 Textile workers 16 1.25 7 1.83 [0.56] 0.00 10 0.82 27 1.23 60 1.17 0.89*1.50<br />
26 Shoe <strong>and</strong> leather workers 2 0.72 1 0.62 [0.10] 0.00 5 1.12 12 1.72 20 1.25 0.77*1.94<br />
27 Smelting workers 31 0.80 2 0.30 1 1.07 19 0.87 37 0.87 90 0.81 0.65*1.00<br />
28 Mechanics 99 1.00 51 0.89 2 0.41 140 1.02 209 0.74 501 0.87 0.79*0.94<br />
29 Plumbers 7 0.72 6 0.63 [0.64] 0.00 13 0.74 34 1.09 60 0.88 0.67*1.13<br />
30 Welders 8 0.68 1 2.79 15 0.68 33 0.77 57 0.74 0.56*0.96<br />
31 Electrical workers 30 1.08 21 0.76 3 0.89 51 0.81 111 0.99 216 0.92 0.81*1.06<br />
32 Wood workers 65 1.03 33 0.80 4 1.98 120 1.07 142 1.01 364 1.02 0.92*1.13<br />
33 Painters 25 1.15 11 1.06 1 1.33 17 0.87 33 0.76 87 0.91 0.73*1.12<br />
34 ‘‘Other construction workers’’ 54 0.85 18 0.66 8 1.50 21 0.72 57 0.75 158 0.79 0.67*0.92<br />
35 Bricklayers 26 1.10 3 0.69 9 0.81 20 1.27 58 1.06 0.80*1.37<br />
36 Printers 23 1.31 7 1.03 [0.73] 0.00 20 1.22 40 1.31 90 1.25 1.01*1.54<br />
37 Chemical process workers 13 1.16 9 1.04 [0.28] 0.00 15 0.63 27 0.80 64 0.82 0.63*1.05<br />
38 Food workers 39 0.92 6 0.97 [3.29] 0.00 31 1.04 31 0.90 107 0.92 0.76*1.11<br />
39 Beverage workers 5 1.06 [0.35] 0.00 [0.05] 0.00 2 2.10 3 1.61 10 1.26 0.61*2.32<br />
40 Tobacco workers 1 1.78 [0.07] 0.00 [0.00] 0.00 [0.37] 0.00 1 4.82 2 1.66 0.20*5.98<br />
41 Glass makers etc 14 0.62 12 1.24 [0.62] 0.00 12 0.65 38 0.91 76 0.82 0.65*1.03<br />
42 Packers 12 0.67 15 0.89 4 2.25 38 0.86 75 1.09 144 0.96 0.82*1.13<br />
43 Engine operators 15 0.63 17 0.61 5 1.64 32 0.80 57 0.76 126 0.74 0.62*0.88<br />
44 Public safety workers 14 0.69 10 0.68 3 2.19 24 1.14 59 1.16 110 1.02 0.84*1.23<br />
45 Cooks <strong>and</strong> stewards 1 0.48 [1.76] 0.00 [1.14] 0.00 10 0.76 16 1.22 27 0.86 0.57*1.25<br />
46 Domestic assistants [0.03] 0.00 [0.05] 0.00 [0.00] 0.00 [0.17] 0.00 1 0.30 1 0.28 0.01*1.54<br />
47 Waiters 7 1.95 [1.79] 0.00 [0.17] 0.00 4 0.82 10 1.64 21 1.27 0.79*1.94<br />
48 Building caretakers 27 1.45 13 1.22 [0.27] 0.00 14 1.18 42 1.13 96 1.22 0.99*1.50<br />
49 Chimney sweeps 1 1.49 [0.76] 0.00 2 1.82 4 1.50 7 1.35 0.54*2.77<br />
50 Hairdressers 6 1.10 1 3.58 [0.12] 0.00 1 0.34 6 1.07 14 0.97 0.53*1.63<br />
51 Launderers 3 1.18 [0.27] 0.00 [0.02] 0.00 2 1.25 5 1.20 10 1.16 0.56*2.13<br />
52 Military personnel 14 0.94 12 1.83 32 1.47 23 0.87 81 1.16 0.92*1.44<br />
53 ‘‘Other workers’’ 63 0.94 10 0.75 9 1.65 62 0.85 67 0.86 211 0.89 0.78*1.02<br />
54 Economically inactive 44 1.12 78 1.33 8 1.32 64 1.21 215 1.04 409 1.12 1.02*1.24<br />
1 54 All categories 1 618 1.00 814 1.00 81 1.00 1 851 1.00 3 155 1.00 7 519 1.00 Ref.<br />
Obs observed number of cases; SIR st<strong>and</strong>ardised incidence ratio; 95% CI 95% confidence interval.
Acta Oncol Downloaded from informahealthcare.com by 212.35.100.66 on 04/06/11<br />
For personal use only.<br />
(30 years) <strong>and</strong> were therefore excluded from the<br />
analyses. Furthermore, for the cases diagnosed<br />
shortly after the age of 30, the duration of the<br />
occupational exposures before <strong>cancer</strong> diagnosis are<br />
relatively short. The aetiology of testicular <strong>cancer</strong><br />
is largely unknown. Men from higher social classes<br />
seem to be more affected than men in lower social<br />
classes, although the socioeconomic differences<br />
in incidence seem to be diminishing over time<br />
[111,112].<br />
Risk factors for testicular <strong>cancer</strong> include some<br />
genetic disorders, birth defects as cryptorchidism<br />
<strong>and</strong> maldescendent testis <strong>and</strong> testicular trauma, but<br />
previous studies have not identified consistent associations<br />
between occupational exposures <strong>and</strong> testicular<br />
<strong>cancer</strong> [112 114]. One of the explanations<br />
offered is the quality of the semen, which seems to<br />
decrease along with the increasing quality of life.<br />
Many of the high-risk occupations in the present<br />
study were of high social strata, but on the other<br />
h<strong>and</strong> there was an increased risk, although not<br />
statistically significant, in occupations such as chimney<br />
sweeps, shoe <strong>and</strong> leather workers <strong>and</strong> printers<br />
that may offer hints of direct occupational risk<br />
factors such as dusts.<br />
Penile <strong>cancer</strong><br />
The highest rates of ‘‘<strong>cancer</strong> of other male genitals’’<br />
(code 179 in ICD-7) are observed in Denmark, <strong>and</strong><br />
half of the incidence rates in Denmark are observed<br />
in Finl<strong>and</strong>. About 95% of these rare malignancies<br />
are penile <strong>cancer</strong>s. There seems to be a temporal<br />
increase in Sweden, but no clear trends in other<br />
countries (Figure 35).<br />
Journalists have the highest risk for <strong>cancer</strong> of<br />
the penis with an SIR 2.40 (95% CI 1.55 3.54).<br />
Other occupational categories with significant eleva-<br />
/ 100 000<br />
2<br />
1<br />
0<br />
1945 1960 1975 1990 2005<br />
tions are drivers, packers <strong>and</strong> sales agents. The<br />
lowest risks were observed among physicians (0.51,<br />
0.25 0.91) <strong>and</strong> teachers (Table 49).<br />
Comment. Infection with oncogenic strains of human<br />
papilloma virus (HPV) is the major established risk<br />
factor for penile <strong>cancer</strong> [115]. Smoking has also<br />
been identified as a risk factor for penile <strong>cancer</strong>,<br />
specifically where the HPV prevalence is low. Social<br />
class is not clearly associated with the risk of penile<br />
<strong>cancer</strong> in previous studies [111,116] but the present<br />
study suggests that professions associated with high<br />
education have a decreased penile <strong>cancer</strong> risk. Earlier<br />
studies have not pointed towards any evident<br />
high-risk occupations of penile <strong>cancer</strong> <strong>and</strong> therefore,<br />
e.g., the quite strong finding of an excess risk among<br />
the Nordic journalists needs to be interpreted with<br />
caution.<br />
Cancer of kidney <strong>and</strong> renal pelvis<br />
Incidence of <strong>cancer</strong> of the kidney <strong>and</strong> renal pelvis<br />
in the Nordic countries varies considerably, with<br />
the highest SIR observed in Icel<strong>and</strong> (Figure 36).<br />
Incidence in men is about twice the incidence in<br />
women, but the ratio varies between countries. The<br />
incidence in Sweden turned to a decrease around<br />
the year 1980 <strong>and</strong> in Finl<strong>and</strong> in the 1990s, while<br />
there is still an increasing trend in Norway for both<br />
men <strong>and</strong> women.<br />
Among men, waiters (SIR 1.29, 95% CI 1.04<br />
1.57), welders, <strong>and</strong> cooks <strong>and</strong> stewards have the<br />
highest risk of kidney <strong>cancer</strong> (Table 50). The lowest<br />
significant risk was seen among forestry workers<br />
(0.77, 0.72 0.82) <strong>and</strong> farmers (0.77, 0.75 0.79).<br />
None of the female occupations showed a significantly<br />
elevated risk of kidney <strong>cancer</strong> above 1.2. The<br />
Men<br />
<strong>Occupation</strong> <strong>and</strong> <strong>cancer</strong> in Nordic countries 721<br />
Denmark<br />
Finl<strong>and</strong><br />
Icel<strong>and</strong><br />
Norway<br />
Sweden<br />
Figure 35. Age st<strong>and</strong>ardised (World) incidence rates for <strong>cancer</strong> of the other male genitals 1943 2005, by country. Modified from<br />
NORDCAN [49].
Acta Oncol Downloaded from informahealthcare.com by 212.35.100.66 on 04/06/11<br />
For personal use only.<br />
722 E. Pukkala et al.<br />
Table 49. Observed number of <strong>cancer</strong> of the penis among men in the Nordic countries <strong>and</strong> st<strong>and</strong>ardised incidence ratios 1961 2005, by<br />
country <strong>and</strong> occupational category.<br />
Denmark Finl<strong>and</strong> Icel<strong>and</strong> Norway Sweden Total<br />
No <strong>Occupation</strong>al category Obs SIR Obs SIR Obs SIR Obs SIR Obs SIR Obs SIR 95% CI<br />
1 Technical workers, etc 60 0.95 22 0.79 2 3.16 45 1.26 165 0.82 294 0.89 0.80*1.00<br />
2 Laboratory assistants [1.22] 0.00 2 2.80 [0.12] 0.00 2 1.16 1 0.86 5 1.01 0.33*2.36<br />
3 Physicians 4 0.76 2 1.25 [0.25] 0.00 1 0.20 4 0.42 11 0.51 0.25*0.91<br />
4 Dentists 2 1.31 [0.33] 0.00 [0.06] 0.00 3 1.34 1 0.22 6 0.69 0.25*1.50<br />
5 Nurses [0.07] 0.00 [0.12] 0.00 [0.00] 0.00 [0.21] 0.00 [0.77] 0.00 [1.17] 0.00 0.00*3.14<br />
6 Assistant nurses 3 2.01 [0.11] 0.00 [0.03] 0.00 1 1.22 3 0.84 7 1.16 0.47*2.40<br />
7 ‘‘Other health workers’’ 4 0.90 1 0.66 [0.07] 0.00 4 2.13 9 1.13 18 1.13 0.67*1.79<br />
8 Teachers 26 0.93 8 0.73 2 2.23 17 0.62 37 0.69 90 0.75 0.60*0.92<br />
9 Religious workers etc 8 0.67 5 0.75 2 3.26 19 1.36 36 0.84 70 0.92 0.72*1.17<br />
10 Artistic workers 1 0.28 3 1.38 [0.16] 0.00 1 0.25 12 0.97 17 0.76 0.44*1.22<br />
11 Journalists 3 1.79 3 2.84 [0.10] 0.00 2 1.15 17 2.91 25 2.40 1.55*3.54<br />
12 Administrators 74 1.05 14 0.85 1 0.64 54 1.11 72 0.95 215 1.01 0.88*1.15<br />
13 Clerical workers 32 1.04 14 1.32 1 0.56 38 1.06 92 1.12 177 1.10 0.95*1.27<br />
14 Sales agents 18 1.12 16 1.03 1 1.10 52 1.23 138 1.15 225 1.15 1.01*1.31<br />
15 Shop workers 80 1.13 4 0.58 [0.62] 0.00 18 1.12 36 0.94 138 1.04 0.88*1.23<br />
16 Farmers 103 0.73 58 0.88 1 0.38 93 0.75 176 0.90 431 0.81 0.74*0.89<br />
17 Gardeners 22 1.12 10 0.99 [0.08] 0.00 26 0.89 57 0.78 115 0.87 0.72*1.04<br />
18 Fishermen 4 0.63 1 1.12 2 1.32 33 0.88 5 0.64 45 0.83 0.61*1.12<br />
19 Forestry workers 2 0.70 11 0.93 [0.01] 0.00 20 0.90 63 1.19 96 1.07 0.86*1.30<br />
20 Miners <strong>and</strong> quarry workers 1 1.17 3 1.54 [0.02] 0.00 8 1.35 16 1.20 28 1.27 0.84*1.83<br />
21 Seamen 17 2.53 3 1.12 [0.42] 0.00 25 0.85 12 1.01 57 1.11 0.84*1.44<br />
22 Transport workers 13 0.87 7 0.94 2 2.39 9 0.58 37 0.94 68 0.87 0.68*1.10<br />
23 Drivers 62 1.29 27 1.07 4 3.36 58 1.36 129 1.29 280 1.29 1.15*1.45<br />
24 Postal workers 11 1.16 3 0.78 [0.16] 0.00 11 1.27 22 0.99 47 1.06 0.78*1.41<br />
25 Textile workers 14 1.61 2 0.84 [0.27] 0.00 7 0.76 19 0.81 42 0.96 0.69*1.29<br />
26 Shoe <strong>and</strong> leather workers 2 0.94 3 2.89 [0.06] 0.00 3 0.75 7 0.76 15 0.91 0.51*1.51<br />
27 Smelting workers 21 1.10 3 0.80 [0.38] 0.00 11 0.89 42 1.12 77 1.05 0.83*1.32<br />
28 Mechanics 47 0.91 24 0.93 1 0.86 60 1.01 175 0.97 307 0.96 0.86*1.08<br />
29 Plumbers 7 1.50 9 2.09 2 10.52 10 1.48 20 0.97 48 1.31 0.97*1.74<br />
30 Welders 4 0.91 [0.07] 0.00 6 0.80 18 0.75 28 0.78 0.52*1.12<br />
31 Electrical workers 15 1.23 10 0.89 [0.71] 0.00 27 1.02 54 0.85 106 0.93 0.77*1.13<br />
32 Wood workers 25 0.69 23 0.91 [0.69] 0.00 57 0.82 97 0.82 202 0.81 0.70*0.93<br />
33 Painters 8 0.68 9 1.65 [0.29] 0.00 7 0.60 38 1.10 62 0.97 0.75*1.25<br />
34 ‘‘Other construction workers’’ 43 0.96 19 1.16 [1.36] 0.00 14 1.01 70 1.10 146 1.04 0.89*1.22<br />
35 Bricklayers 9 0.68 4 1.55 2 0.29 13 0.85 28 0.74 0.49*1.07<br />
36 Printers 7 0.84 1 0.37 1 4.42 6 0.84 25 1.31 40 1.07 0.76*1.45<br />
37 Chemical process workers 5 0.66 3 0.71 [0.12] 0.00 18 1.14 29 1.02 55 0.98 0.74*1.27<br />
38 Food workers 18 0.73 2 0.66 [1.06] 0.00 24 1.35 32 1.11 76 1.01 0.79*1.26<br />
39 Beverage workers 6 2.08 1 5.00 [0.02] 0.00 [0.19] 0.00 3 1.85 10 2.03 0.98*3.74<br />
40 Tobacco workers 1 2.03 [0.04] 0.00 [0.00] 0.00 1 3.62 [0.13] 0.00 2 2.12 0.26*7.67<br />
41 Glass makers etc 14 0.97 3 0.66 [0.17] 0.00 12 1.40 31 0.98 60 1.01 0.77*1.30<br />
42 Packers 21 1.63 6 0.67 2 3.24 33 1.23 73 1.28 135 1.27 1.07*1.50<br />
43 Engine operators 13 0.99 14 1.10 [0.81] 0.00 18 1.20 50 1.02 95 1.05 0.85*1.28<br />
44 Public safety workers 8 0.63 8 1.12 1 1.81 12 1.07 31 1.07 60 0.99 0.75*1.27<br />
45 Cooks <strong>and</strong> stewards 1 1.06 [0.53] 0.00 [0.27] 0.00 3 0.60 9 1.64 13 1.06 0.57*1.82<br />
46 Domestic assistants [0.01] 0.00 [0.03] 0.00 [0.00] 0.00 [0.04] 0.00 1 1.64 1 1.44 0.04*8.04<br />
47 Waiters 4 2.13 [0.53] 0.00 [0.03] 0.00 4 1.86 3 1.08 11 1.49 0.75*2.67<br />
48 Building caretakers 7 0.54 4 0.68 [0.25] 0.00 9 1.49 23 1.00 43 0.90 0.65*1.21<br />
49 Chimney sweeps [0.33] 0.00 1 2.32 [0.59] 0.00 1 0.61 2 0.67 0.08*2.42<br />
50 Hairdressers 5 1.32 [0.13] 0.00 [0.04] 0.00 1 0.58 5 0.90 11 0.98 0.49*1.75<br />
51 Launderers 2 1.08 [0.13] 0.00 [0.02] 0.00 4 3.94 4 1.01 10 1.43 0.69*2.63<br />
52 Military personnel 9 1.42 2 0.79 12 1.31 18 1.07 41 1.18 0.84*1.60<br />
53 ‘‘Other workers’’ 41 1.05 9 1.28 2 0.84 51 0.98 75 1.09 178 1.05 0.91*1.22<br />
54 Economically inactive 63 1.73 51 1.40 1 0.64 38 1.27 146 1.33 299 1.40 1.25*1.56<br />
1 54 All categories 966 1.00 432 1.00 28 1.00 990 1.00 2 252 1.00 4 668 1.00 Ref.<br />
Obs observed number of cases; SIR st<strong>and</strong>ardised incidence ratio; 95% CI 95% confidence interval.
Acta Oncol Downloaded from informahealthcare.com by 212.35.100.66 on 04/06/11<br />
For personal use only.<br />
/ 100 000<br />
15<br />
10<br />
5<br />
Denmark<br />
Finl<strong>and</strong><br />
Icel<strong>and</strong><br />
Norway<br />
Sweden<br />
Men<br />
0<br />
1945 1960 1975 1990 2005<br />
lowest significant risks were found for women working<br />
as dentists (0.56, 0.33 0.90), technical workers<br />
<strong>and</strong> laboratory assistants (Table 51).<br />
The variation of the SIR was essentially larger<br />
when focused on only renal pelvis <strong>cancer</strong><br />
(http://astra.<strong>cancer</strong>.fi/NOCCA/Incidence/renal-pel<br />
vis), which constitutes about one-tenth of renal<br />
<strong>cancer</strong>s. High SIRs of <strong>cancer</strong> in men for renal pelvis<br />
<strong>cancer</strong> was observed among seamen (1.52, 1.26<br />
1.85), printers (1.39, 1.09 1.74), welders (1.39,<br />
1.05 1.80), public safety workers (1.34, 1.12 1.61)<br />
<strong>and</strong> textile workers (1.30, 1.04 1.61). Low-risk<br />
occupational groups included forestry workers<br />
(0.48, 0.36 0.62) <strong>and</strong> farmers (0.60, 0.55 0.66).<br />
Among women, a small increase in risk was found<br />
in clerical workers (1.19, 1.08 1.31) <strong>and</strong> shop<br />
workers (1.16, 1.04 1.31). Female religious etc.<br />
workers, on the contrary had the lowest significant<br />
risk (0.53, 0.29 0.89), followed by farmers (0.57,<br />
0.45 0.72) <strong>and</strong> gardeners (0.66, 0.50 0.86).<br />
Comment. Kidney <strong>cancer</strong> is associated with smoking<br />
<strong>and</strong> obesity [117]. Exposures <strong>and</strong> occupations<br />
previously reported to be associated with kidney<br />
<strong>cancer</strong> in a consistent way include trichloroethylene<br />
<strong>and</strong> coke production [118]. Workers in petroleumrelated<br />
<strong>and</strong> dry-cleaning industries, as well as workers<br />
exposed to gasoline, have previously been found<br />
to have an increased risk of renal <strong>cancer</strong> in Finl<strong>and</strong>.<br />
In the present study relatively little variation between<br />
occupations were seen, <strong>and</strong> no occupation presented<br />
a very high or very low SIR. In particular among<br />
women, there were no indications of any increased<br />
risk of kidney <strong>cancer</strong> associated with occupations.<br />
Work-related risks for <strong>cancer</strong> of the renal pelvis<br />
have been observed to resemble the occupational<br />
associations that are more clearly established for<br />
bladder <strong>cancer</strong> [117]. In the present study, all<br />
/ 100 000<br />
15<br />
10<br />
5<br />
<strong>Occupation</strong> <strong>and</strong> <strong>cancer</strong> in Nordic countries 723<br />
Denmark<br />
Finl<strong>and</strong><br />
Icel<strong>and</strong><br />
Norway<br />
Sweden<br />
Women<br />
0<br />
1945 1960 1975 1990 2005<br />
Figure 36. Age st<strong>and</strong>ardised (World) incidence rates for kidney <strong>cancer</strong> 1943 2005, by country <strong>and</strong> gender. Modified from NORDCAN<br />
[49].<br />
occupations with the highest SIR for <strong>cancer</strong> of the<br />
renal pelvis also had SIRs above 1.0 for bladder<br />
<strong>cancer</strong> (Tables 52 <strong>and</strong> 53), but the relative excess<br />
tended to be larger in renal cell <strong>cancer</strong>.<br />
Bladder <strong>cancer</strong><br />
The incidence of bladder <strong>cancer</strong> in the Nordic<br />
countries is several times higher in males than in<br />
females (Figure 37). There was an increasing<br />
incidence over time until the 1980s. The increase<br />
then levelled off in all countries, <strong>and</strong> even started to<br />
decline in Denmark <strong>and</strong> Finl<strong>and</strong>.<br />
Among men, the highest SIRs were observed<br />
in waiters (SIR 1.50, 95% CI 1.32 1.69), chimney<br />
sweeps, hairdressers, assistant nurses, seamen,<br />
cooks <strong>and</strong> stewards, plumbers <strong>and</strong> beverage workers<br />
(Table 52). The SIRs were lowest among farmers<br />
(0.68, 0.67 0.70), forestry workers <strong>and</strong> gardeners.<br />
The highest risks among women were found in<br />
tobacco workers (2.01, 1.49 2.65), printers, waiters,<br />
chemical process workers, sales agents <strong>and</strong> hairdressers<br />
(Table 53). Farmers (0.66, 0.62 0.72) <strong>and</strong><br />
gardeners had SIRs significantly below 1.0.<br />
Comment. Cigarette smoking is a well established<br />
cause of bladder <strong>cancer</strong> [121]. Several chemical<br />
exposures have been associated with the development<br />
of bladder <strong>cancer</strong>. They include 4-aminobiphenyl,<br />
benzidine, coal tars <strong>and</strong> pitches, mineral<br />
oils, untreated <strong>and</strong> mildly treated 2-naphthylaminec,<br />
benz[a]anthracene, benz[a]pyrene, benzidinebased<br />
dyes, 4-chloro-ortho-toluidine, dibenz[a, h]<br />
anthracene, diesel engine exhaust, 4,4 -methylenebis(2-chloroaniline)<br />
(MOCA) <strong>and</strong> polychlorinated<br />
biphenyls [95]. Some industrial processes <strong>and</strong><br />
occupations have also been identified as being<br />
associated with the development of bladder can-
Acta Oncol Downloaded from informahealthcare.com by 212.35.100.66 on 04/06/11<br />
For personal use only.<br />
724 E. Pukkala et al.<br />
Table 50. Observed number of kidney <strong>cancer</strong> among men in the Nordic countries <strong>and</strong> st<strong>and</strong>ardised incidence ratios 1961 2005, by country<br />
<strong>and</strong> occupational category.<br />
Denmark Finl<strong>and</strong> Icel<strong>and</strong> Norway Sweden Total<br />
No <strong>Occupation</strong>al category Obs SIR Obs SIR Obs SIR Obs SIR Obs SIR Obs SIR 95% CI<br />
1 Technical workers, etc 418 1.02 652 1.10 6 0.67 332 0.91 2 239 1.05 3 647 1.04 1.01*1.08<br />
2 Laboratory assistants 3 0.37 16 1.08 3 1.81 12 0.69 8 0.78 42 0.80 0.58*1.08<br />
3 Physicians 29 0.87 41 1.19 4 1.19 35 0.75 95 0.99 204 0.95 0.83*1.09<br />
4 Dentists 10 1.02 8 1.14 1 1.11 20 0.97 50 1.05 89 1.03 0.83*1.27<br />
5 Nurses 1 2.17 3 1.51 [0.03] 0.00 [2.18] 0.00 3 0.60 7 0.72 0.29*1.49<br />
6 Assistant nurses 8 0.82 2 1.07 1 2.22 4 0.50 44 1.30 59 1.10 0.83*1.41<br />
7 ‘‘Other health workers’’ 25 0.85 30 0.92 2 2.17 19 1.05 83 1.02 159 0.98 0.84*1.14<br />
8 Teachers 151 0.85 197 0.79 15 1.20 217 0.83 510 0.94 1 090 0.88 0.83*0.93<br />
9 Religious workers etc 85 1.14 130 0.97 10 1.21 111 0.83 415 0.99 751 0.98 0.91*1.05<br />
10 Artistic workers 26 1.11 45 0.95 4 1.81 46 1.18 135 1.04 256 1.06 0.94*1.20<br />
11 Journalists 9 0.81 25 1.08 2 1.53 16 0.93 80 1.32 132 1.17 0.98*1.38<br />
12 Administrators 469 1.02 416 1.14 26 1.29 479 1.02 911 1.11 2 301 1.08 1.04*1.12<br />
13 Clerical workers 208 1.03 263 1.11 27 1.17 371 1.05 941 1.06 1 810 1.06 1.01*1.11<br />
14 Sales agents 141 1.32 402 1.16 7 0.60 429 1.06 1 419 1.10 2 398 1.11 1.07*1.16<br />
15 Shop workers 553 1.20 179 1.19 5 0.60 173 1.08 441 1.06 1 351 1.13 1.07*1.19<br />
16 Farmers 563 0.64 1256 0.80 31 0.93 862 0.78 1 746 0.79 4 458 0.77 0.75*0.79<br />
17 Gardeners 102 0.81 185 0.79 1 0.90 244 0.88 701 0.85 1 233 0.84 0.80*0.89<br />
18 Fishermen 61 1.43 19 0.93 18 0.83 393 1.11 81 0.93 572 1.08 1.00*1.18<br />
19 Forestry workers 7 0.38 192 0.69 [0.20] 0.00 155 0.76 495 0.82 849 0.77 0.72*0.82<br />
20 Miners <strong>and</strong> quarry workers 4 0.70 49 1.09 1 2.84 67 1.15 157 1.05 278 1.07 0.95*1.21<br />
21 Seamen 59 1.27 83 1.38 8 1.44 339 1.15 139 1.06 628 1.17 1.08*1.26<br />
22 Transport workers 104 1.03 187 1.08 12 1.12 187 1.21 466 1.06 956 1.09 1.02*1.16<br />
23 Drivers 355 1.08 688 1.19 10 0.62 519 1.21 1 175 1.09 2 747 1.13 1.09*1.18<br />
24 Postal workers 62 0.98 94 1.10 4 2.00 68 0.84 232 0.99 460 0.99 0.90*1.08<br />
25 Textile workers 62 1.07 62 1.12 4 1.18 104 1.18 243 0.92 475 1.01 0.93*1.11<br />
26 Shoe <strong>and</strong> leather workers 15 1.05 22 0.93 1 1.39 46 1.24 102 0.97 186 1.03 0.89*1.19<br />
27 Smelting workers 166 1.28 66 0.77 2 0.41 138 1.15 442 1.05 814 1.07 1.00*1.15<br />
28 Mechanics 350 1.00 622 1.10 16 0.99 627 1.06 2 054 1.06 3 669 1.06 1.02*1.09<br />
29 Plumbers 41 1.31 104 1.08 2 0.78 72 1.04 252 1.12 471 1.11 1.02*1.22<br />
30 Welders 112 1.20 2 2.04 105 1.34 314 1.23 533 1.25 1.14*1.36<br />
31 Electrical workers 101 1.22 245 1.01 14 1.44 267 1.02 662 0.99 1 289 1.02 0.97*1.08<br />
32 Wood workers 243 1.02 563 0.97 7 0.79 606 0.90 1 183 0.91 2 602 0.93 0.89*0.97<br />
33 Painters 80 1.01 117 0.94 2 0.57 119 1.05 353 0.94 671 0.96 0.89*1.04<br />
34 ‘‘Other construction workers’’ 300 1.00 373 0.99 11 0.59 137 1.01 667 0.94 1 488 0.97 0.92*1.02<br />
35 Bricklayers 90 1.04 51 0.84 72 1.07 172 1.01 385 1.00 0.90*1.10<br />
36 Printers 49 0.88 63 1.08 1 0.34 83 1.20 199 0.98 395 1.01 0.92*1.12<br />
37 Chemical process workers 41 0.80 99 1.03 [1.61] 0.00 121 0.81 309 0.98 570 0.93 0.85*1.01<br />
38 Food workers 181 1.09 89 1.28 11 0.79 190 1.11 341 1.07 812 1.10 1.03*1.18<br />
39 Beverage workers 30 1.46 4 0.91 [0.24] 0.00 2 1.00 16 0.88 52 1.15 0.86*1.50<br />
40 Tobacco workers 4 1.21 1 1.24 [0.01] 0.00 5 1.93 2 1.40 12 1.47 0.76*2.57<br />
41 Glass makers etc 91 0.93 87 0.87 4 1.60 91 1.08 323 0.93 596 0.94 0.87*1.02<br />
42 Packers 101 1.16 194 0.96 12 1.52 264 1.03 693 1.10 1 264 1.07 1.01*1.13<br />
43 Engine operators 87 0.99 326 1.14 12 1.08 147 0.98 570 1.08 1 142 1.08 1.02*1.14<br />
44 Public safety workers 91 1.12 174 1.09 9 1.17 144 1.30 350 1.15 768 1.16 1.08*1.24<br />
45 Cooks <strong>and</strong> stewards 11 1.68 14 1.37 3 0.80 59 1.18 68 1.24 155 1.24 1.06*1.45<br />
46 Domestic assistants [0.07] 0.00 1 1.77 [0.01] 0.00 1 2.35 2 0.45 4 0.72 0.20*1.84<br />
47 Waiters 28 2.00 11 1.11 [0.42] 0.00 29 1.36 28 0.97 96 1.29 1.04*1.57<br />
48 Building caretakers 86 0.98 133 1.01 2 0.63 61 1.08 249 1.03 531 1.02 0.93*1.11<br />
49 Chimney sweeps 2 0.88 8 0.81 6 1.03 26 1.47 42 1.18 0.85*1.59<br />
50 Hairdressers 36 1.45 2 0.73 [0.54] 0.00 20 1.21 61 0.98 119 1.11 0.93*1.33<br />
51 Launderers 11 0.91 3 1.06 [0.30] 0.00 10 1.02 38 0.85 62 0.89 0.68*1.14<br />
52 Military personnel 41 0.97 76 1.37 118 1.24 182 1.02 417 1.12 1.02*1.24<br />
53 ‘‘Other workers’’ 280 1.04 147 0.93 37 1.22 510 1.06 697 0.91 1 671 0.98 0.93*1.03<br />
54 Economically inactive 304 1.13 785 1.01 23 1.03 239 0.98 1 225 1.05 2 576 1.04 1.00*1.08<br />
1 54 All categories 6 375 1.00 9 716 1.00 373 1.00 9 491 1.00 24 389 1.00 50 344 1.00 Ref.<br />
Obs observed number of cases; SIR st<strong>and</strong>ardised incidence ratio; 95% CI 95% confidence interval.
Acta Oncol Downloaded from informahealthcare.com by 212.35.100.66 on 04/06/11<br />
For personal use only.<br />
Table 51. Observed number of kidney <strong>cancer</strong> among women in the Nordic countries <strong>and</strong> st<strong>and</strong>ardised incidence ratios 1961 2005, by<br />
country <strong>and</strong> occupational category.<br />
Denmark Finl<strong>and</strong> Icel<strong>and</strong> Norway Sweden Total<br />
No <strong>Occupation</strong>al category Obs SIR Obs SIR Obs SIR Obs SIR Obs SIR Obs SIR 95% CI<br />
1 Technical workers, etc 12 0.83 21 0.58 [0.61] 0.00 6 0.80 49 0.75 88 0.71 0.57*0.87<br />
2 Laboratory assistants 9 0.89 16 0.74 [0.91] 0.00 6 0.61 10 0.68 41 0.72 0.52*0.97<br />
3 Physicians 3 0.63 7 0.80 [0.16] 0.00 1 0.25 11 0.78 22 0.69 0.43*1.05<br />
4 Dentists 2 0.47 4 0.38 [0.06] 0.00 1 0.29 10 0.84 17 0.56 0.33*0.90<br />
5 Nurses 68 0.81 100 0.92 6 1.36 58 0.75 183 0.91 415 0.87 0.79*0.96<br />
6 Assistant nurses 47 0.77 85 0.72 5 0.81 72 0.93 342 0.99 551 0.91 0.83*0.98<br />
7 ‘‘Other health workers’’ 40 0.83 68 0.75 2 1.59 71 0.91 124 1.09 305 0.92 0.82*1.03<br />
8 Teachers 75 0.72 205 1.00 4 0.52 120 0.82 380 0.84 784 0.86 0.80*0.92<br />
9 Religious workers etc 7 0.49 94 1.05 1 0.85 25 0.68 117 0.84 244 0.87 0.77*0.99<br />
10 Artistic workers 6 0.80 18 1.14 [0.96] 0.00 7 0.62 25 0.88 56 0.87 0.66*1.13<br />
11 Journalists [1.60] 0.00 10 0.95 [0.24] 0.00 2 0.68 11 0.85 23 0.81 0.52*1.22<br />
12 Administrators 44 0.97 33 0.97 [0.78] 0.00 30 0.81 46 0.71 153 0.84 0.72*0.98<br />
13 Clerical workers 420 0.97 621 0.95 24 1.00 458 0.95 1 034 0.92 2 557 0.94 0.90*0.98<br />
14 Sales agents 3 0.75 114 1.14 5 1.91 59 0.84 158 0.93 339 0.97 0.88*1.08<br />
15 Shop workers 298 0.99 374 1.00 14 0.91 370 0.89 763 1.01 1 819 0.98 0.94*1.03<br />
16 Farmers 174 0.84 226 0.96 14 1.21 317 1.09 75 1.09 806 0.99 0.93*1.06<br />
17 Gardeners 21 0.77 692 0.99 1 2.55 196 1.12 177 0.88 1 087 0.99 0.93*1.05<br />
18 Fishermen 1 0.95 [1.46] 0.00 [0.39] 0.00 1 0.48 1 1.56 3 0.53 0.11*1.56<br />
19 Forestry workers [0.28] 0.00 2 0.72 [0.05] 0.00 2 0.62 5 1.21 9 0.86 0.39*1.63<br />
20 Miners <strong>and</strong> quarry workers [0.02] 0.00 [1.24] 0.00 [0.01] 0.00 [0.15] 0.00 1 1.06 1 0.42 0.01*2.36<br />
21 Seamen [0.32] 0.00 [0.00] 0.00 [0.48] 0.00 [0.09] 0.00 [0.89] 0.00 0.00*4.16<br />
22 Transport workers [0.30] 0.00 28 1.47 1 2.36 1 0.47 11 0.97 41 1.23 0.88*1.67<br />
23 Drivers 6 0.80 5 0.62 [0.19] 0.00 5 0.62 28 1.05 44 0.87 0.63*1.17<br />
24 Postal workers 13 0.82 119 1.05 6 1.14 102 1.07 230 1.11 470 1.07 0.98*1.18<br />
25 Textile workers 113 1.12 252 0.99 11 1.12 139 0.88 472 1.04 987 1.01 0.95*1.07<br />
26 Shoe <strong>and</strong> leather workers 1 0.13 27 0.85 2 3.90 11 0.97 42 1.20 83 0.97 0.77*1.20<br />
27 Smelting workers 3 1.65 9 1.19 [0.02] 0.00 1 0.89 6 0.71 19 1.00 0.60*1.57<br />
28 Mechanics 14 0.79 26 0.81 [0.09] 0.00 14 1.04 116 1.33 170 1.13 0.97*1.31<br />
29 Plumbers [0.17] 0.00 [0.07] 0.00 [0.09] 0.00 [0.10] 0.00 [0.43] 0.00 0.00*8.53<br />
30 Welders 4 1.66 [0.01] 0.00 [0.88] 0.00 3 1.02 7 1.12 0.45*2.31<br />
31 Electrical workers 29 1.17 18 0.91 [0.08] 0.00 14 0.98 53 1.11 114 1.07 0.89*1.28<br />
32 Wood workers 13 1.57 63 0.95 [0.16] 0.00 4 0.86 10 0.71 90 0.96 0.78*1.19<br />
33 Painters [0.32] 0.00 6 0.77 [0.04] 0.00 [1.09] 0.00 2 0.52 8 0.61 0.26*1.21<br />
34 ‘‘Other construction workers’’ [0.25] 0.00 39 1.45 [0.03] 0.00 [0.41] 0.00 [0.41] 0.00 39 1.39 0.99*1.90<br />
35 Bricklayers [0.05] 0.00 [0.87] 0.00 [0.02] 0.00 [0.01] 0.00 [0.95] 0.00 0.00*3.87<br />
36 Printers 13 1.38 28 0.88 1 1.24 14 1.08 42 1.12 98 1.06 0.86*1.29<br />
37 Chemical process workers 19 1.27 9 0.54 [0.37] 0.00 10 0.85 35 1.15 73 0.98 0.77*1.24<br />
38 Food workers 73 1.01 88 1.01 16 0.81 86 1.12 94 1.00 357 1.02 0.92*1.13<br />
39 Beverage workers 12 1.71 2 0.40 [0.05] 0.00 1 1.53 3 0.50 18 0.96 0.57*1.52<br />
40 Tobacco workers 11 1.14 3 1.07 3 1.11 5 1.41 22 1.18 0.74*1.78<br />
41 Glass makers etc 17 0.97 49 0.81 1 1.87 27 1.07 75 0.93 169 0.92 0.79*1.07<br />
42 Packers 3 0.59 124 1.15 2 1.03 78 1.28 123 1.01 330 1.11 1.00*1.24<br />
43 Engine operators [0.14] 0.00 19 1.11 [0.03] 0.00 1 1.32 3 0.45 23 0.93 0.59*1.40<br />
44 Public safety workers [0.61] 0.00 11 2.90 [0.39] 0.00 7 0.94 7 0.85 25 1.22 0.79*1.80<br />
45 Cooks <strong>and</strong> stewards [0.19] 0.00 120 1.01 8 1.08 104 1.20 176 0.95 408 1.03 0.93*1.13<br />
46 Domestic assistants 130 1.15 108 0.91 2 0.92 192 0.85 435 0.96 867 0.95 0.89*1.02<br />
47 Waiters 21 1.08 96 0.96 [0.83] 0.00 85 0.92 198 1.05 400 1.00 0.91*1.10<br />
48 Building caretakers 362 1.10 446 1.08 21 1.40 444 1.13 540 1.13 1 813 1.11 1.06*1.17<br />
49 Chimney sweeps [0.03] 0.00 [0.21] 0.00 [0.06] 0.00 [0.01] 0.00 [0.31] 0.00 0.00*11.91<br />
50 Hairdressers 23 1.21 34 0.92 1 1.29 21 0.90 70 0.95 149 0.97 0.82*1.14<br />
51 Launderers 41 1.10 24 0.71 [2.45] 0.00 25 0.72 111 1.10 201 0.96 0.84*1.10<br />
52 Military personnel 2 10.28 [0.32] 0.00 [0.10] 0.00 [0.21] 0.00 2 2.44 0.30*8.80<br />
53 ‘‘Other workers’’ 100 1.08 134 1.07 17 1.13 195 0.97 221 1.05 667 1.04 0.96*1.12<br />
54 Economically inactive 2 571 1.02 2 893 1.04 51 0.96 2 765 1.04 10 324 1.01 18 604 1.02 1.01*1.04<br />
1 54 All categories 4 820 1.00 7 474 1.00 216 1.00 6 151 1.00 16 957 1.00 35 618 1.00 Ref.<br />
Obs observed number of cases; SIR st<strong>and</strong>ardised incidence ratio; 95% CI 95% confidence interval.<br />
<strong>Occupation</strong> <strong>and</strong> <strong>cancer</strong> in Nordic countries 725
Acta Oncol Downloaded from informahealthcare.com by 212.35.100.66 on 04/06/11<br />
For personal use only.<br />
726 E. Pukkala et al.<br />
Table 52. Observed number of <strong>cancer</strong> of the bladder, ureter, <strong>and</strong> urethra among men in the Nordic countries <strong>and</strong> st<strong>and</strong>ardised incidence<br />
ratios 1961 2005, by country <strong>and</strong> occupational category.<br />
Denmark Finl<strong>and</strong> Icel<strong>and</strong> Norway Sweden Total<br />
No <strong>Occupation</strong>al category Obs SIR Obs SIR Obs SIR Obs SIR Obs SIR Obs SIR 95% CI<br />
1 Technical workers, etc 1 776 1.03 676 0.91 9 0.72 715 0.89 4 503 1.07 7 679 1.02 1.00*1.05<br />
2 Laboratory assistants 48 1.40 14 0.80 3 1.27 42 1.07 17 0.93 124 1.11 0.93*1.32<br />
3 Physicians 121 0.82 51 1.20 6 1.16 107 0.99 220 1.17 505 1.03 0.94*1.12<br />
4 Dentists 48 1.16 8 0.87 [1.23] 0.00 48 1.00 110 1.16 214 1.10 0.96*1.26<br />
5 Nurses 1 0.53 2 1.12 [0.03] 0.00 1 0.27 7 0.88 11 0.72 0.36*1.29<br />
6 Assistant nurses 50 1.22 1 0.70 [0.57] 0.00 28 1.48 80 1.28 159 1.28 1.09*1.49<br />
7 ‘‘Other health workers’’ 121 0.97 33 0.76 1 0.72 43 1.05 172 1.08 370 1.00 0.90*1.11<br />
8 Teachers 611 0.80 258 0.82 17 0.92 473 0.81 938 0.87 2297 0.84 0.80*0.87<br />
9 Religious workers etc 277 0.84 158 0.96 5 0.41 277 0.91 762 0.95 1 479 0.92 0.87*0.96<br />
10 Artistic workers 95 0.95 65 1.07 5 1.48 98 1.09 331 1.30 594 1.17 1.08*1.27<br />
11 Journalists 45 0.96 29 0.97 2 1.06 34 0.88 128 1.09 238 1.02 0.89*1.15<br />
12 Administrators 2 035 1.02 517 1.03 29 0.90 1 192 1.09 1 849 1.12 5622 1.07 1.04*1.10<br />
13 Clerical workers 885 1.04 362 1.08 43 1.19 797 0.97 2 041 1.16 4128 1.09 1.06*1.12<br />
14 Sales agents 547 1.23 476 1.03 14 0.76 1 054 1.11 3 004 1.19 5095 1.16 1.12*1.19<br />
15 Shop workers 2 132 1.07 188 1.01 14 1.11 366 1.01 909 1.11 3609 1.07 1.04*1.11<br />
16 Farmers 2 282 0.57 2135 0.84 31 0.58 2022 0.73 2 977 0.67 9447 0.68 0.67*0.70<br />
17 Gardeners 429 0.77 284 0.85 1 0.61 488 0.71 1 289 0.79 2491 0.77 0.74*0.81<br />
18 Fishermen 205 1.16 23 0.71 34 1.15 1 005 1.17 183 1.05 1 450 1.14 1.08*1.20<br />
19 Forestry workers 71 0.86 381 0.99 [0.26] 0.00 349 0.69 798 0.67 1599 0.74 0.71*0.78<br />
20 Miners <strong>and</strong> quarry workers 24 0.98 78 1.29 [0.50] 0.00 106 0.77 272 0.94 480 0.94 0.86*1.03<br />
21 Seamen 231 1.26 108 1.34 12 1.42 813 1.21 314 1.24 1478 1.23 1.17*1.30<br />
22 Transport workers 486 1.12 265 1.05 13 0.76 391 1.07 952 1.07 2 107 1.08 1.03*1.12<br />
23 Drivers 1 621 1.21 822 1.10 32 1.32 1 152 1.18 2 346 1.12 5973 1.15 1.12*1.18<br />
24 Postal workers 296 1.12 112 0.96 2 0.63 208 1.11 488 1.06 1 106 1.07 1.01*1.14<br />
25 Textile workers 273 1.11 78 0.96 4 0.73 241 1.11 537 1.02 1 133 1.05 0.99*1.12<br />
26 Shoe <strong>and</strong> leather workers 76 1.24 23 0.64 1 0.84 94 1.04 234 1.13 428 1.08 0.98*1.19<br />
27 Smelting workers 658 1.25 142 1.17 6 0.79 316 1.12 807 0.98 1 929 1.10 1.05*1.15<br />
28 Mechanics 1 636 1.14 773 1.05 21 0.91 1 574 1.17 4 134 1.08 8138 1.11 1.08*1.13<br />
29 Plumbers 166 1.31 149 1.23 5 1.31 195 1.27 507 1.15 1022 1.21 1.14*1.29<br />
30 Welders 131 1.22 2 1.47 198 1.15 491 0.99 822 1.06 0.99*1.13<br />
31 Electrical workers 395 1.20 307 1.01 11 0.80 682 1.15 1 363 1.05 2 758 1.09 1.05*1.13<br />
32 Wood workers 985 0.97 878 1.02 14 1.02 1 562 0.96 2 259 0.88 5698 0.94 0.91*0.96<br />
33 Painters 395 1.21 160 0.93 10 1.78 291 1.09 786 1.06 1 642 1.08 1.03*1.14<br />
34 ‘‘Other construction workers’’ 1 259 0.98 583 1.07 27 1.00 336 1.09 1 387 1.01 3 592 1.02 0.98*1.05<br />
35 Bricklayers 393 1.08 94 1.06 154 0.96 335 1.00 976 1.03 0.97*1.10<br />
36 Printers 260 1.16 81 1.13 8 1.80 198 1.27 471 1.19 1018 1.19 1.12*1.27<br />
37 Chemical process workers 219 1.01 141 1.11 2 0.81 367 1.03 660 1.07 1 389 1.05 1.00*1.11<br />
38 Food workers 790 1.14 111 1.20 23 1.09 442 1.09 702 1.11 2068 1.12 1.07*1.17<br />
39 Beverage workers 98 1.19 2 0.31 [0.36] 0.00 3 0.81 50 1.44 153 1.20 1.02*1.40<br />
40 Tobacco workers 15 1.06 1 0.91 [0.03] 0.00 9 1.48 4 1.44 29 1.20 0.80*1.72<br />
41 Glass makers etc 417 1.01 149 1.12 4 1.09 215 1.12 701 1.03 1 486 1.05 0.99*1.10<br />
42 Packers 380 1.03 302 1.06 12 0.97 706 1.17 1 300 1.06 2700 1.08 1.04*1.13<br />
43 Engine operators 360 0.98 416 1.15 15 0.93 363 1.10 1 066 1.05 2 220 1.06 1.02*1.10<br />
44 Public safety workers 430 1.22 242 1.12 8 0.69 260 1.00 625 1.05 1 565 1.09 1.04*1.15<br />
45 Cooks <strong>and</strong> stewards 36 1.42 8 0.66 7 1.31 116 1.05 142 1.38 309 1.21 1.08*1.35<br />
46 Domestic assistants 1 3.74 [1.04] 0.00 [0.02] 0.00 2 2.23 4 0.54 7 0.72 0.29*1.49<br />
47 Waiters 103 1.96 11 1.00 2 3.59 50 1.03 83 1.54 249 1.50 1.32*1.69<br />
48 Building caretakers 413 1.11 215 1.12 9 1.71 148 1.14 491 1.05 1 276 1.10 1.04*1.16<br />
49 Chimney sweeps 16 1.74 16 1.17 15 1.12 58 1.71 105 1.49 1.23*1.81<br />
50 Hairdressers 142 1.33 5 1.34 1 1.28 53 1.37 158 1.27 359 1.31 1.18*1.45<br />
51 Launderers 49 0.93 4 1.05 1 2.00 30 1.28 102 1.15 186 1.10 0.95*1.27<br />
52 Military personnel 204 1.16 62 0.98 245 1.13 404 1.12 915 1.12 1.05*1.19<br />
53 ‘‘Other workers’’ 1 268 1.16 195 0.88 63 1.32 1 155 1.00 1 400 0.94 4 081 1.02 0.99*1.05<br />
54 Economically inactive 1 189 1.14 1391 1.10 36 1.11 443 0.81 1 934 0.90 4 993 1.00 0.97*1.02<br />
1 54 All categories 27 063 1.00 13 716 1.00 565 1.00 22 272 1.00 47 885 1.00 111 501 1.00 Ref.<br />
Obs observed number of cases; SIR st<strong>and</strong>ardised incidence ratio; 95% CI 95% confidence interval.
Acta Oncol Downloaded from informahealthcare.com by 212.35.100.66 on 04/06/11<br />
For personal use only.<br />
Table 53. Observed number of <strong>cancer</strong> of the bladder, ureter, <strong>and</strong> urethra among women in the Nordic countries <strong>and</strong> st<strong>and</strong>ardised<br />
incidence ratios 1961 2005, by country <strong>and</strong> occupational category.<br />
Denmark Finl<strong>and</strong> Icel<strong>and</strong> Norway Sweden Total<br />
No <strong>Occupation</strong>al category Obs SIR Obs SIR Obs SIR Obs SIR Obs SIR Obs SIR 95% CI<br />
1 Technical workers, etc 30 1.15 21 1.19 [0.45] 0.00 8 0.95 67 1.04 126 1.08 0.90*1.28<br />
2 Laboratory assistants 17 0.93 17 1.60 [0.68] 0.00 10 0.87 14 0.98 58 1.05 0.79*1.35<br />
3 Physicians 8 0.91 6 1.45 [0.14] 0.00 2 0.43 8 0.58 24 0.76 0.49*1.13<br />
4 Dentists 6 0.77 6 1.02 [0.05] 0.00 3 0.72 6 0.51 21 0.71 0.44*1.08<br />
5 Nurses 141 0.91 67 1.25 2 0.56 85 0.94 209 1.05 504 1.00 0.92*1.10<br />
6 Assistant nurses 137 1.25 64 1.05 6 1.16 90 0.98 356 1.06 653 1.08 1.00*1.17<br />
7 ‘‘Other health workers’’ 89 1.00 55 1.19 [1.00] 0.00 90 0.97 129 1.15 363 1.07 0.96*1.18<br />
8 Teachers 144 0.75 97 0.90 2 0.33 152 0.89 415 0.94 810 0.88 0.82*0.94<br />
9 Religious workers etc 27 1.03 44 1.05 2 2.16 33 0.77 126 0.92 232 0.93 0.82*1.06<br />
10 Artistic workers 11 0.80 12 1.50 1 1.33 14 1.04 34 1.22 72 1.13 0.88*1.42<br />
11 Journalists [2.86] 0.00 3 0.56 [0.18] 0.00 3 0.88 9 0.71 15 0.61 0.34*1.01<br />
12 Administrators 97 1.19 16 0.91 1 1.44 48 1.08 89 1.38 251 1.20 1.06*1.36<br />
13 Clerical workers 893 1.14 374 1.12 20 1.04 640 1.12 1335 1.21 3 262 1.16 1.12*1.20<br />
14 Sales agents 9 1.24 71 1.27 3 1.37 100 1.14 222 1.32 405 1.26 1.15*1.39<br />
15 Shop workers 544 1.01 216 1.08 10 0.78 538 1.06 889 1.20 2 197 1.09 1.05*1.14<br />
16 Farmers 204 0.53 131 0.89 3 0.30 272 0.73 42 0.63 652 0.66 0.62*0.72<br />
17 Gardeners 40 0.81 320 0.78 [0.33] 0.00 153 0.68 158 0.80 671 0.76 0.71*0.82<br />
18 Fishermen [1.94] 0.00 [0.83] 0.00 [0.31] 0.00 2 0.79 1 1.58 3 0.48 0.10*1.40<br />
19 Forestry workers 1 1.97 [1.59] 0.00 [0.04] 0.00 2 0.50 3 0.74 6 0.59 0.22*1.28<br />
20 Miners <strong>and</strong> quarry workers [0.03] 0.00 [0.73] 0.00 [0.01] 0.00 1 5.80 2 2.17 3 1.61 0.33*4.72<br />
21 Seamen [0.14] 0.00 [0.00] 0.00 [0.58] 0.00 [0.09] 0.00 [0.80] 0.00 0.00*4.59<br />
22 Transport workers [0.53] 0.00 16 1.50 [0.34] 0.00 3 1.21 12 1.08 31 1.24 0.84*1.75<br />
23 Drivers 23 1.72 2 0.48 1 7.32 10 1.03 28 1.09 64 1.20 0.93*1.54<br />
24 Postal workers 33 1.15 64 1.03 6 1.34 134 1.17 202 0.99 439 1.06 0.97*1.17<br />
25 Textile workers 190 1.06 156 1.09 10 1.14 233 1.19 460 1.02 1 049 1.07 1.01*1.14<br />
26 Shoe <strong>and</strong> leather workers 13 0.99 17 0.97 1 2.24 16 1.15 46 1.34 93 1.17 0.95*1.44<br />
27 Smelting workers [3.17] 0.00 4 0.96 [0.02] 0.00 1 0.76 9 1.10 14 0.83 0.46*1.40<br />
28 Mechanics 52 1.66 17 0.98 [0.07] 0.00 19 1.19 92 1.09 180 1.21 1.04*1.40<br />
29 Plumbers [0.33] 0.00 [0.03] 0.00 [0.11] 0.00 [0.10] 0.00 [0.56] 0.00 0.00*6.56<br />
30 Welders 1 0.83 [0.00] 0.00 [0.99] 0.00 3 1.06 4 0.80 0.22*2.04<br />
31 Electrical workers 50 1.15 5 0.52 [0.07] 0.00 20 1.18 48 1.03 123 1.05 0.88*1.26<br />
32 Wood workers 12 0.82 32 0.87 [0.13] 0.00 1 0.18 11 0.81 56 0.79 0.60*1.02<br />
33 Painters 2 3.64 8 1.91 [0.04] 0.00 1 0.76 4 1.06 15 1.52 0.85*2.51<br />
34 ‘‘Other construction workers’’ [0.43] 0.00 15 0.95 [0.02] 0.00 [0.51] 0.00 [0.41] 0.00 15 0.87 0.49*1.44<br />
35 Bricklayers 1 11.27 1 1.97 [0.03] 0.00 [0.01] 0.00 2 3.16 0.38*11.41<br />
36 Printers 29 1.76 24 1.39 3 4.18 21 1.35 49 1.35 126 1.46 1.22*1.74<br />
37 Chemical process workers 39 1.49 7 0.76 [0.34] 0.00 19 1.34 38 1.28 103 1.29 1.07*1.57<br />
38 Food workers 133 1.03 47 0.95 13 0.77 99 1.04 86 0.93 378 0.99 0.89*1.09<br />
39 Beverage workers 16 1.33 3 1.05 [0.04] 0.00 [0.80] 0.00 10 1.70 29 1.34 0.90*1.93<br />
40 Tobacco workers 32 1.94 4 2.46 9 2.78 5 1.43 50 2.01 1.49*2.65<br />
41 Glass makers etc 37 1.19 29 0.87 1 2.33 46 1.51 88 1.12 201 1.16 1.01*1.33<br />
42 Packers 7 0.78 71 1.19 3 1.71 90 1.20 143 1.20 314 1.19 1.06*1.33<br />
43 Engine operators [0.24] 0.00 9 0.97 [0.03] 0.00 1 1.17 4 0.63 14 0.84 0.46*1.41<br />
44 Public safety workers 1 1.00 2 0.95 [0.34] 0.00 11 1.14 11 1.37 25 1.18 0.77*1.75<br />
45 Cooks <strong>and</strong> stewards [0.34] 0.00 75 1.12 8 1.21 129 1.18 192 1.06 404 1.11 1.00*1.22<br />
46 Domestic assistants 193 0.95 69 1.04 1 0.49 292 1.04 481 1.10 1 036 1.05 0.99*1.11<br />
47 Waiters 61 1.82 75 1.42 1 1.37 146 1.30 271 1.46 554 1.44 1.32*1.56<br />
48 Building caretakers 682 1.17 248 1.05 8 0.61 487 1.00 521 1.12 1 946 1.09 1.04*1.14<br />
49 Chimney sweeps [0.06] 0.00 [0.11] 0.00 [0.07] 0.00 [0.01] 0.00 [0.25] 0.00 0.00*14.65<br />
50 Hairdressers 43 1.25 25 1.25 [0.61] 0.00 37 1.33 88 1.21 193 1.24 1.08*1.43<br />
51 Launderers 66 1.00 22 1.12 1 0.44 48 1.11 111 1.12 248 1.07 0.95*1.22<br />
52 Military personnel 1 2.89 [0.13] 0.00 [0.11] 0.00 [0.20] 0.00 1 1.26 0.03*7.03<br />
53 ‘‘Other workers’’ 199 1.21 66 0.94 19 1.46 223 0.91 239 1.16 746 1.07 0.99*1.15<br />
54 Economically inactive 4 292 0.96 1 648 0.96 57 1.27 3 190 0.98 9 256 0.93 18 443 0.95 0.94*0.96<br />
1 54 All categories 8 605 1.00 4 282 1.00 183 1.00 7 532 1.00 16 622 1.00 37 224 1.00 Ref.<br />
Obs observed number of cases; SIR st<strong>and</strong>ardised incidence ratio; 95% CI 95% confidence interval.<br />
<strong>Occupation</strong> <strong>and</strong> <strong>cancer</strong> in Nordic countries 727
Acta Oncol Downloaded from informahealthcare.com by 212.35.100.66 on 04/06/11<br />
For personal use only.<br />
728 E. Pukkala et al.<br />
/ 100 000<br />
30<br />
25<br />
20<br />
15<br />
10<br />
5<br />
Denmark<br />
Finl<strong>and</strong><br />
Icel<strong>and</strong><br />
Norway<br />
Sweden<br />
Men<br />
0<br />
1945 1960 1975 1990 2005<br />
cer, such as auramine manufacture, boot <strong>and</strong><br />
shoe manufacture <strong>and</strong> repair, coal gasification,<br />
coke production, magenta manufacture, painter,<br />
rubber industry, hairdressers or barbers, petroleum<br />
refining, dry cleaning, printing processes <strong>and</strong> the<br />
textile manufacturing industry [87]. Studies of<br />
bladder <strong>cancer</strong> among workers in the dyestuffs<br />
industry, <strong>and</strong> later among rubber workers, hold an<br />
important place in the history of occupational<br />
<strong>cancer</strong> [122].<br />
In the present study, occupations with several<br />
chemical exposures were listed among those with the<br />
highest SIRs. Waiters <strong>and</strong> tobacco workers were<br />
among those with the highest SIRs for lung <strong>cancer</strong>,<br />
<strong>and</strong> their excess risk for bladder <strong>cancer</strong> is therefore<br />
probably due to smoking as the major risk factor.<br />
Almost all occupational categories with a low SIR<br />
for bladder <strong>cancer</strong> also have a low SIR for lung<br />
<strong>cancer</strong>, such as gardeners <strong>and</strong> those working in<br />
agriculture <strong>and</strong> pedagogical work.<br />
/ 100 000<br />
30<br />
25<br />
20<br />
15<br />
10<br />
5<br />
Denmark<br />
Finl<strong>and</strong><br />
Icel<strong>and</strong><br />
Norway<br />
Sweden<br />
Women<br />
0<br />
1945 1960 1975 1990 2005<br />
Figure 37. Age st<strong>and</strong>ardised (World) incidence rates for <strong>cancer</strong> of the bladder, ureter <strong>and</strong> urethra 1943 2005, by country <strong>and</strong> gender.<br />
Modified from NORDCAN [49].<br />
/ 100 000<br />
20<br />
15<br />
10<br />
5<br />
Denmark<br />
Finl<strong>and</strong><br />
Icel<strong>and</strong><br />
Norway<br />
Sweden<br />
Men<br />
0<br />
1945 1960 1975 1990 2005<br />
/ 100 000<br />
From the occupations with prior finding of excess<br />
risk, hairdressers <strong>and</strong> printers were also among the<br />
occupations with the highest SIRs for bladder<br />
<strong>cancer</strong> in the present study. A number of studies<br />
have found an excess of bladder <strong>cancer</strong> among<br />
workers exposed to polycyclic aromatic hydrocarbons.<br />
Chimney sweeps are exposed to chimney<br />
soot which is rich on these chemicals, a group<br />
of compounds well documented as carcinogenic<br />
[122,123].<br />
Skin melanoma<br />
Incidence of skin melanoma in the Nordic countries<br />
was steadily increasing until the early 1990s, both in<br />
men <strong>and</strong> women (Figure 38). After that, there was a<br />
levelling-off in Norway <strong>and</strong> Finl<strong>and</strong>, but a rapid<br />
increase in Icel<strong>and</strong>.<br />
The highest SIRs of skin melanoma in men were<br />
observed among dentists (1.65, 95% CI 1.40 1.95),<br />
physicians, administrators, journalists, religious<br />
20<br />
15<br />
10<br />
5<br />
Denmark<br />
Finl<strong>and</strong><br />
Icel<strong>and</strong><br />
Norway<br />
Sweden<br />
Women<br />
0<br />
1945 1960 1975 1990 2005<br />
Figure 38. Age st<strong>and</strong>ardised (World) incidence rates for malignant melanoma of the skin 1943 2005, by country <strong>and</strong> gender. Modified<br />
from NORDCAN [49].
Acta Oncol Downloaded from informahealthcare.com by 212.35.100.66 on 04/06/11<br />
For personal use only.<br />
workers <strong>and</strong> teachers (Table 54). Rates were also<br />
above 1.20 for laboratory assistants, clerical workers,<br />
public safety workers, technical workers, postal<br />
workers, sales agents <strong>and</strong> printers. SIRs below 0.70<br />
were seen among fishermen (0.51, 0.45 0.58),<br />
forestry workers, chimney sweeps, miners <strong>and</strong><br />
quarry workers.<br />
Among women, dentists also had the highest risk,<br />
with an SIR of 1.69 (1.32 2.12). Other female<br />
occupations with a significant elevated risk were<br />
public safety workers, teachers, physicians, <strong>and</strong><br />
‘‘other health workers’’ (Table 55). Engine operators<br />
(0.62, 0.38 0.96), mechanics, <strong>and</strong> wood workers<br />
had the lowest risk of skin melanoma in women.<br />
For skin melanoma in upper limbs (http://astra.<br />
<strong>cancer</strong>.fi/NOCCA/Incidence/melanoma-upper-limbs),<br />
the highest significant SIRs in men were observed<br />
among physicians (1.78, 1.32 2.36), journalists (1.72,<br />
1.10 2.56), religious etc. workers (1.68, 1.45 1.94),<br />
clerical workers (1.52, 1.35 1.71), administrators<br />
(1.52, 1.37 1.69) <strong>and</strong> teachers (1.48, 1.30 1.68). Fishermen<br />
<strong>and</strong> forestry workers had the lowest SIRs of 0.37<br />
(0.21 0.60) <strong>and</strong> 0.41 (0.30 0.56), respectively. Among<br />
the women, only teachers (1.41, 1.28 1.56) <strong>and</strong> clerical<br />
workers (1.21, 1.13 1.29) presented a significantly<br />
elevated risk, while building caretakers SIR 0.75 (95%<br />
CI 0.67 0.84), <strong>and</strong> food workers SIR 0.76 (95% CI<br />
0.58 0.99), had the lowest risk (excluding two<br />
significant SIRs based on only one observed case).<br />
Comment. Sunburns in early ages in susceptible<br />
people are accepted as the major cause of malignant<br />
melanoma [124]. We found high SIRs among<br />
occupations of relatively high socio-economic status.<br />
<strong>Occupation</strong>s with the highest SIRs for malignant<br />
melanoma, dentists, physicians <strong>and</strong> journalists, also<br />
showed significantly high SIRs for ‘‘other skin<br />
<strong>cancer</strong>’’ (Tables 56, 57). In the present study,<br />
fishermen <strong>and</strong> forestry workers ranked as the groups<br />
with the lowest risk of malignant melanoma in men.<br />
This may well be explained by the fact that these<br />
groups have constant sun exposure <strong>and</strong> are not burnt<br />
in the sun, as opposed to leisure time sun exposure<br />
which is often followed by sunburns.<br />
There is little evidence in the scientific literature of<br />
an association between occupational exposures <strong>and</strong><br />
risk of malignant melanoma, except for exposure to<br />
solar radiation [118,125].<br />
Dentists ranked with the highest SIR for malignant<br />
melanoma in both genders <strong>and</strong> have also been<br />
found to have an increased melanoma risk in<br />
previous studies in Sweden [126,127]. Dentists are<br />
exposed through their daily work to lamps that emit<br />
no UV-B, <strong>and</strong> the levels of UV-A are so low that they<br />
are not considered to add to the risk [128].<br />
<strong>Occupation</strong> <strong>and</strong> <strong>cancer</strong> in Nordic countries 729<br />
The highest SIR in Table 54 was among male<br />
transport workers (2.82, 1.41 5.05) in Icel<strong>and</strong>. In<br />
Icel<strong>and</strong> this category includes mainly pilots. Pilots<br />
have had a chance to spend more time in sunny<br />
places (<strong>and</strong> thus having the opportunity to get<br />
sunburns) than other professions <strong>and</strong> they have<br />
2-3-fold elevated risk of skin <strong>cancer</strong>s, similarly in<br />
all Nordic countries [129].<br />
Skin melanoma in upper limbs was studied<br />
separately to reveal the possible effects of h<strong>and</strong><br />
contacts to carcinogenic substances at work. The<br />
variation between occupations in SIRs for melanomas<br />
in the upper limbs is larger than for all<br />
melanomas, especially for men. Printers, journalists<br />
<strong>and</strong> postal workers are on the top of the list of<br />
occupations with the highest incidence of skin<br />
melanoma of the upper limbs, which might suggest<br />
that chemicals in the printing industry would<br />
increase the risk.<br />
Non-melanoma skin <strong>cancer</strong>, excluding basal cell<br />
carcinoma<br />
In Denmark it was not possible to separate basal cell<br />
carcinoma from non-melanoma skin <strong>cancer</strong> before<br />
1987. Therefore, Denmark is excluded from results<br />
related to non-melanoma skin <strong>cancer</strong>. In the other<br />
Nordic countries, the incidence has been on a steady<br />
increase (Figure 39). The rate was higher in males<br />
than in females, especially in Norway <strong>and</strong> Sweden.<br />
The highest SIRs among men were observed in<br />
physicians (1.77, 95% CI 1.60 1.97), assistant<br />
nurses, administrators, dentists <strong>and</strong> military personnel<br />
(Table 56). The lowest SIRs were in forestry<br />
workers (0.67, 0.62 0.71), fishermen <strong>and</strong> smelting<br />
workers. In women the highest SIR was also in<br />
physicians, <strong>and</strong> the SIR was the same as for men<br />
(1.77, 1.31 2.33; Table 57). Otherwise, the occupational<br />
variation in risk among the women was small.<br />
At the lower end, fisherwomen showed an SIR of<br />
0.17 (0.00 0.97), derived only from one case, but all<br />
other statistically significant SIRs were 0.85.<br />
The highest SIRs for non-melanoma skin <strong>cancer</strong><br />
in the upper limbs in men, were observed among<br />
nurses (5.50, 1.79 12.83), physicians (2.52, 1.89<br />
3.31), seamen (1.86, 1.51 2.27), dentists (1.81,<br />
1.05 2.90) <strong>and</strong> military personnel (1.35, 1.01<br />
1.77) (http://astra.<strong>cancer</strong>.fi/NOCCA/Incidence/nonmelanoma-upper-limbs).<br />
The SIRs were lowest in<br />
forestry workers (0.60, 0.47 0.76) <strong>and</strong> food workers<br />
(0.64, 0.46 0.86). In women, the highest SIR was<br />
among dentists (3.23, 1.55 5.95), driven by the high<br />
SIR in Norway (11.03, 4.05 24.00). Female woodworkers<br />
(1.89, 1.03 3.16) <strong>and</strong> teachers (1.29, 1.08<br />
1.53) also had a significantly elevated incidence of<br />
non-melanoma skin <strong>cancer</strong> in the upper limbs. SIRs
Acta Oncol Downloaded from informahealthcare.com by 212.35.100.66 on 04/06/11<br />
For personal use only.<br />
730 E. Pukkala et al.<br />
Table 54. Observed number of skin melanoma among men in the Nordic countries <strong>and</strong> st<strong>and</strong>ardised incidence ratios 1961 2005, by<br />
country <strong>and</strong> occupational category.<br />
Denmark Finl<strong>and</strong> Icel<strong>and</strong> Norway Sweden Total<br />
No <strong>Occupation</strong>al category Obs SIR Obs SIR Obs SIR Obs SIR Obs SIR Obs SIR 95% CI<br />
1 Technical workers, etc 485 1.23 611 1.33 10 2.28 630 1.30 2 436 1.24 4 172 1.26 1.22*1.30<br />
2 Laboratory assistants 13 1.72 11 0.92 3 3.79 33 1.61 18 1.15 78 1.38 1.09*1.72<br />
3 Physicians 39 1.25 43 1.60 [1.36] 0.00 94 1.74 149 1.52 325 1.54 1.38*1.71<br />
4 Dentists 21 2.15 8 1.50 [0.42] 0.00 41 1.75 66 1.52 136 1.65 1.40*1.95<br />
5 Nurses [0.52] 0.00 1 0.46 [0.02] 0.00 6 1.35 10 0.92 17 0.94 0.55*1.51<br />
6 Assistant nurses 9 0.94 2 0.94 [0.29] 0.00 12 1.48 32 0.85 55 0.95 0.72*1.24<br />
7 ‘‘Other health workers’’ 27 1.03 29 1.20 [0.41] 0.00 23 1.11 97 1.27 176 1.19 1.03*1.38<br />
8 Teachers 259 1.46 268 1.47 5 0.91 401 1.20 815 1.48 1 748 1.40 1.34*1.47<br />
9 Religious workers etc 103 1.56 174 1.59 7 1.89 214 1.38 622 1.40 1 120 1.44 1.36*1.53<br />
10 Artistic workers 22 1.07 36 1.01 2 2.10 63 1.45 127 1.04 250 1.13 0.99*1.27<br />
11 Journalists 17 1.68 15 0.88 1 1.69 31 1.52 89 1.56 153 1.45 1.24*1.70<br />
12 Administrators 588 1.43 362 1.37 12 1.64 761 1.52 944 1.47 2 667 1.46 1.41*1.52<br />
13 Clerical workers 240 1.30 201 1.23 10 1.11 525 1.37 1 038 1.41 2 014 1.37 1.31*1.43<br />
14 Sales agents 102 1.04 272 1.10 4 0.92 537 1.31 1 393 1.27 2 308 1.24 1.20*1.30<br />
15 Shop workers 466 1.17 122 1.06 2 0.56 198 1.05 397 1.11 1 185 1.11 1.05*1.18<br />
16 Farmers 523 0.70 902 1.00 7 0.58 645 0.76 1 010 0.77 3 087 0.81 0.78*0.84<br />
17 Gardeners 85 0.82 154 0.99 [0.40] 0.00 187 0.79 409 0.74 835 0.79 0.74*0.85<br />
18 Fishermen 26 0.69 9 0.72 11 0.98 124 0.41 46 0.80 216 0.51 0.45*0.58<br />
19 Forestry workers 10 0.68 104 0.56 [0.08] 0.00 98 0.62 208 0.51 420 0.55 0.50*0.60<br />
20 Miners <strong>and</strong> quarry workers 1 0.22 25 0.82 [0.17] 0.00 44 0.78 62 0.57 132 0.66 0.55*0.78<br />
21 Seamen 44 1.01 42 1.00 5 2.02 332 1.03 122 1.18 545 1.06 0.97*1.15<br />
22 Transport workers 116 1.32 109 0.95 11 2.82 184 1.22 388 1.10 808 1.14 1.06*1.22<br />
23 Drivers 216 0.74 337 0.82 4 0.59 357 0.77 760 0.81 1 674 0.79 0.76*0.83<br />
24 Postal workers 74 1.19 61 1.01 [0.73] 0.00 96 1.18 272 1.37 503 1.25 1.14*1.36<br />
25 Textile workers 31 0.66 31 0.87 1 0.79 82 1.08 211 1.19 356 1.05 0.95*1.17<br />
26 Shoe <strong>and</strong> leather workers 7 0.63 15 0.99 [0.25] 0.00 31 1.08 62 1.01 115 0.99 0.82*1.19<br />
27 Smelting workers 90 0.77 44 0.77 2 1.03 100 0.87 220 0.73 456 0.77 0.70*0.84<br />
28 Mechanics 292 0.94 356 0.86 4 0.52 556 0.85 1 392 0.82 2 600 0.84 0.81*0.88<br />
29 Plumbers 16 0.56 58 0.82 1 0.88 73 0.91 159 0.83 307 0.82 0.74*0.92<br />
30 Welders 60 0.80 [0.48] 0.00 73 0.74 168 0.69 301 0.72 0.64*0.80<br />
31 Electrical workers 75 0.96 191 1.03 10 2.03 296 1.00 634 1.01 1 206 1.01 0.96*1.07<br />
32 Wood workers 176 0.84 313 0.84 8 2.13 600 0.95 782 0.84 1 879 0.87 0.83*0.91<br />
33 Painters 72 1.03 60 0.71 1 0.67 97 0.92 245 0.86 475 0.87 0.79*0.95<br />
34 ‘‘Other construction workers’’ 198 0.83 191 0.79 5 0.58 108 0.76 386 0.76 888 0.78 0.73*0.83<br />
35 Bricklayers 91 1.20 36 0.93 47 0.76 114 0.95 288 0.97 0.87*1.09<br />
36 Printers 67 1.30 57 1.27 [1.38] 0.00 88 1.15 219 1.23 431 1.22 1.11*1.34<br />
37 Chemical process workers 27 0.65 68 1.00 [0.61] 0.00 132 0.99 181 0.81 408 0.88 0.79*0.96<br />
38 Food workers 108 0.76 59 1.22 3 0.54 162 1.01 249 1.04 581 0.97 0.90*1.06<br />
39 Beverage workers 18 1.11 2 0.68 [0.09] 0.00 4 1.10 10 0.82 34 0.97 0.67*1.36<br />
40 Tobacco workers 5 2.06 1 1.76 [0.00] 0.00 3 1.42 [1.22] 0.00 9 1.42 0.65*2.69<br />
41 Glass makers etc 62 0.77 66 0.92 3 2.91 88 0.98 235 0.88 454 0.89 0.81*0.97<br />
42 Packers 43 0.63 140 1.02 3 0.95 218 0.93 381 0.86 785 0.88 0.82*0.95<br />
43 Engine operators 68 0.87 196 0.94 [5.11] 0.00 171 0.95 363 0.81 798 0.87 0.81*0.93<br />
44 Public safety workers 110 1.53 122 1.08 2 0.65 150 1.38 368 1.32 752 1.31 1.22*1.41<br />
45 Cooks <strong>and</strong> stewards 5 0.85 14 1.59 [1.80] 0.00 62 1.05 53 0.93 134 1.01 0.86*1.20<br />
46 Domestic assistants [0.07] 0.00 [0.38] 0.00 [0.01] 0.00 [0.66] 0.00 3 0.38 3 0.33 0.07*0.97<br />
47 Waiters 12 1.09 4 0.45 [0.23] 0.00 26 1.13 20 0.69 62 0.86 0.66*1.11<br />
48 Building caretakers 60 0.85 73 0.83 1 0.99 62 1.07 155 0.83 351 0.87 0.78*0.96<br />
49 Chimney sweeps 1 0.49 3 0.46 3 0.53 11 0.72 18 0.61 0.36*0.96<br />
50 Hairdressers 20 0.98 2 1.05 [0.24] 0.00 12 0.78 63 1.41 97 1.17 0.95*1.43<br />
51 Launderers 3 0.30 1 0.50 [0.09] 0.00 8 0.90 28 0.86 40 0.75 0.53*1.02<br />
52 Military personnel 42 0.96 48 1.09 124 1.12 209 1.27 423 1.17 1.06*1.28<br />
53 ‘‘Other workers’’ 199 0.90 105 1.00 10 0.84 327 0.80 485 0.91 1 126 0.88 0.83*0.93<br />
54 Economically inactive 132 0.85 371 0.81 9 0.95 132 0.58 613 0.66 1 257 0.70 0.67*0.74<br />
1 54 All categories 5 516 1.00 6 585 1.00 157 1.00 9 471 1.00 19 529 1.00 41 258 1.00 Ref.<br />
Obs observed number of cases; SIR st<strong>and</strong>ardised incidence ratio; 95% CI 95% confidence interval.
Acta Oncol Downloaded from informahealthcare.com by 212.35.100.66 on 04/06/11<br />
For personal use only.<br />
Table 55. Observed number of skin melanoma among women in the Nordic countries <strong>and</strong> st<strong>and</strong>ardised incidence ratios 1961 2005, by<br />
country <strong>and</strong> occupational category.<br />
Denmark Finl<strong>and</strong> Icel<strong>and</strong> Norway Sweden Total<br />
No <strong>Occupation</strong>al category Obs SIR Obs SIR Obs SIR Obs SIR Obs SIR Obs SIR 95% CI<br />
1 Technical workers, etc 22 0.99 52 1.08 1 1.05 40 1.81 136 1.11 251 1.16 1.03*1.32<br />
2 Laboratory assistants 31 1.78 21 0.84 1 0.81 27 1.13 59 1.10 139 1.15 0.97*1.36<br />
3 Physicians 13 1.74 22 1.79 [0.16] 0.00 13 1.35 33 1.00 81 1.30 1.03*1.61<br />
4 Dentists 8 1.23 20 1.97 [0.07] 0.00 14 1.94 32 1.60 74 1.69 1.32*2.12<br />
5 Nurses 143 1.10 160 1.25 6 1.22 196 1.03 410 1.20 915 1.15 1.08*1.23<br />
6 Assistant nurses 91 0.95 117 0.99 5 0.71 161 0.86 590 0.90 964 0.91 0.85*0.96<br />
7 ‘‘Other health workers’’ 92 1.24 121 1.23 [1.60] 0.00 207 1.19 270 1.17 690 1.19 1.11*1.28<br />
8 Teachers 253 1.47 283 1.31 19 2.04 497 1.43 1025 1.29 2 077 1.35 1.29*1.41<br />
9 Religious workers etc 29 1.29 147 1.13 1 0.75 104 1.21 376 1.19 657 1.18 1.09*1.27<br />
10 Artistic workers 8 0.74 17 0.89 1 0.97 29 1.22 40 0.75 95 0.88 0.71*1.08<br />
11 Journalists 2 0.81 12 1.02 [0.29] 0.00 15 2.10 27 1.05 56 1.18 0.89*1.53<br />
12 Administrators 76 1.19 54 1.33 2 3.18 89 1.16 126 1.06 347 1.15 1.04*1.28<br />
13 Clerical workers 790 1.17 851 1.17 29 1.05 1 327 1.30 2156 1.16 5 153 1.20 1.16*1.23<br />
14 Sales agents 7 1.19 96 1.01 3 1.29 116 1.08 241 1.09 463 1.07 0.98*1.17<br />
15 Shop workers 451 1.04 321 0.93 16 1.04 757 1.02 900 1.03 2 445 1.01 0.97*1.05<br />
16 Farmers 269 0.86 170 0.98 4 0.43 372 0.88 85 0.96 900 0.89 0.84*0.95<br />
17 Gardeners 33 0.83 526 1.01 [0.34] 0.00 195 0.76 211 1.00 965 0.94 0.88*1.00<br />
18 Fishermen [1.62] 0.00 2 1.52 [0.45] 0.00 2 0.48 [0.80] 0.00 4 0.48 0.13*1.23<br />
19 Forestry workers [0.42] 0.00 [2.60] 0.00 [0.06] 0.00 4 0.74 3 0.54 7 0.50 0.20*1.02<br />
20 Miners <strong>and</strong> quarry workers [0.02] 0.00 [0.94] 0.00 [0.01] 0.00 [0.38] 0.00 [1.53] 0.00 [2.88] 0.00 0.00*1.28<br />
21 Seamen [0.43] 0.00 [0.00] 0.00 1 0.99 [0.31] 0.00 1 0.57 0.01*3.18<br />
22 Transport workers [0.43] 0.00 16 1.07 1 2.94 7 1.37 24 1.31 48 1.22 0.90*1.62<br />
23 Drivers 10 0.90 10 1.13 [0.22] 0.00 13 0.76 38 0.77 71 0.82 0.64*1.03<br />
24 Postal workers 22 0.98 108 1.08 7 1.54 210 1.15 326 1.18 673 1.15 1.06*1.24<br />
25 Textile workers 130 0.90 197 0.90 4 0.57 215 0.94 417 0.98 963 0.94 0.88*1.00<br />
26 Shoe <strong>and</strong> leather workers 10 0.92 22 0.81 1 2.50 12 0.71 27 0.81 72 0.81 0.64*1.02<br />
27 Smelting workers 3 1.14 8 1.28 [0.02] 0.00 2 0.67 12 0.86 25 0.97 0.63*1.43<br />
28 Mechanics 18 0.67 19 0.62 [0.09] 0.00 27 1.10 86 0.65 150 0.70 0.60*0.82<br />
29 Plumbers [0.22] 0.00 [0.08] 0.00 [0.22] 0.00 [0.33] 0.00 [0.85] 0.00 0.00*4.35<br />
30 Welders [2.72] 0.00 [0.01] 0.00 2 0.77 6 0.88 8 0.66 0.29*1.30<br />
31 Electrical workers 34 0.90 15 0.64 [0.07] 0.00 28 1.00 55 0.72 132 0.80 0.67*0.95<br />
32 Wood workers 9 0.73 43 0.81 [0.16] 0.00 4 0.40 21 0.87 77 0.77 0.61*0.96<br />
33 Painters [0.45] 0.00 8 1.20 [0.05] 0.00 4 1.89 2 0.34 14 0.92 0.50*1.54<br />
34 ‘‘Other construction workers’’ [0.34] 0.00 18 0.92 [0.03] 0.00 1 1.14 [1.12] 0.00 19 0.87 0.52*1.36<br />
35 Bricklayers [0.07] 0.00 2 2.64 [0.05] 0.00 [0.04] 0.00 2 2.16 0.26*7.80<br />
36 Printers 8 0.58 30 1.01 [0.76] 0.00 21 0.91 51 1.00 110 0.93 0.77*1.12<br />
37 Chemical process workers 27 1.28 11 0.78 [0.27] 0.00 22 1.10 29 0.78 89 0.96 0.77*1.18<br />
38 Food workers 97 0.91 68 0.94 16 0.88 70 0.60 79 0.83 330 0.81 0.72*0.90<br />
39 Beverage workers 7 0.74 4 1.04 [0.04] 0.00 1 0.79 2 0.36 14 0.69 0.38*1.17<br />
40 Tobacco workers 11 0.83 2 0.90 [3.76] 0.00 2 0.46 15 0.64 0.36*1.05<br />
41 Glass makers etc 20 0.76 44 0.83 2 4.00 47 1.06 80 0.79 193 0.86 0.74*0.99<br />
42 Packers 10 1.35 78 0.84 2 1.33 90 0.88 130 0.90 310 0.89 0.80*1.00<br />
43 Engine operators 1 3.91 10 0.64 [0.03] 0.00 [2.12] 0.00 9 0.63 20 0.62 0.38*0.96<br />
44 Public safety workers 1 1.48 3 0.75 [0.32] 0.00 21 1.71 29 1.34 54 1.39 1.04*1.81<br />
45 Cooks <strong>and</strong> stewards 1 3.70 96 0.90 8 1.45 113 0.93 157 0.87 375 0.91 0.82*1.00<br />
46 Domestic assistants 147 0.90 122 0.98 1 0.71 289 0.86 618 0.92 1 177 0.91 0.86*0.96<br />
47 Waiters 20 0.72 83 0.87 [0.78] 0.00 116 0.74 172 0.88 391 0.82 0.75*0.91<br />
48 Building caretakers 416 0.90 311 0.90 8 0.70 475 0.70 443 0.76 1 653 0.80 0.76*0.83<br />
49 Chimney sweeps [0.04] 0.00 [0.17] 0.00 [0.09] 0.00 [0.03] 0.00 [0.34] 0.00 0.00*10.96<br />
50 Hairdressers 36 1.20 36 0.97 1 0.89 44 1.00 117 1.08 234 1.06 0.93*1.21<br />
51 Launderers 42 0.81 21 0.82 2 1.31 48 0.96 71 0.79 184 0.84 0.73*0.97<br />
52 Military personnel 1 3.75 [0.50] 0.00 [0.29] 0.00 1 1.16 2 1.04 0.13*3.75<br />
53 ‘‘Other workers’’ 116 0.87 101 0.88 10 0.74 375 1.03 242 0.89 844 0.94 0.88*1.01<br />
54 Economically inactive 3 243 0.98 1 986 0.95 48 1.06 3 493 0.97 9 337 0.97 18 107 0.97 0.95*0.98<br />
1 54 All categories 6 758 1.00 6 464 1.00 199 1.00 9 916 1.00 19 303 1.00 42 640 1.00 Ref.<br />
Obs observed number of cases; SIR st<strong>and</strong>ardised incidence ratio; 95% CI 95% confidence interval.<br />
<strong>Occupation</strong> <strong>and</strong> <strong>cancer</strong> in Nordic countries 731
Acta Oncol Downloaded from informahealthcare.com by 212.35.100.66 on 04/06/11<br />
For personal use only.<br />
732 E. Pukkala et al.<br />
Table 56. Observed number of non melanoma skin <strong>cancer</strong> among men in the Nordic countries <strong>and</strong> st<strong>and</strong>ardised incidence ratios 1961<br />
2005, by country <strong>and</strong> occupational category.<br />
Denmark Finl<strong>and</strong> Icel<strong>and</strong> Norway Sweden Total<br />
No <strong>Occupation</strong>al category Obs SIR Obs SIR Obs SIR Obs SIR Obs SIR Obs SIR 95% CI<br />
1 Technical workers, etc 448 1.18 5 1.08 526 1.16 2946 1.10 3925 1.12 1.09*1.16<br />
2 Laboratory assistants 7 0.81 1 1.19 27 1.23 10 1.12 45 1.11 0.81*1.49<br />
3 Physicians 32 1.47 [1.96] 0.00 126 1.98 206 1.75 364 1.77 1.60*1.97<br />
4 Dentists 2 0.41 [0.44] 0.00 30 1.08 88 1.47 120 1.29 1.08*1.54<br />
5 Nurses 1 1.07 [0.01] 0.00 2 1.03 10 2.42 13 1.85 0.99*3.17<br />
6 Assistant nurses 2 3.12 [0.21] 0.00 11 1.01 57 1.50 70 1.41 1.10*1.78<br />
7 ‘‘Other health workers’’ 24 1.08 1 1.80 23 0.99 118 1.15 166 1.12 0.96*1.30<br />
8 Teachers 163 1.00 5 0.72 405 1.21 817 1.24 1390 1.19 1.13*1.26<br />
9 Religious workers etc 97 1.15 3 0.63 221 1.25 663 1.32 984 1.28 1.21*1.37<br />
10 Artistic workers 30 0.97 [1.29] 0.00 71 1.38 154 0.97 255 1.05 0.93*1.19<br />
11 Journalists 12 0.79 3 4.20 21 0.96 77 1.07 113 1.03 0.85*1.24<br />
12 Administrators 345 1.30 17 1.32 874 1.38 1410 1.29 2646 1.32 1.27*1.37<br />
13 Clerical workers 195 1.11 12 0.81 520 1.13 1372 1.23 2099 1.19 1.14*1.24<br />
14 Sales agents 247 1.04 5 0.68 631 1.17 1860 1.16 2743 1.15 1.11*1.19<br />
15 Shop workers 86 0.91 3 0.59 204 1.02 525 1.03 818 1.01 0.94*1.08<br />
16 Farmers 1 432 1.03 19 0.84 1 521 0.93 2830 0.93 5802 0.95 0.93*0.98<br />
17 Gardeners 148 0.85 2 2.86 368 0.95 952 0.90 1470 0.90 0.86*0.95<br />
18 Fishermen 16 0.90 7 0.66 280 0.58 166 1.45 469 0.75 0.69*0.82<br />
19 Forestry workers 132 0.68 [0.10] 0.00 252 0.87 446 0.59 830 0.67 0.62*0.71<br />
20 Miners <strong>and</strong> quarry workers 37 1.22 [0.18] 0.00 78 1.04 147 0.82 262 0.92 0.82*1.04<br />
21 Seamen 46 1.09 4 1.25 416 1.12 238 1.51 704 1.23 1.14*1.32<br />
22 Transport workers 182 1.37 5 0.73 214 1.05 609 1.05 1 010 1.09 1.03*1.16<br />
23 Drivers 348 0.92 7 0.77 485 0.91 1 195 0.93 2035 0.93 0.89*0.97<br />
24 Postal workers 63 1.03 1 0.75 87 0.84 328 1.12 479 1.05 0.96*1.14<br />
25 Textile workers 37 0.85 5 2.12 99 0.80 345 1.01 486 0.95 0.87*1.04<br />
26 Shoe <strong>and</strong> leather workers 16 0.83 [0.52] 0.00 43 0.85 140 1.03 199 0.97 0.84*1.11<br />
27 Smelting workers 58 0.91 3 0.99 133 0.86 381 0.73 575 0.78 0.71*0.84<br />
28 Mechanics 366 0.97 14 1.59 660 0.89 2120 0.89 3160 0.90 0.87*0.94<br />
29 Plumbers 54 0.90 3 2.03 76 0.92 269 1.00 402 0.97 0.88*1.07<br />
30 Welders 51 0.98 [0.49] 0.00 97 1.04 255 0.85 403 0.90 0.82*1.00<br />
31 Electrical workers 153 1.01 4 0.79 335 1.02 799 1.00 1 291 1.01 0.96*1.07<br />
32 Wood workers 417 0.92 4 0.72 849 0.91 1415 0.84 2685 0.87 0.84*0.91<br />
33 Painters 72 0.81 [2.18] 0.00 124 0.84 414 0.87 610 0.85 0.79*0.92<br />
34 ‘‘Other construction workers’’ 223 0.81 12 1.16 158 0.94 788 0.90 1181 0.89 0.84*0.94<br />
35 Bricklayers 36 0.78 75 0.84 188 0.87 299 0.85 0.76*0.95<br />
36 Printers 43 1.19 2 1.18 103 1.21 268 1.10 416 1.14 1.03*1.25<br />
37 Chemical process workers 79 1.23 [0.97] 0.00 179 0.91 331 0.85 589 0.90 0.83*0.98<br />
38 Food workers 35 0.74 10 1.12 189 0.84 401 0.99 635 0.93 0.86*1.00<br />
39 Beverage workers 5 1.44 [0.16] 0.00 2 1.04 16 0.75 23 0.85 0.54*1.28<br />
40 Tobacco workers 3 5.11 [0.01] 0.00 4 1.24 1 0.58 8 1.44 0.62*2.84<br />
41 Glass makers etc 58 0.87 3 2.02 113 1.07 413 0.96 587 0.97 0.90*1.06<br />
42 Packers 135 0.92 5 0.97 270 0.82 748 0.97 1 158 0.93 0.87*0.98<br />
43 Engine operators 200 1.10 11 1.77 169 0.94 589 0.95 969 0.98 0.92*1.04<br />
44 Public safety workers 124 1.12 7 1.51 178 1.21 479 1.30 788 1.25 1.16*1.34<br />
45 Cooks <strong>and</strong> stewards 3 0.48 1 0.50 37 0.61 54 0.88 95 0.73 0.59*0.89<br />
46 Domestic assistants [0.75] 0.00 [0.00] 0.00 [0.52] 0.00 4 0.92 4 0.71 0.19*1.82<br />
47 Waiters 3 0.54 [0.21] 0.00 23 0.87 40 1.29 66 1.04 0.81*1.33<br />
48 Building caretakers 92 0.92 1 0.43 92 1.27 274 0.92 459 0.97 0.89*1.06<br />
49 Chimney sweeps 10 1.50 7 0.97 18 0.89 35 1.02 0.71*1.43<br />
50 Hairdressers [1.78] 0.00 [0.29] 0.00 24 1.13 84 1.03 108 1.03 0.85*1.25<br />
51 Launderers 7 3.53 [0.22] 0.00 16 1.24 55 0.96 78 1.08 0.85*1.35<br />
52 Military personnel 41 1.32 150 1.24 309 1.32 500 1.29 1.19*1.41<br />
53 ‘‘Other workers’’ 95 0.84 27 1.41 690 1.07 851 0.90 1 663 0.96 0.92*1.01<br />
54 Economically inactive 611 0.96 11 0.86 259 0.85 1125 0.89 2006 0.91 0.87*0.95<br />
1 54 All categories 7 122 1.00 223 1.00 12 547 1.00 30 398 1.00 50 290 1.00 Ref.<br />
Obs observed number of cases; SIR st<strong>and</strong>ardised incidence ratio; 95% CI 95% confidence interval.
Acta Oncol Downloaded from informahealthcare.com by 212.35.100.66 on 04/06/11<br />
For personal use only.<br />
Table 57. Observed number of non melanoma skin <strong>cancer</strong> among women in the Nordic countries <strong>and</strong> st<strong>and</strong>ardised incidence ratios 1961<br />
2005, by country <strong>and</strong> occupational category.<br />
Denmark Finl<strong>and</strong> Icel<strong>and</strong> Norway Sweden Total<br />
No <strong>Occupation</strong>al category Obs SIR Obs SIR Obs SIR Obs SIR Obs SIR Obs SIR 95% CI<br />
1 Technical workers, etc 24 0.86 [0.49] 0.00 13 1.26 77 1.00 114 0.99 0.82*1.18<br />
2 Laboratory assistants 13 0.81 1 1.34 15 1.07 16 1.07 45 0.98 0.72*1.32<br />
3 Physicians 7 1.10 [0.14] 0.00 13 2.22 30 1.89 50 1.77 1.31*2.33<br />
4 Dentists 4 0.38 [0.05] 0.00 11 2.12 26 1.76 41 1.35 0.97*1.83<br />
5 Nurses 83 1.02 8 2.16 123 1.10 279 1.14 493 1.12 1.02*1.22<br />
6 Assistant nurses 90 0.97 7 1.31 101 0.90 373 0.94 571 0.94 0.87*1.02<br />
7 ‘‘Other health workers’’ 74 1.04 2 1.86 125 1.11 153 1.16 354 1.12 1.01*1.24<br />
8 Teachers 166 0.97 8 1.23 268 1.28 625 1.18 1 067 1.16 1.10*1.24<br />
9 Religious workers etc 60 0.95 [0.99] 0.00 74 1.38 171 1.05 305 1.08 0.97*1.21<br />
10 Artistic workers 7 0.54 1 1.20 22 1.30 32 0.96 62 0.97 0.74*1.24<br />
11 Journalists 4 0.46 [0.21] 0.00 2 0.48 32 2.11 38 1.35 0.95*1.85<br />
12 Administrators 28 0.97 [0.69] 0.00 64 1.14 110 1.40 202 1.23 1.07*1.41<br />
13 Clerical workers 488 0.93 29 1.42 787 1.14 1519 1.16 2 823 1.11 1.07*1.15<br />
14 Sales agents 90 0.95 3 1.32 111 1.02 214 1.02 418 1.00 0.91*1.11<br />
15 Shop workers 279 0.88 13 0.96 733 1.17 914 0.98 1 939 1.03 0.98*1.07<br />
16 Farmers 269 0.96 11 1.06 383 0.80 69 0.85 732 0.86 0.80*0.92<br />
17 Gardeners 799 1.14 [0.35] 0.00 229 0.80 256 1.06 1 284 1.04 0.99*1.10<br />
18 Fishermen [1.46] 0.00 [0.33] 0.00 [3.12] 0.00 1 1.21 1 0.17 0.00*0.97<br />
19 Forestry workers [2.81] 0.00 [0.05] 0.00 6 1.19 5 1.00 11 0.85 0.43*1.53<br />
20 Miners <strong>and</strong> quarry workers 1 0.83 [0.02] 0.00 [0.19] 0.00 3 2.74 4 1.59 0.43*4.08<br />
21 Seamen [0.19] 0.00 [0.00] 0.00 1 1.37 [0.10] 0.00 1 0.98 0.02*5.49<br />
22 Transport workers 8 0.45 1 2.46 1 0.34 15 1.11 25 0.72 0.47*1.07<br />
23 Drivers 9 1.36 [0.15] 0.00 11 0.93 33 1.14 53 1.11 0.83*1.45<br />
24 Postal workers 108 1.08 5 1.07 125 0.91 268 1.09 506 1.04 0.95*1.13<br />
25 Textile workers 239 1.00 7 0.78 209 0.87 567 0.98 1 022 0.96 0.90*1.02<br />
26 Shoe <strong>and</strong> leather workers 29 1.02 1 2.09 15 0.88 38 0.88 83 0.93 0.74*1.15<br />
27 Smelting workers 7 1.04 [0.02] 0.00 [1.55] 0.00 8 0.85 15 0.85 0.47*1.39<br />
28 Mechanics 23 0.83 [0.08] 0.00 20 1.05 81 0.82 124 0.85 0.72*1.02<br />
29 Plumbers [0.05] 0.00 [0.11] 0.00 [0.11] 0.00 [0.27] 0.00 0.00*13.64<br />
30 Welders [1.83] 0.00 [0.01] 0.00 2 1.73 2 0.65 4 0.66 0.18*1.69<br />
31 Electrical workers 15 1.04 [0.07] 0.00 11 0.55 55 1.00 81 0.90 0.72*1.12<br />
32 Wood workers 81 1.34 [0.14] 0.00 5 0.74 14 0.88 100 1.20 0.99*1.47<br />
33 Painters 8 1.23 [0.04] 0.00 3 1.92 3 0.66 14 1.11 0.61*1.86<br />
34 ‘‘Other construction workers’’ 24 0.88 [0.02] 0.00 [0.66] 0.00 [0.49] 0.00 24 0.85 0.54*1.26<br />
35 Bricklayers [0.93] 0.00 [0.03] 0.00 [0.01] 0.00 [0.97] 0.00 0.00*3.80<br />
36 Printers 22 0.79 [0.70] 0.00 14 0.76 39 0.90 75 0.83 0.65*1.04<br />
37 Chemical process workers 15 1.00 1 3.14 14 0.83 45 1.23 75 1.09 0.86*1.37<br />
38 Food workers 84 1.02 9 0.52 91 0.78 103 0.89 287 0.86 0.77*0.97<br />
39 Beverage workers 2 0.42 [0.04] 0.00 2 2.06 4 0.55 8 0.61 0.26*1.21<br />
40 Tobacco workers 4 1.41 1 0.28 6 1.42 11 1.03 0.52*1.85<br />
41 Glass makers etc 49 0.89 1 2.10 36 0.99 93 0.98 179 0.96 0.83*1.11<br />
42 Packers 95 0.98 4 2.25 79 0.88 151 1.02 329 0.98 0.88*1.09<br />
43 Engine operators 13 0.88 [0.03] 0.00 [1.02] 0.00 3 0.43 16 0.71 0.40*1.15<br />
44 Public safety workers 3 0.81 [0.34] 0.00 11 0.85 11 1.17 25 0.95 0.61*1.40<br />
45 Cooks <strong>and</strong> stewards 110 0.96 3 0.45 143 1.03 204 0.88 460 0.94 0.86*1.03<br />
46 Domestic assistants 115 1.00 [1.98] 0.00 310 0.90 460 0.88 885 0.90 0.84*0.96<br />
47 Waiters 65 0.76 [0.69] 0.00 113 0.82 223 0.94 401 0.87 0.79*0.96<br />
48 Building caretakers 363 0.90 9 0.67 504 0.85 488 0.86 1 364 0.87 0.82*0.92<br />
49 Chimney sweeps [0.14] 0.00 [0.10] 0.00 [0.01] 0.00 [0.25] 0.00 0.00*14.93<br />
50 Hairdressers 28 0.85 [0.66] 0.00 45 1.32 95 1.06 168 1.07 0.92*1.24<br />
51 Launderers 32 0.95 3 1.36 53 1.00 111 0.87 199 0.92 0.80*1.05<br />
52 Military personnel [0.16] 0.00 [0.13] 0.00 [0.22] 0.00 [0.51] 0.00 0.00*7.25<br />
53 ‘‘Other workers’’ 106 0.90 8 0.60 291 0.95 221 0.88 626 0.91 0.84*0.99<br />
54 Economically inactive 3 216 1.04 54 1.17 4 076 1.02 12 269 0.99 19 615 1.00 0.99*1.02<br />
1 54 All categories 7 359 1.00 189 1.00 9 266 1.00 20 515 1.00 37 329 1.00 Ref.<br />
Obs observed number of cases; SIR st<strong>and</strong>ardised incidence ratio; 95% CI 95% confidence interval.<br />
<strong>Occupation</strong> <strong>and</strong> <strong>cancer</strong> in Nordic countries 733
Acta Oncol Downloaded from informahealthcare.com by 212.35.100.66 on 04/06/11<br />
For personal use only.<br />
734 E. Pukkala et al.<br />
/ 100 000<br />
15<br />
10<br />
5<br />
Denmark<br />
Finl<strong>and</strong><br />
Icel<strong>and</strong><br />
Norway<br />
Sweden<br />
Men<br />
0<br />
1945 1960 1975 1990 2005<br />
were significantly below 1.0 among female sales<br />
agents (0.69, 0.46 0.98) <strong>and</strong> among ‘‘other workers’’,<br />
i.e., economically active women not classified in<br />
any of the 52 specific occupational categories if the<br />
present study (0.60, 0.43 0.81).<br />
Comment. Non-melanoma skin <strong>cancer</strong> <strong>and</strong> skin<br />
melanoma (Tables 54, 55) have quite similar SIRs.<br />
Several chemical compounds have been identified as<br />
associated with an increased risk of skin <strong>cancer</strong>.<br />
These include arsenic <strong>and</strong> arsenic compounds, <strong>and</strong><br />
components of oil, tar, <strong>and</strong> combustion products<br />
such as PAHs. Cumulative solar exposure is also<br />
considered a skin carcinogen, which in the context of<br />
outdoor occupations is related to work [130]. In our<br />
study, however, we did not identify patterns of SIRs<br />
that could be related to either occupational solar<br />
exposure or chemical exposures. The highest SIR<br />
was obsersved among physicians, identically in both<br />
genders, which might indicate that there is some<br />
/ 100 000<br />
15<br />
10<br />
5<br />
Denmark<br />
Finl<strong>and</strong><br />
Icel<strong>and</strong><br />
Norway<br />
Sweden<br />
Women<br />
0<br />
1945 1960 1975 1990 2005<br />
Figure 39. Age st<strong>and</strong>ardised (World) incidence rates for non-melanoma skin <strong>cancer</strong> 1943 2005, by country <strong>and</strong> gender. Modified from<br />
NORDCAN [49].<br />
/ 100 000<br />
2<br />
1.5<br />
1<br />
.5<br />
0<br />
Men<br />
Denmark<br />
Finl<strong>and</strong><br />
Icel<strong>and</strong><br />
Norway<br />
Sweden<br />
1945 1960 1975 1990 2005<br />
/ 100 000<br />
diagnostic bias which overrules the possible weaker<br />
effects of occupational carcinogens.<br />
Skin <strong>cancer</strong> in the upper limbs was studied<br />
separately to reveal the possible effects of dermal<br />
exposure at work. One might speculate that the<br />
excess risk in health care personnel, seamen or<br />
military personnel might be related, e.g., to products<br />
they h<strong>and</strong>le in their work, including disinfection<br />
liquids.<br />
Eye <strong>cancer</strong><br />
The incidence of <strong>cancer</strong> of the eye has remained fairly<br />
stable around 1 per 100 000 in men, <strong>and</strong> a bit lower in<br />
women in all Nordic countries (Figure 40).<br />
Only a modest risk variation across occupational<br />
categories was found (Table 58). For men, the only<br />
significantly elevated SIR (1.35, 95% CI 1.09 1.66)<br />
was found for transport workers, <strong>and</strong> the only<br />
significantly low SIR (0.81, 0.70 0.95) was found<br />
for economically inactive men. No occupational<br />
2<br />
1.5<br />
1<br />
.5<br />
0<br />
Women<br />
Denmark<br />
Finl<strong>and</strong><br />
Icel<strong>and</strong><br />
Norway<br />
Sweden<br />
1945 1960 1975 1990 2005<br />
Figure 40. Age st<strong>and</strong>ardised (World) incidence rates for eye <strong>cancer</strong> 1943 2005, by country <strong>and</strong> gender. Modified from NORDCAN [49].
Acta Oncol Downloaded from informahealthcare.com by 212.35.100.66 on 04/06/11<br />
For personal use only.<br />
category came up with an increased or a decreased<br />
risk in women (Table 59).<br />
Eye melanoma constitutes by far the majority of<br />
the eye <strong>cancer</strong> cases in the study series, <strong>and</strong> therefore<br />
the SIRs for eye melanoma resembled those given<br />
for eye <strong>cancer</strong> (http://astra.<strong>cancer</strong>.fi/NOCCA/Inci<br />
dence/eye-melanoma). Transport work was still the<br />
only elevated occupation with an elevated SIR (1.35,<br />
1.06 1.68). On the other end of the scale, forestry<br />
workers <strong>and</strong> gardeners showed lower SIRs (0.75,<br />
0.56 0.99; <strong>and</strong> 0.79, 0.62 0.99, respectively) than<br />
for all eye <strong>cancer</strong>s combined, because their SIR for<br />
the non-melanoma type of eye <strong>cancer</strong> was above 1.0.<br />
Comment. Solar UV radiation might be the main<br />
cause of ocular melanoma, although this association<br />
is still disputed [124]. UV radiation from manmade<br />
sources, such as sunlamps, sun beds, tanning<br />
booths, <strong>and</strong> electrical arc welding have also been<br />
reported as possibly associated with risk. Radiofrequency<br />
electromagnetic fields were associated<br />
with risk in a few studies, but the association cannot<br />
be considered as established. <strong>Occupation</strong>s such as<br />
dentists, physicians, military personnel, transport<br />
workers, engine operators, mechanics, <strong>and</strong> welders<br />
have the highest SIRs in the present study which may<br />
imply exposure to some of the above factors. Farmers<br />
have an excess risk that is close to significance<br />
in both genders; this could be interpreted as a sign<br />
of an effect of solar UV exposure.<br />
Some previous occupational studies indicated an<br />
increased risk of ocular melanoma in chemical<br />
industry employees, employees in administration<br />
<strong>and</strong> management, cooks <strong>and</strong> kitchen assistants<br />
[124]. Although the number of eye <strong>cancer</strong>s in our<br />
study is as high as 7 733 cases, we were not able to<br />
confirm any of the suggested excesses.<br />
/ 100 000<br />
15<br />
10<br />
5<br />
Denmark<br />
Finl<strong>and</strong><br />
Icel<strong>and</strong><br />
Norway<br />
Sweden<br />
Men<br />
0<br />
1945 1960 1975 1990 2005<br />
/ 100 000<br />
Brain <strong>cancer</strong><br />
The incidence of <strong>cancer</strong> of the brain <strong>and</strong> central<br />
nervous system is similar in all Nordic countries <strong>and</strong><br />
in both genders (Figure 41). There was an increase<br />
in all countries until about the mid 1990s, <strong>and</strong> later<br />
the slopes have varied from increase to slight<br />
decrease, depending on country <strong>and</strong> gender.<br />
The variation of the SIRs between the occupations<br />
was relatively small. In men, the highest SIRs were<br />
observed among physicians (SIR 1.32, 95% CI<br />
1.16 1.49) <strong>and</strong> ‘‘other health <strong>and</strong> medical workers’’<br />
(Table 60). The SIR was lowest among forestry<br />
workers (0.84, 0.78 0.91). In women, the highest<br />
significant SIR was in public safety <strong>and</strong> protection<br />
work (1.39, 1.02 1.85) <strong>and</strong> lowest for ‘‘other health<br />
<strong>and</strong> medical workers’’ (0.89, 0.82 0.98; Table 61).<br />
In cases classified as gliomas (http://astra.can<br />
cer.fi/NOCCA/Incidence/brain-glioma) in the present<br />
data set (35% of all cases), the SIRs in males<br />
were highest among ‘‘other health workers’’ (1.30,<br />
1.02 1.64), <strong>and</strong> military personnel (1.24, 1.06<br />
1.44). Low SIRs were among forestry workers<br />
(0.78, 0.70 0.88), fishermen (0.81, 0.68 0.96) <strong>and</strong><br />
seamen (0.82, 0.71 0.96). In women, the highest<br />
SIR was among physicians (1.55, 1.02 2.25), while<br />
there were no occupations with an SIR significantly<br />
below unity.<br />
In meningeoma (29% of all cases: http://astra.<br />
<strong>cancer</strong>.fi/NOCCA/Incidence/brain-meningeoma), the<br />
highest SIRs based on at least 15 observed cases<br />
among men were in assistant nurses (1.67, 0.93<br />
2.75), physicians (1.53, 1.13 2.01) <strong>and</strong> ‘‘other health<br />
workers’’ (1.50, 1.05 2.06). The lowest SIRs were in<br />
‘‘other construction workers’’ (0.80, 0.69 0.93), <strong>and</strong><br />
forestry workers (0.82, 0.69 0.98). In women, the<br />
only occupations that came up with somewhat elevated<br />
SIRs were technical, chemical, physical <strong>and</strong><br />
15<br />
10<br />
5<br />
<strong>Occupation</strong> <strong>and</strong> <strong>cancer</strong> in Nordic countries 735<br />
Denmark<br />
Finl<strong>and</strong><br />
Icel<strong>and</strong><br />
Norway<br />
Sweden<br />
Women<br />
0<br />
1945 1960 1975 1990 2005<br />
Figure 41. Age st<strong>and</strong>ardised (World) incidence rates for brain <strong>cancer</strong> 1943 2005, by country <strong>and</strong> gender. Modified from NORDCAN [49].
Acta Oncol Downloaded from informahealthcare.com by 212.35.100.66 on 04/06/11<br />
For personal use only.<br />
736 E. Pukkala et al.<br />
Table 58. Observed number of eye <strong>cancer</strong> among men in the Nordic countries <strong>and</strong> st<strong>and</strong>ardised incidence ratios 1961 2005, by country<br />
<strong>and</strong> occupational category.<br />
Denmark Finl<strong>and</strong> Icel<strong>and</strong> Norway Sweden Total<br />
No <strong>Occupation</strong>al category Obs SIR Obs SIR Obs SIR Obs SIR Obs SIR Obs SIR 95% CI<br />
1 Technical workers, etc 46 1.03 39 0.96 1 2.58 39 1.24 172 1.02 297 1.04 0.93*1.17<br />
2 Laboratory assistants [0.87] 0.00 1 0.97 [0.07] 0.00 4 2.72 1 0.99 6 1.35 0.49*2.93<br />
3 Physicians 3 0.82 5 2.13 [0.13] 0.00 4 1.01 10 1.25 22 1.22 0.76*1.84<br />
4 Dentists 2 1.83 [0.49] 0.00 [0.04] 0.00 3 1.73 6 1.60 11 1.55 0.77*2.77<br />
5 Nurses [0.05] 0.00 [0.16] 0.00 [0.00] 0.00 [0.22] 0.00 [0.67] 0.00 [1.10] 0.00 0.00*3.35<br />
6 Assistant nurses [1.07] 0.00 [0.15] 0.00 [0.02] 0.00 1 1.51 4 1.33 5 1.02 0.33*2.38<br />
7 ‘‘Other health workers’’ 3 0.96 6 2.71 [0.04] 0.00 [1.55] 0.00 6 0.90 15 1.11 0.62*1.82<br />
8 Teachers 26 1.30 16 0.96 1 1.91 21 0.93 44 0.99 108 1.04 0.86*1.25<br />
9 Religious workers etc 6 0.74 8 0.85 [0.36] 0.00 13 1.14 32 0.89 59 0.91 0.69*1.17<br />
10 Artistic workers 2 0.80 [3.26] 0.00 [0.09] 0.00 4 1.21 12 1.16 18 0.92 0.55*1.46<br />
11 Journalists 4 3.38 2 1.28 [0.06] 0.00 2 1.35 5 1.02 13 1.41 0.75*2.42<br />
12 Administrators 47 0.96 28 1.15 1 1.17 51 1.30 57 0.92 184 1.05 0.91*1.21<br />
13 Clerical workers 27 1.23 17 1.07 [1.01] 0.00 34 1.15 67 0.99 145 1.06 0.90*1.25<br />
14 Sales agents 12 1.04 21 0.90 1 2.02 37 1.09 103 1.03 174 1.02 0.88*1.19<br />
15 Shop workers 53 1.08 10 0.97 [0.36] 0.00 12 0.88 30 0.94 105 1.00 0.82*1.21<br />
16 Farmers 88 0.94 105 1.02 2 1.41 98 1.10 175 1.13 468 1.06 0.97*1.16<br />
17 Gardeners 7 0.53 18 1.14 [0.05] 0.00 22 0.98 49 0.83 96 0.87 0.70*1.06<br />
18 Fishermen 2 0.44 3 2.18 [0.90] 0.00 25 0.86 8 1.28 38 0.90 0.64*1.24<br />
19 Forestry workers 5 2.61 14 0.75 [0.01] 0.00 12 0.73 35 0.81 66 0.82 0.64*1.05<br />
20 Miners <strong>and</strong> quarry workers 1 1.70 1 0.33 [0.01] 0.00 5 1.03 9 0.81 16 0.82 0.47*1.33<br />
21 Seamen 6 1.20 3 0.74 [0.24] 0.00 27 1.09 8 0.81 44 1.00 0.73*1.34<br />
22 Transport workers 15 1.44 12 1.07 [0.46] 0.00 17 1.32 47 1.45 91 1.35 1.09*1.66<br />
23 Drivers 26 0.75 38 0.98 3 4.48 27 0.75 90 1.07 184 0.95 0.82*1.10<br />
24 Postal workers 3 0.44 6 1.04 [0.09] 0.00 7 1.02 14 0.76 30 0.79 0.53*1.13<br />
25 Textile workers 6 0.99 1 0.27 [0.15] 0.00 5 0.70 18 0.94 30 0.83 0.56*1.19<br />
26 Shoe <strong>and</strong> leather workers 1 0.68 [1.61] 0.00 [0.03] 0.00 5 1.66 11 1.48 17 1.25 0.73*2.01<br />
27 Smelting workers 17 1.22 3 0.53 [0.20] 0.00 9 0.90 19 0.61 48 0.79 0.58*1.05<br />
28 Mechanics 36 0.96 41 1.07 [0.68] 0.00 46 0.92 173 1.15 296 1.07 0.95*1.20<br />
29 Plumbers 3 0.89 11 1.68 [0.11] 0.00 5 0.85 16 0.92 35 1.05 0.73*1.46<br />
30 Welders 9 1.39 [0.04] 0.00 4 0.59 23 1.13 36 1.07 0.75*1.48<br />
31 Electrical workers 3 0.33 16 0.96 [0.41] 0.00 18 0.81 61 1.15 98 0.97 0.78*1.18<br />
32 Wood workers 23 0.90 41 1.07 1 2.64 54 0.98 111 1.15 230 1.07 0.94*1.21<br />
33 Painters 9 1.07 10 1.18 [0.15] 0.00 6 0.64 30 1.06 55 1.00 0.76*1.31<br />
34 ‘‘Other construction workers’’ 33 1.06 28 1.10 1 1.26 12 1.05 44 0.84 118 0.97 0.81*1.17<br />
35 Bricklayers 10 1.07 4 1.00 5 0.90 11 0.88 30 0.96 0.65*1.37<br />
36 Printers 3 0.50 2 0.49 [0.13] 0.00 5 0.85 18 1.13 28 0.87 0.58*1.26<br />
37 Chemical process workers 5 0.94 5 0.78 [0.07] 0.00 11 0.89 25 1.07 46 0.97 0.71*1.29<br />
38 Food workers 15 0.86 5 1.06 1 1.63 13 0.92 21 0.89 55 0.91 0.68*1.18<br />
39 Beverage workers [2.08] 0.00 1 3.37 [0.01] 0.00 [0.18] 0.00 1 0.75 2 0.51 0.06*1.85<br />
40 Tobacco workers [0.34] 0.00 [0.06] 0.00 [0.00] 0.00 [0.22] 0.00 [0.11] 0.00 [0.72] 0.00 0.00*5.11<br />
41 Glass makers etc 11 1.08 8 1.18 [0.11] 0.00 8 1.13 17 0.65 44 0.88 0.64*1.18<br />
42 Packers 10 1.12 15 1.09 [0.35] 0.00 24 1.12 36 0.77 85 0.93 0.74*1.15<br />
43 Engine operators 11 1.17 24 1.24 2 4.22 15 1.17 46 1.13 98 1.18 0.96*1.44<br />
44 Public safety workers 15 1.73 12 1.13 [0.33] 0.00 6 0.65 19 0.78 52 0.98 0.73*1.28<br />
45 Cooks <strong>and</strong> stewards 1 1.43 2 2.72 [0.16] 0.00 3 0.70 1 0.21 7 0.66 0.27*1.37<br />
46 Domestic assistants [0.01] 0.00 [0.04] 0.00 [0.00] 0.00 [0.04] 0.00 [0.52] 0.00 [0.61] 0.00 0.00*6.06<br />
47 Waiters 1 0.71 [0.72] 0.00 [0.02] 0.00 [1.81] 0.00 1 0.42 2 0.32 0.04*1.14<br />
48 Building caretakers 10 1.11 7 0.79 [0.15] 0.00 6 1.26 16 0.85 39 0.94 0.67*1.28<br />
49 Chimney sweeps [0.24] 0.00 [0.66] 0.00 1 2.06 1 0.73 2 0.72 0.09*2.62<br />
50 Hairdressers 3 1.16 [0.19] 0.00 [0.02] 0.00 2 1.47 4 0.87 9 1.03 0.47*1.95<br />
51 Launderers 1 0.80 [0.19] 0.00 [0.01] 0.00 1 1.23 2 0.61 4 0.72 0.20*1.85<br />
52 Military personnel 2 0.43 5 1.33 10 1.28 21 1.50 38 1.26 0.89*1.72<br />
53 ‘‘Other workers’’ 32 1.15 9 0.84 2 1.53 39 0.98 59 1.04 141 1.03 0.88*1.22<br />
54 Economically inactive 33 1.23 46 0.80 [1.02] 0.00 14 0.65 69 0.75 162 0.81 0.70*0.95<br />
1 54 All categories 678 1.00 658 1.00 16 1.00 792 1.00 1 858 1.00 4 002 1.00 Ref.<br />
Obs observed number of cases; SIR st<strong>and</strong>ardised incidence ratio; 95% CI 95% confidence interval.
Acta Oncol Downloaded from informahealthcare.com by 212.35.100.66 on 04/06/11<br />
For personal use only.<br />
Table 59. Observed number of eye <strong>cancer</strong> among women in the Nordic countries <strong>and</strong> st<strong>and</strong>ardised incidence ratios 1961 2005, by<br />
country <strong>and</strong> occupational category.<br />
Denmark Finl<strong>and</strong> Icel<strong>and</strong> Norway Sweden Total<br />
No <strong>Occupation</strong>al category Obs SIR Obs SIR Obs SIR Obs SIR Obs SIR Obs SIR 95% CI<br />
1 Technical workers, etc 2 1.05 5 1.21 [0.04] 0.00 2 1.72 9 1.11 18 1.18 0.70*1.86<br />
2 Laboratory assistants 1 0.70 3 1.29 [0.06] 0.00 2 1.45 2 0.77 8 1.03 0.44*2.02<br />
3 Physicians 1 1.59 1 0.98 [0.01] 0.00 1 1.77 1 0.52 4 0.97 0.26*2.47<br />
4 Dentists [0.55] 0.00 [1.00] 0.00 [0.00] 0.00 [0.46] 0.00 2 1.45 2 0.59 0.07*2.13<br />
5 Nurses 6 0.54 19 1.60 [0.23] 0.00 15 1.41 17 0.72 57 0.99 0.75*1.29<br />
6 Assistant nurses 9 1.09 14 1.18 [0.27] 0.00 12 1.14 45 1.06 80 1.09 0.86*1.36<br />
7 ‘‘Other health workers’’ 5 0.79 10 1.06 [0.07] 0.00 12 1.15 20 1.38 47 1.15 0.85*1.54<br />
8 Teachers 11 0.77 17 0.81 [0.46] 0.00 20 0.98 63 1.18 111 1.01 0.84*1.22<br />
9 Religious workers etc 1 0.53 9 0.84 [0.07] 0.00 5 0.99 15 0.81 30 0.83 0.56*1.18<br />
10 Artistic workers 1 1.07 3 1.74 [0.04] 0.00 3 2.01 2 0.57 9 1.17 0.54*2.23<br />
11 Journalists 1 4.75 [1.11] 0.00 [0.01] 0.00 2 4.86 [1.64] 0.00 3 0.89 0.18*2.60<br />
12 Administrators 4 0.71 7 1.90 [0.03] 0.00 2 0.41 10 1.28 23 1.05 0.66*1.57<br />
13 Clerical workers 47 0.81 73 1.05 1 0.92 70 1.10 133 1.01 324 1.00 0.90*1.12<br />
14 Sales agents [0.51] 0.00 10 1.04 [0.11] 0.00 7 0.85 15 0.85 32 0.88 0.60*1.25<br />
15 Shop workers 38 1.01 33 0.91 1 1.67 57 1.13 89 1.17 218 1.08 0.95*1.24<br />
16 Farmers 37 1.37 22 1.10 [0.42] 0.00 32 1.00 9 1.27 100 1.15 0.95*1.40<br />
17 Gardeners 3 0.87 46 0.75 [0.01] 0.00 24 1.25 20 1.03 93 0.90 0.72*1.10<br />
18 Fishermen [0.14] 0.00 [0.14] 0.00 [0.02] 0.00 [0.26] 0.00 [0.06] 0.00 [0.62] 0.00 0.00*5.94<br />
19 Forestry workers [0.04] 0.00 [0.26] 0.00 [0.00] 0.00 [0.37] 0.00 [0.44] 0.00 [1.11] 0.00 0.00*3.33<br />
20 Miners <strong>and</strong> quarry workers [0.00] 0.00 [0.11] 0.00 [0.00] 0.00 [0.02] 0.00 [0.11] 0.00 [0.24] 0.00 0.00*15.20<br />
21 Seamen [0.04] 0.00 [0.06] 0.00 [0.02] 0.00 [0.11] 0.00 0.00*32.75<br />
22 Transport workers [0.04] 0.00 2 1.15 [0.01] 0.00 [0.30] 0.00 1 0.76 3 0.88 0.18*2.58<br />
23 Drivers 1 1.02 1 1.18 [0.01] 0.00 2 1.93 4 1.23 8 1.30 0.56*2.57<br />
24 Postal workers 2 1.00 14 1.30 [0.17] 0.00 8 0.66 23 1.03 47 0.99 0.73*1.32<br />
25 Textile workers 7 0.55 25 1.05 1 2.97 11 0.60 43 1.01 87 0.89 0.71*1.10<br />
26 Shoe <strong>and</strong> leather workers [0.95] 0.00 1 0.33 [0.02] 0.00 1 0.75 2 0.61 4 0.47 0.13*1.19<br />
27 Smelting workers [0.23] 0.00 1 1.43 [0.00] 0.00 1 6.23 [0.98] 0.00 2 0.96 0.12*3.48<br />
28 Mechanics 5 2.11 3 0.94 [0.00] 0.00 1 0.60 7 0.72 16 0.94 0.54*1.53<br />
29 Plumbers [0.02] 0.00 [0.01] 0.00 [0.01] 0.00 [0.02] 0.00 [0.06] 0.00 0.00*66.53<br />
30 Welders 1 3.82 [0.00] 0.00 [0.13] 0.00 [0.40] 0.00 1 1.25 0.03*6.99<br />
31 Electrical workers 8 2.43 5 2.33 [0.00] 0.00 1 0.54 1 0.18 15 1.17 0.66*1.94<br />
32 Wood workers [1.08] 0.00 3 0.49 [0.01] 0.00 [0.60] 0.00 2 1.21 5 0.53 0.17*1.24<br />
33 Painters [0.04] 0.00 [0.73] 0.00 [0.00] 0.00 [0.14] 0.00 [0.44] 0.00 [1.35] 0.00 0.00*2.74<br />
34 ‘‘Other construction workers’’ [0.03] 0.00 3 1.28 [0.00] 0.00 [0.05] 0.00 [0.06] 0.00 3 1.20 0.25*3.51<br />
35 Bricklayers [0.01] 0.00 [0.08] 0.00 [0.00] 0.00 [0.00] 0.00 [0.09] 0.00 0.00*41.74<br />
36 Printers 1 0.83 1 0.32 [0.03] 0.00 1 0.62 2 0.50 5 0.50 0.16*1.17<br />
37 Chemical process workers 1 0.54 2 1.27 [0.01] 0.00 [1.44] 0.00 4 1.28 7 0.87 0.35*1.80<br />
38 Food workers 10 1.08 5 0.62 [0.76] 0.00 5 0.56 6 0.67 26 0.72 0.47*1.06<br />
39 Beverage workers [0.85] 0.00 [0.45] 0.00 [0.00] 0.00 [0.08] 0.00 2 3.57 2 1.03 0.13*3.73<br />
40 Tobacco workers 3 2.53 [0.25] 0.00 [0.32] 0.00 1 2.68 4 1.88 0.51*4.81<br />
41 Glass makers etc 4 1.74 8 1.40 [0.02] 0.00 3 0.97 10 1.19 25 1.28 0.83*1.89<br />
42 Packers 1 1.53 8 0.79 [0.06] 0.00 11 1.52 4 0.32 24 0.79 0.51*1.17<br />
43 Engine operators [0.02] 0.00 3 1.80 [0.00] 0.00 [0.11] 0.00 [0.87] 0.00 3 1.12 0.23*3.27<br />
44 Public safety workers [0.06] 0.00 1 2.61 [0.02] 0.00 [0.85] 0.00 [1.19] 0.00 1 0.40 0.01*2.23<br />
45 Cooks <strong>and</strong> stewards [0.02] 0.00 14 1.24 1 3.61 9 0.92 7 0.41 31 0.80 0.55*1.14<br />
46 Domestic assistants 14 0.98 7 0.58 [0.08] 0.00 30 1.16 54 1.09 105 1.03 0.85*1.25<br />
47 Waiters 1 0.41 10 1.02 [0.03] 0.00 6 0.54 19 1.05 36 0.87 0.61*1.20<br />
48 Building caretakers 53 1.30 42 1.10 [0.58] 0.00 47 1.01 49 1.01 191 1.10 0.95*1.26<br />
49 Chimney sweeps [0.00] 0.00 [0.02] 0.00 [0.01] 0.00 [0.00] 0.00 [0.03] 0.00 0.00*117.52<br />
50 Hairdressers 2 0.80 9 2.41 [0.05] 0.00 2 0.67 6 0.73 19 1.09 0.66*1.70<br />
51 Launderers 4 0.87 2 0.66 [0.08] 0.00 3 0.76 16 1.74 25 1.20 0.78*1.77<br />
52 Military personnel [0.02] 0.00 [0.04] 0.00 [0.02] 0.00 [0.04] 0.00 [0.12] 0.00 0.00*30.20<br />
53 ‘‘Other workers’’ 17 1.46 12 1.00 1 1.80 20 0.81 20 0.91 70 0.99 0.77*1.25<br />
54 Economically inactive 293 0.99 245 1.00 4 1.70 309 1.00 956 1.00 1 807 1.00 0.95*1.05<br />
1 54 All categories 594 1.00 700 1.00 9 1.00 737 1.00 1 691 1.00 3 731 1.00 Ref.<br />
Obs observed number of cases; SIR st<strong>and</strong>ardised incidence ratio; 95% CI 95% confidence interval.<br />
<strong>Occupation</strong> <strong>and</strong> <strong>cancer</strong> in Nordic countries 737
Acta Oncol Downloaded from informahealthcare.com by 212.35.100.66 on 04/06/11<br />
For personal use only.<br />
738 E. Pukkala et al.<br />
Table 60. Observed number of brain <strong>cancer</strong> among men in the Nordic countries <strong>and</strong> st<strong>and</strong>ardised incidence ratios 1961 2005, by country<br />
<strong>and</strong> occupational category.<br />
Denmark Finl<strong>and</strong> Icel<strong>and</strong> Norway Sweden Total<br />
No <strong>Occupation</strong>al category Obs SIR Obs SIR Obs SIR Obs SIR Obs SIR Obs SIR 95% CI<br />
1 Technical workers, etc 447 1.02 476 1.05 3 0.49 322 1.03 1 830 1.10 3 078 1.07 1.03*1.11<br />
2 Laboratory assistants 7 0.81 13 1.09 2 1.82 15 1.07 13 1.06 50 1.04 0.78*1.38<br />
3 Physicians 57 1.66 38 1.44 3 1.46 48 1.31 93 1.13 239 1.32 1.16*1.49<br />
4 Dentists 12 1.13 6 1.13 [0.61] 0.00 16 1.01 49 1.32 83 1.19 0.95*1.48<br />
5 Nurses [0.54] 0.00 3 1.31 [0.03] 0.00 1 0.38 12 1.36 16 1.12 0.64*1.81<br />
6 Assistant nurses 6 0.56 3 1.32 [0.34] 0.00 3 0.51 35 1.07 47 0.90 0.66*1.20<br />
7 ‘‘Other health workers’’ 35 1.16 34 1.41 [0.59] 0.00 23 1.60 84 1.26 176 1.30 1.12*1.50<br />
8 Teachers 193 1.00 175 0.99 7 0.87 242 1.11 475 1.04 1 092 1.04 0.98*1.10<br />
9 Religious workers etc 59 0.80 137 1.25 9 1.70 106 1.00 417 1.11 728 1.08 1.01*1.17<br />
10 Artistic workers 27 1.14 31 0.88 5 3.62 32 1.06 89 0.86 184 0.95 0.82*1.09<br />
11 Journalists 11 0.95 20 1.19 1 1.19 19 1.37 46 0.93 97 1.05 0.85*1.28<br />
12 Administrators 535 1.15 276 1.08 15 1.31 404 1.15 640 1.10 1 870 1.12 1.07*1.18<br />
13 Clerical workers 206 0.98 175 1.10 15 1.11 261 0.97 677 1.04 1 334 1.02 0.97*1.08<br />
14 Sales agents 116 1.03 268 1.10 6 0.88 333 1.12 1 020 1.05 1 743 1.07 1.02*1.12<br />
15 Shop workers 479 1.04 119 1.05 6 1.17 140 1.08 321 1.03 1 065 1.04 0.98*1.11<br />
16 Farmers 794 0.95 820 0.93 18 0.96 647 0.96 1 299 0.98 3 578 0.96 0.93*0.99<br />
17 Gardeners 108 0.90 146 0.96 [0.63] 0.00 150 0.82 516 0.97 920 0.93 0.87*0.99<br />
18 Fishermen 45 1.01 12 0.97 11 0.73 212 0.89 47 0.84 327 0.89 0.80*1.00<br />
19 Forestry workers 13 0.76 160 0.88 [0.11] 0.00 119 0.93 311 0.80 603 0.84 0.78*0.91<br />
20 Miners <strong>and</strong> quarry workers 8 1.46 30 1.00 1 4.26 35 0.83 93 0.90 167 0.92 0.79*1.07<br />
21 Seamen 66 1.29 44 1.07 3 0.84 212 0.93 82 0.86 407 0.97 0.88*1.07<br />
22 Transport workers 112 1.09 112 1.01 6 0.98 117 1.06 314 1.03 661 1.04 0.96*1.12<br />
23 Drivers 322 0.93 393 0.98 11 1.10 327 0.98 769 0.93 1 822 0.95 0.91*1.00<br />
24 Postal workers 71 1.02 55 0.92 2 1.74 55 0.93 192 1.08 375 1.02 0.92*1.13<br />
25 Textile workers 57 1.01 40 1.15 1 0.53 63 1.07 162 0.95 323 1.00 0.90*1.12<br />
26 Shoe <strong>and</strong> leather workers 13 0.96 22 1.48 1 2.55 22 0.93 54 0.85 112 0.96 0.80*1.16<br />
27 Smelting workers 125 0.91 53 0.95 3 1.05 82 0.95 275 0.96 538 0.95 0.87*1.03<br />
28 Mechanics 354 0.97 428 1.05 8 0.75 446 0.97 1 550 1.05 2 786 1.02 0.99*1.06<br />
29 Plumbers 31 0.93 65 0.94 2 1.24 52 0.93 167 0.99 317 0.96 0.86*1.07<br />
30 Welders 71 0.95 [0.64] 0.00 72 1.09 203 0.98 346 0.99 0.90*1.11<br />
31 Electrical workers 101 1.12 168 0.91 5 0.76 221 1.08 516 0.97 1 011 0.99 0.93*1.05<br />
32 Wood workers 240 0.99 368 1.00 7 1.30 472 1.01 807 0.91 1 894 0.96 0.92*1.01<br />
33 Painters 89 1.08 84 1.01 2 0.92 75 0.94 274 1.03 524 1.02 0.94*1.11<br />
34 ‘‘Other construction workers’’ 273 0.94 233 0.96 11 0.92 90 0.88 437 0.90 1 044 0.92 0.87*0.98<br />
35 Bricklayers 88 0.99 31 0.80 58 1.23 113 1.00 290 1.01 0.90*1.13<br />
36 Printers 64 1.08 41 0.92 [1.96] 0.00 56 1.04 156 0.99 317 1.00 0.90*1.12<br />
37 Chemical process workers 58 1.15 80 1.20 2 2.16 88 0.85 190 0.88 418 0.96 0.87*1.05<br />
38 Food workers 171 1.01 39 0.82 8 0.98 122 1.01 211 0.96 551 0.97 0.90*1.06<br />
39 Beverage workers 17 0.82 3 1.04 [0.13] 0.00 2 0.94 12 0.99 34 0.89 0.62*1.25<br />
40 Tobacco workers 3 0.98 1 1.83 [0.01] 0.00 2 1.15 2 1.86 8 1.24 0.54*2.45<br />
41 Glass makers etc 79 0.81 71 1.00 1 0.66 59 0.92 247 1.00 457 0.95 0.87*1.04<br />
42 Packers 81 0.96 136 1.00 5 1.09 185 1.02 435 1.01 842 1.01 0.94*1.08<br />
43 Engine operators 81 0.89 197 0.97 10 1.40 120 0.98 396 0.99 804 0.98 0.91*1.05<br />
44 Public safety workers 68 0.83 107 0.97 3 0.64 84 1.04 244 1.01 506 0.97 0.89*1.06<br />
45 Cooks <strong>and</strong> stewards 1 0.14 8 0.88 3 1.19 41 1.01 49 0.99 102 0.94 0.77*1.14<br />
46 Domestic assistants 1 12.18 [0.36] 0.00 [0.01] 0.00 1 2.46 7 1.05 9 1.20 0.55*2.27<br />
47 Waiters 16 1.09 15 1.64 [0.31] 0.00 10 0.60 31 1.24 72 1.09 0.86*1.38<br />
48 Building caretakers 105 1.23 86 0.99 4 2.39 39 0.93 152 0.85 386 0.98 0.88*1.08<br />
49 Chimney sweeps 5 2.05 3 0.46 4 0.94 9 0.66 21 0.78 0.49*1.20<br />
50 Hairdressers 27 1.12 [1.97] 0.00 1 2.81 9 0.77 38 0.91 75 0.94 0.74*1.18<br />
51 Launderers 13 1.10 [2.00] 0.00 [0.15] 0.00 6 0.87 27 0.90 46 0.91 0.66*1.21<br />
52 Military personnel 61 1.27 50 1.17 78 1.05 150 1.09 339 1.12 1.01*1.25<br />
53 ‘‘Other workers’’ 247 0.90 77 0.73 17 0.95 334 1.03 485 0.94 1 160 0.94 0.88*0.99<br />
54 Economically inactive 236 1.01 488 1.00 11 0.78 159 0.92 883 0.98 1 777 0.98 0.94*1.03<br />
1 54 All categories 6 434 1.00 6 511 1.00 229 1.00 6 891 1.00 17 706 1.00 37 771 1.00 Ref.<br />
Obs observed number of cases; SIR st<strong>and</strong>ardised incidence ratio; 95% CI 95% confidence interval.
Acta Oncol Downloaded from informahealthcare.com by 212.35.100.66 on 04/06/11<br />
For personal use only.<br />
Table 61. Observed number of brain <strong>cancer</strong> among women in the Nordic countries <strong>and</strong> st<strong>and</strong>ardised incidence ratios 1961 2005, by<br />
country <strong>and</strong> occupational category.<br />
Denmark Finl<strong>and</strong> Icel<strong>and</strong> Norway Sweden Total<br />
No <strong>Occupation</strong>al category Obs SIR Obs SIR Obs SIR Obs SIR Obs SIR Obs SIR 95% CI<br />
1 Technical workers, etc 32 1.36 80 1.15 1 1.06 11 0.78 130 1.18 254 1.16 1.03*1.32<br />
2 Laboratory assistants 17 0.95 37 1.02 2 1.48 27 1.69 42 0.99 125 1.10 0.92*1.31<br />
3 Physicians 13 1.68 23 1.30 [0.21] 0.00 9 1.38 22 0.78 67 1.11 0.86*1.41<br />
4 Dentists 3 0.44 7 0.48 [0.09] 0.00 7 1.38 17 0.93 34 0.76 0.53*1.06<br />
5 Nurses 156 1.16 219 1.18 7 1.19 125 0.99 321 1.02 828 1.08 1.01*1.16<br />
6 Assistant nurses 110 1.08 174 1.02 4 0.47 112 0.90 619 1.05 1 019 1.03 0.96*1.09<br />
7 ‘‘Other health workers’’ 76 0.99 121 0.85 1 0.55 110 0.92 178 0.87 486 0.89 0.82*0.98<br />
8 Teachers 191 1.09 341 1.09 16 1.50 251 1.07 786 1.08 1 585 1.09 1.03*1.14<br />
9 Religious workers etc 32 1.37 223 1.18 2 1.27 52 0.90 285 1.05 594 1.09 1.01*1.19<br />
10 Artistic workers 7 0.62 23 0.83 3 2.33 18 1.09 49 1.03 100 0.96 0.79*1.16<br />
11 Journalists 2 0.76 19 1.12 [0.34] 0.00 5 1.04 23 1.01 49 1.03 0.76*1.36<br />
12 Administrators 66 0.97 60 1.02 1 1.05 56 1.06 123 1.14 306 1.06 0.95*1.19<br />
13 Clerical workers 758 1.07 1 107 1.05 27 0.83 705 0.99 1 769 1.02 4 366 1.03 1.00*1.06<br />
14 Sales agents 3 0.48 130 0.95 4 1.23 80 0.98 206 0.93 423 0.94 0.86*1.03<br />
15 Shop workers 440 0.95 487 0.98 15 0.75 566 1.05 922 1.02 2 430 1.00 0.96*1.04<br />
16 Farmers 292 0.90 220 0.88 16 1.15 330 1.05 80 0.89 938 0.94 0.88*1.01<br />
17 Gardeners 35 0.83 702 0.93 [0.48] 0.00 174 0.91 196 0.86 1 107 0.91 0.86*0.97<br />
18 Fishermen 2 1.18 1 0.52 2 3.66 2 0.70 3 3.72 10 1.28 0.61*2.35<br />
19 Forestry workers 1 2.24 2 0.54 [0.07] 0.00 4 1.01 5 0.91 12 0.88 0.45*1.54<br />
20 Miners <strong>and</strong> quarry workers [0.03] 0.00 1 0.73 [0.01] 0.00 1 4.00 [1.43] 0.00 2 0.65 0.08*2.33<br />
21 Seamen [0.62] 0.00 [0.00] 0.00 1 1.45 1 4.00 2 1.28 0.16*4.63<br />
22 Transport workers [0.46] 0.00 19 0.86 1 1.92 5 1.44 15 0.88 40 0.92 0.66*1.25<br />
23 Drivers 18 1.51 5 0.39 [0.26] 0.00 10 0.86 58 1.29 91 1.12 0.90*1.37<br />
24 Postal workers 18 0.74 139 0.96 7 1.08 117 0.90 285 1.04 566 0.97 0.90*1.06<br />
25 Textile workers 161 1.03 316 1.00 12 1.07 176 0.98 500 1.05 1 165 1.02 0.96*1.08<br />
26 Shoe <strong>and</strong> leather workers 14 1.19 34 0.86 1 1.61 7 0.53 35 0.94 91 0.89 0.72*1.09<br />
27 Smelting workers 3 1.04 11 1.20 [0.03] 0.00 [1.94] 0.00 15 1.15 29 1.08 0.72*1.54<br />
28 Mechanics 37 1.26 44 0.98 [0.12] 0.00 12 0.67 130 1.03 223 1.02 0.89*1.16<br />
29 Plumbers [0.22] 0.00 [0.13] 0.00 [0.15] 0.00 [0.26] 0.00 [0.75] 0.00 0.00*4.90<br />
30 Welders 6 1.51 [0.01] 0.00 4 2.43 6 1.03 16 1.39 0.80*2.26<br />
31 Electrical workers 41 0.99 36 1.06 [0.11] 0.00 18 0.88 76 1.06 171 1.02 0.88*1.19<br />
32 Wood workers 17 1.27 68 0.88 [0.21] 0.00 10 1.46 20 0.90 115 0.96 0.80*1.15<br />
33 Painters [0.50] 0.00 11 1.12 [0.06] 0.00 3 1.99 6 1.06 20 1.14 0.70*1.76<br />
34 ‘‘Other construction workers’’ [0.38] 0.00 31 1.09 [0.04] 0.00 1 1.71 1 1.08 33 1.09 0.75*1.53<br />
35 Bricklayers [0.08] 0.00 [1.07] 0.00 [0.03] 0.00 [0.03] 0.00 [1.22] 0.00 0.00*3.03<br />
36 Printers 21 1.40 50 1.16 2 1.94 11 0.65 42 0.83 126 1.00 0.84*1.18<br />
37 Chemical process workers 26 1.12 20 0.97 [0.43] 0.00 19 1.26 36 0.95 101 1.04 0.85*1.26<br />
38 Food workers 117 1.02 99 0.95 28 1.12 75 0.84 104 0.99 423 0.96 0.88*1.06<br />
39 Beverage workers 11 1.03 2 0.36 [0.06] 0.00 [0.89] 0.00 4 0.62 17 0.72 0.42*1.15<br />
40 Tobacco workers 14 0.94 10 3.14 2 0.65 4 0.90 30 1.17 0.79*1.67<br />
41 Glass makers etc 27 0.94 76 0.99 [0.69] 0.00 23 0.70 108 1.06 234 0.97 0.85*1.10<br />
42 Packers 12 1.49 143 1.06 2 0.87 76 1.00 151 1.01 384 1.04 0.94*1.15<br />
43 Engine operators [0.28] 0.00 21 0.92 [0.04] 0.00 4 2.93 19 1.53 44 1.19 0.86*1.60<br />
44 Public safety workers [0.81] 0.00 9 1.55 1 2.16 15 1.72 22 1.23 47 1.39 1.02*1.85<br />
45 Cooks <strong>and</strong> stewards [0.29] 0.00 164 1.06 5 0.58 93 0.98 219 1.09 481 1.05 0.96*1.15<br />
46 Domestic assistants 178 1.02 164 0.91 5 2.06 231 0.90 585 0.90 1 163 0.92 0.87*0.97<br />
47 Waiters 30 0.98 131 0.94 [1.05] 0.00 113 0.98 221 1.05 495 1.00 0.91*1.09<br />
48 Building caretakers 471 0.94 471 0.94 23 1.32 460 0.94 607 1.01 2 032 0.96 0.92*1.00<br />
49 Chimney sweeps [0.04] 0.00 [0.26] 0.00 [0.06] 0.00 [0.03] 0.00 [0.39] 0.00 0.00*9.54<br />
50 Hairdressers 31 0.99 58 1.08 1 0.87 23 0.72 108 1.04 221 1.00 0.87*1.14<br />
51 Launderers 63 1.12 31 0.83 3 1.13 47 1.20 109 1.06 253 1.06 0.94*1.20<br />
52 Military personnel [0.29] 0.00 1 1.37 [0.19] 0.00 [0.67] 0.00 1 0.53 0.01*2.96<br />
53 ‘‘Other workers’’ 144 1.00 159 0.95 21 1.12 241 0.92 275 1.00 840 0.97 0.91*1.04<br />
54 Economically inactive 3 579 0.99 3 022 1.01 58 0.90 3 009 1.04 10 676 0.99 20 344 1.00 0.98*1.01<br />
1 54 All categories 7 269 1.00 9 328 1.00 271 1.00 7 451 1.00 20 214 1.00 44 533 1.00 Ref.<br />
Obs observed number of cases; SIR st<strong>and</strong>ardised incidence ratio; 95% CI 95% confidence interval.<br />
<strong>Occupation</strong> <strong>and</strong> <strong>cancer</strong> in Nordic countries 739
Acta Oncol Downloaded from informahealthcare.com by 212.35.100.66 on 04/06/11<br />
For personal use only.<br />
740 E. Pukkala et al.<br />
biological workers (1.21, 1.01 1.46) <strong>and</strong> teachers<br />
(1.12, 1.03 1.20), while none of the significant SIRs<br />
were below 0.85.<br />
Comment. To date, no lifestyle or environmental risk<br />
factors for brain <strong>cancer</strong> have been identified, except<br />
for ionising radiation [131]. Exposure to electromagnetic<br />
fields <strong>and</strong> to mobile cell phones have been<br />
hypothesised as possibly increasing brain <strong>cancer</strong> risk,<br />
but results from large studies have not confirmed any<br />
associations. Chemicals suspected to be associated<br />
with risk in animal models are epichlorohydrin<br />
<strong>and</strong> non-arsenical insecticides [118]. In this study<br />
we did not find evidence of an association with<br />
occupational exposures.<br />
In the present data set, only about one-third of the<br />
cases were classified as gliomas <strong>and</strong> one-fourth as<br />
meningiomas. These low proportions indicate problems<br />
in finding comparable code definitions over<br />
the Nordic countries; e.g. only 9% of the Danish<br />
cases were included in the category of gliomas. If<br />
this type of classification problem is not related to<br />
occupation it does not bias SIR estimates. The other<br />
potential source of bias may be the diverging degree<br />
of diagnostic precision; this may well explain clustering<br />
of medical work occupations on the top of the<br />
list of the highest SIRs for meningeoma.<br />
Thyroid <strong>cancer</strong><br />
The incidence of thyroid <strong>cancer</strong> in the Nordic<br />
countries is twofold higher in women than in men<br />
(Figure 42). The two most common histological<br />
types are papillary (70%) <strong>and</strong> follicular carcinoma<br />
(10 20%). The incidence of thyroid <strong>cancer</strong> is by far<br />
the highest in Icel<strong>and</strong>. There was a rapid increase in<br />
Finl<strong>and</strong> until the mid 1990s but the rates in Finl<strong>and</strong><br />
are still only about one half of the rates in Icel<strong>and</strong>.<br />
/ 100 000<br />
15<br />
10<br />
5<br />
Denmark<br />
Finl<strong>and</strong><br />
Icel<strong>and</strong><br />
Norway<br />
Sweden<br />
Men<br />
0<br />
1945 1960 1975 1990 2005<br />
/ 100 000<br />
We found quite modest <strong>and</strong> inconsistent variation<br />
in risk of thyroid <strong>cancer</strong> between occupations<br />
(Tables 62, 63). Male fishermen in Icel<strong>and</strong> <strong>and</strong><br />
Norway had elevated SIRs, but not fishermen<br />
in the other countries, resulting in an overall SIR<br />
of 1.32 (95% CI 1.07 1.62). The other significant<br />
elevated SIRs among men were in public safety work<br />
<strong>and</strong> clerical work. Female farmers had an SIR of<br />
1.18 (1.07 1.30).<br />
There was an elevated risk of the papillary type of<br />
thyroid <strong>cancer</strong> in fishermen (1.70, 1.27 2.23; http://<br />
astra.<strong>cancer</strong>.fi/NOCCA/Incidence/thyroid-papillary)<br />
<strong>and</strong> seamen (1.43, 1.04 1.91) while the SIRs for<br />
the follicular type were below unity, for the seaman<br />
even significantly so (http://astra.<strong>cancer</strong>.fi/NOCCA/<br />
Incidence/thyroid-follicular). Significant excess risks<br />
for follicular thyroid <strong>cancer</strong> were observed among<br />
male ‘‘other health workers (3.24, 1.19 7.04), public<br />
safety workers (1.95, 1.14 3.12) <strong>and</strong> mechanics<br />
(1.47, 1.11 1.91), <strong>and</strong> among female glass etc.<br />
workers (2.11, 1.29 3.26).<br />
Comment. Childhood exposure to ionising radiation<br />
is one of the few risk factors that are clearly<br />
associated with thyroid <strong>cancer</strong>, while radiation in<br />
adulthood has not been linked convincingly to<br />
thyroid <strong>cancer</strong> [132]. Several studies have indicated<br />
that an increased intake of iodine is associated with a<br />
larger risk, especially for the papillary type, but a<br />
reverse association with iodine intake for the follicular<br />
type. Fishermen <strong>and</strong> seamen are assumed to<br />
consume more oceanic fish rich of iodine than<br />
others, <strong>and</strong> thus the increased risk of papillary<br />
thyroid <strong>cancer</strong> <strong>and</strong> decreased risk of follicular<br />
thyroid <strong>cancer</strong> among them are in line with the<br />
iodine theory. Wood processing has been suggested<br />
as a risk factor; in the present study the SIR among<br />
the wood workers was about 1.0.<br />
15<br />
10<br />
5<br />
0<br />
Denmark<br />
Finl<strong>and</strong><br />
Icel<strong>and</strong><br />
Norway<br />
Sweden<br />
Women<br />
1945 1960 1975 1990 2005<br />
Figure 42. Age st<strong>and</strong>ardised (World) incidence rates for thyroid <strong>cancer</strong> 1943 2005, by country <strong>and</strong> gender. Modified from NORDCAN<br />
[49].
Acta Oncol Downloaded from informahealthcare.com by 212.35.100.66 on 04/06/11<br />
For personal use only.<br />
Table 62. Observed number of thyroid <strong>cancer</strong> among men in the Nordic countries <strong>and</strong> st<strong>and</strong>ardised incidence ratios 1961 2005, by<br />
country <strong>and</strong> occupational category.<br />
Denmark Finl<strong>and</strong> Icel<strong>and</strong> Norway Sweden Total<br />
No <strong>Occupation</strong>al category Obs SIR Obs SIR Obs SIR Obs SIR Obs SIR Obs SIR 95% CI<br />
1 Technical workers, etc 43 1.14 125 1.16 2 0.61 36 0.66 278 1.04 484 1.03 0.94*1.12<br />
2 Laboratory assistants 1 1.34 2 0.70 2 3.31 1 0.40 2 1.17 8 0.95 0.41*1.88<br />
3 Physicians 1 0.33 5 0.80 2 1.69 5 0.73 12 0.92 25 0.82 0.53*1.22<br />
4 Dentists 1 1.10 1 0.78 [0.34] 0.00 4 1.36 6 1.01 12 1.05 0.54*1.83<br />
5 Nurses [0.04] 0.00 1 1.70 [0.01] 0.00 [0.48] 0.00 [1.27] 0.00 1 0.42 0.01*2.33<br />
6 Assistant nurses [0.91] 0.00 1 1.69 [0.17] 0.00 [1.10] 0.00 7 1.37 8 1.01 0.44*2.00<br />
7 ‘‘Other health workers’’ 4 1.51 5 0.88 [0.32] 0.00 4 1.49 14 1.30 27 1.22 0.80*1.77<br />
8 Teachers 20 1.21 45 1.11 4 0.89 48 1.20 82 1.15 199 1.15 1.00*1.32<br />
9 Religious workers etc 7 1.03 24 0.90 5 1.70 22 1.11 58 0.98 116 1.00 0.84*1.20<br />
10 Artistic workers 1 0.47 12 1.45 1 1.29 5 0.91 12 0.72 31 0.93 0.63*1.32<br />
11 Journalists [1.01] 0.00 2 0.51 [0.47] 0.00 2 0.79 10 1.25 14 0.88 0.48*1.48<br />
12 Administrators 46 1.11 75 1.26 7 1.02 64 0.97 104 1.05 296 1.09 0.97*1.22<br />
13 Clerical workers 25 1.35 58 1.56 10 1.27 49 1.01 122 1.13 264 1.20 1.06*1.35<br />
14 Sales agents 6 0.61 57 1.01 4 1.01 55 0.98 160 1.00 282 0.99 0.88*1.11<br />
15 Shop workers 40 0.96 19 0.72 2 0.69 22 0.95 42 0.83 125 0.86 0.73*1.03<br />
16 Farmers 57 0.73 190 0.95 9 0.81 143 1.02 240 0.98 639 0.95 0.88*1.02<br />
17 Gardeners 9 0.81 32 0.93 [0.38] 0.00 33 0.95 62 0.66 136 0.78 0.66*0.92<br />
18 Fishermen 1 0.26 [2.88] 0.00 12 1.49 73 1.60 7 0.70 93 1.32 1.07*1.62<br />
19 Forestry workers 2 1.23 24 0.59 [0.07] 0.00 19 0.75 75 1.09 120 0.88 0.73*1.05<br />
20 Miners <strong>and</strong> quarry workers [0.51] 0.00 5 0.74 1 7.85 7 0.90 14 0.79 27 0.82 0.54*1.19<br />
21 Seamen 2 0.47 9 0.95 2 1.01 49 1.20 18 1.14 80 1.10 0.88*1.38<br />
22 Transport workers 9 0.99 26 1.03 7 1.93 18 0.90 52 1.02 112 1.03 0.85*1.24<br />
23 Drivers 24 0.81 99 1.08 2 0.35 49 0.82 156 1.17 330 1.03 0.92*1.15<br />
24 Postal workers 8 1.37 11 0.79 [0.68] 0.00 12 1.06 25 0.84 56 0.91 0.69*1.18<br />
25 Textile workers 2 0.39 7 0.88 1 0.89 11 0.99 32 1.07 53 0.96 0.72*1.25<br />
26 Shoe <strong>and</strong> leather workers 1 0.79 6 1.75 [0.23] 0.00 4 0.86 11 0.94 22 1.03 0.65*1.56<br />
27 Smelting workers 10 0.84 13 1.01 [1.66] 0.00 20 1.24 43 0.87 86 0.94 0.75*1.16<br />
28 Mechanics 26 0.82 110 1.15 8 1.37 82 0.99 234 0.97 460 1.01 0.92*1.10<br />
29 Plumbers 3 1.04 13 0.81 1 1.12 8 0.81 23 0.83 48 0.84 0.62*1.11<br />
30 Welders 16 0.91 1 2.84 9 0.79 38 1.17 64 1.03 0.80*1.32<br />
31 Electrical workers 5 0.65 42 0.97 6 1.71 38 1.03 89 1.04 180 1.02 0.88*1.18<br />
32 Wood workers 24 1.11 86 1.02 2 0.66 80 0.91 140 0.91 332 0.95 0.85*1.05<br />
33 Painters 9 1.25 19 0.99 1 0.82 14 0.93 49 1.08 92 1.05 0.84*1.28<br />
34 ‘‘Other construction workers’’ 37 1.38 40 0.73 4 0.61 17 0.89 64 0.76 162 0.85 0.73*0.99<br />
35 Bricklayers 12 1.52 5 0.57 7 0.80 22 1.12 46 1.02 0.75*1.36<br />
36 Printers 9 1.76 9 0.86 [1.07] 0.00 5 0.50 20 0.79 43 0.83 0.60*1.11<br />
37 Chemical process workers 5 1.09 16 1.04 1 1.83 18 0.91 36 0.96 76 0.98 0.77*1.23<br />
38 Food workers 17 1.13 12 1.10 2 0.42 31 1.36 34 0.91 96 1.06 0.86*1.29<br />
39 Beverage workers 7 3.80 [0.67] 0.00 [0.08] 0.00 [0.37] 0.00 1 0.47 8 1.57 0.68*3.09<br />
40 Tobacco workers 1 3.41 [0.13] 0.00 [0.00] 0.00 [0.34] 0.00 [0.18] 0.00 1 1.06 0.03*5.92<br />
41 Glass makers etc 6 0.69 9 0.55 1 1.15 9 0.77 36 0.86 61 0.77 0.59*0.99<br />
42 Packers 4 0.52 31 0.99 2 0.75 29 0.84 79 1.06 145 0.96 0.82*1.13<br />
43 Engine operators 8 1.00 42 0.89 3 0.76 28 1.27 70 1.07 151 1.03 0.88*1.21<br />
44 Public safety workers 10 1.38 31 1.20 5 1.87 15 1.00 51 1.31 112 1.25 1.04*1.50<br />
45 Cooks <strong>and</strong> stewards [0.60] 0.00 3 1.34 [1.37] 0.00 8 1.09 7 0.90 18 0.93 0.55*1.48<br />
46 Domestic assistants [0.01] 0.00 [0.09] 0.00 [0.00] 0.00 [0.07] 0.00 2 2.05 2 1.74 0.21*6.27<br />
47 Waiters 2 1.59 2 0.88 [0.16] 0.00 2 0.66 6 1.53 12 1.13 0.58*1.97<br />
48 Building caretakers 9 1.15 21 1.04 2 1.95 13 1.61 30 0.98 75 1.10 0.87*1.38<br />
49 Chimney sweeps [0.21] 0.00 1 0.68 2 2.53 3 1.36 6 1.28 0.47*2.79<br />
50 Hairdressers 3 1.35 [0.47] 0.00 [0.20] 0.00 4 1.81 12 1.67 19 1.55 0.93*2.41<br />
51 Launderers 2 1.85 1 2.16 [0.10] 0.00 1 0.78 3 0.58 7 0.87 0.35*1.79<br />
52 Military personnel 7 1.79 20 2.01 15 1.19 21 0.95 63 1.29 0.99*1.66<br />
53 ‘‘Other workers’’ 22 0.91 21 0.86 9 0.87 55 0.86 84 0.93 191 0.90 0.78*1.03<br />
54 Economically inactive 29 1.20 108 0.91 9 1.14 50 1.34 175 1.14 371 1.08 0.98*1.20<br />
1 54 All categories 577 1.00 1 512 1.00 130 1.00 1 295 1.00 2 973 1.00 6 487 1.00 Ref.<br />
Obs observed number of cases; SIR st<strong>and</strong>ardised incidence ratio; 95% CI 95% confidence interval.<br />
<strong>Occupation</strong> <strong>and</strong> <strong>cancer</strong> in Nordic countries 741
Acta Oncol Downloaded from informahealthcare.com by 212.35.100.66 on 04/06/11<br />
For personal use only.<br />
742 E. Pukkala et al.<br />
Table 63. Observed number of thyroid <strong>cancer</strong> among women in the Nordic countries <strong>and</strong> st<strong>and</strong>ardised incidence ratios 1961 2005, by<br />
country <strong>and</strong> occupational category.<br />
Denmark Finl<strong>and</strong> Icel<strong>and</strong> Norway Sweden Total<br />
No <strong>Occupation</strong>al category Obs SIR Obs SIR Obs SIR Obs SIR Obs SIR Obs SIR 95% CI<br />
1 Technical workers, etc 3 0.82 46 0.97 2 1.76 10 1.59 42 1.11 103 1.07 0.88*1.30<br />
2 Laboratory assistants 6 2.19 20 0.88 1 0.70 5 0.73 20 1.37 52 1.08 0.80*1.41<br />
3 Physicians [1.21] 0.00 18 1.47 1 4.99 2 0.70 2 0.21 23 0.88 0.56*1.32<br />
4 Dentists [1.07] 0.00 7 0.83 [0.08] 0.00 [2.18] 0.00 10 1.57 17 0.94 0.55*1.51<br />
5 Nurses 25 1.16 138 1.19 8 1.39 57 1.08 101 0.93 329 1.08 0.97*1.20<br />
6 Assistant nurses 11 0.71 119 1.21 12 1.43 49 0.96 202 1.00 393 1.05 0.95*1.16<br />
7 ‘‘Other health workers’’ 10 0.82 104 1.20 [1.90] 0.00 47 0.95 67 0.96 228 1.04 0.91*1.18<br />
8 Teachers 29 1.05 184 0.99 14 1.29 100 0.99 239 0.96 566 0.99 0.91*1.07<br />
9 Religious workers etc 2 0.55 134 1.01 3 1.93 35 1.42 83 0.88 257 1.00 0.89*1.13<br />
10 Artistic workers 2 1.05 16 0.89 [1.18] 0.00 9 1.28 21 1.27 48 1.08 0.79*1.43<br />
11 Journalists [0.41] 0.00 6 0.57 [0.32] 0.00 1 0.49 9 1.14 16 0.76 0.43*1.23<br />
12 Administrators 4 0.36 31 0.81 1 1.39 22 0.95 28 0.75 86 0.78 0.62*0.96<br />
13 Clerical workers 97 0.89 585 0.90 36 1.12 274 0.94 546 0.93 1 538 0.92 0.88*0.97<br />
14 Sales agents [0.97] 0.00 74 0.94 1 0.38 23 0.65 63 0.80 161 0.82 0.70*0.96<br />
15 Shop workers 60 0.82 244 0.90 15 0.84 195 0.91 287 0.92 801 0.90 0.84*0.97<br />
16 Farmers 63 1.22 138 1.05 8 0.74 171 1.30 40 1.26 420 1.18 1.07*1.30<br />
17 Gardeners 2 0.30 382 1.06 [0.40] 0.00 84 1.08 76 0.97 544 1.04 0.95*1.13<br />
18 Fishermen [0.26] 0.00 1 0.93 [0.51] 0.00 3 2.59 [0.28] 0.00 4 1.22 0.33*3.12<br />
19 Forestry workers [0.07] 0.00 1 0.49 [0.07] 0.00 1 0.67 1 0.53 3 0.54 0.11*1.58<br />
20 Miners <strong>and</strong> quarry workers [0.01] 0.00 1 1.47 [0.01] 0.00 [0.11] 0.00 [0.48] 0.00 1 0.78 0.02*4.34<br />
21 Seamen [0.41] 0.00 [0.01] 0.00 1 3.56 [0.09] 0.00 1 1.27 0.03*7.06<br />
22 Transport workers [0.07] 0.00 9 0.82 [0.40] 0.00 [1.48] 0.00 7 1.15 16 0.84 0.48*1.37<br />
23 Drivers 1 0.55 8 1.02 1 3.97 4 0.82 17 1.12 31 1.03 0.70*1.47<br />
24 Postal workers 1 0.26 81 1.03 7 1.34 54 1.00 99 1.05 242 1.03 0.91*1.17<br />
25 Textile workers 22 0.90 171 1.02 9 1.10 69 0.93 173 1.03 444 1.00 0.91*1.10<br />
26 Shoe <strong>and</strong> leather workers 2 1.12 21 1.01 [0.47] 0.00 5 0.93 14 1.07 42 1.01 0.73*1.37<br />
27 Smelting workers 1 2.27 6 1.27 [0.02] 0.00 [0.80] 0.00 4 0.91 11 1.06 0.53*1.90<br />
28 Mechanics 9 2.08 24 0.95 [0.11] 0.00 3 0.41 49 1.13 85 1.06 0.85*1.31<br />
29 Plumbers [0.04] 0.00 [0.08] 0.00 [0.06] 0.00 [0.09] 0.00 [0.27] 0.00 0.00*13.45<br />
30 Welders 5 2.04 [0.02] 0.00 [0.70] 0.00 3 1.51 8 1.55 0.67*3.06<br />
31 Electrical workers 13 2.13 27 1.26 [0.09] 0.00 11 1.36 24 0.98 75 1.24 0.98*1.56<br />
32 Wood workers 6 3.00 32 0.82 [0.18] 0.00 4 1.47 11 1.44 53 1.03 0.77*1.34<br />
33 Painters [0.08] 0.00 5 0.96 [0.06] 0.00 1 1.71 [1.96] 0.00 6 0.76 0.28*1.66<br />
34 ‘‘Other construction workers’’ [0.06] 0.00 13 0.97 [0.04] 0.00 [0.25] 0.00 1 3.12 14 1.00 0.54*1.67<br />
35 Bricklayers [0.01] 0.00 [0.53] 0.00 [0.01] 0.00 [0.01] 0.00 [0.57] 0.00 0.00*6.46<br />
36 Printers 3 1.30 20 0.82 [0.92] 0.00 4 0.56 12 0.68 39 0.75 0.53*1.02<br />
37 Chemical process workers 3 0.84 5 0.46 [0.32] 0.00 6 0.98 12 0.91 26 0.77 0.50*1.12<br />
38 Food workers 21 1.20 49 0.92 15 0.71 39 1.07 40 1.09 164 0.99 0.85*1.16<br />
39 Beverage workers 1 0.60 3 1.08 [0.04] 0.00 [0.35] 0.00 1 0.44 5 0.70 0.23*1.64<br />
40 Tobacco workers 2 0.86 3 1.92 [1.33] 0.00 1 0.66 6 0.89 0.33*1.94<br />
41 Glass makers etc 4 0.93 37 0.90 1 1.69 19 1.44 39 1.11 100 1.06 0.87*1.29<br />
42 Packers 1 0.82 69 0.98 1 0.56 21 0.70 58 1.12 150 0.96 0.82*1.13<br />
43 Engine operators [0.04] 0.00 13 1.04 [0.04] 0.00 [0.57] 0.00 2 0.48 15 0.87 0.48*1.43<br />
44 Public safety workers [0.14] 0.00 4 1.11 [0.38] 0.00 3 0.84 3 0.47 10 0.71 0.34*1.30<br />
45 Cooks <strong>and</strong> stewards [0.05] 0.00 103 1.19 5 0.77 38 0.96 63 0.88 209 1.02 0.89*1.17<br />
46 Domestic assistants 28 1.02 108 0.97 3 1.80 97 0.92 219 0.96 455 0.96 0.87*1.05<br />
47 Waiters 3 0.64 68 0.87 [0.92] 0.00 39 0.83 78 1.06 188 0.92 0.80*1.06<br />
48 Building caretakers 71 0.89 291 1.08 12 0.90 218 1.11 235 1.13 827 1.08 1.01*1.15<br />
49 Chimney sweeps [0.01] 0.00 [0.13] 0.00 [0.02] 0.00 [0.01] 0.00 [0.17] 0.00 0.00*22.00<br />
50 Hairdressers 4 0.79 26 0.82 2 1.54 7 0.53 21 0.59 60 0.69 0.53*0.89<br />
51 Launderers 9 1.01 19 1.03 [1.81] 0.00 8 0.50 26 0.71 62 0.76 0.58*0.97<br />
52 Military personnel [0.05] 0.00 [0.51] 0.00 [0.08] 0.00 [0.23] 0.00 [0.86] 0.00 0.00*4.28<br />
53 ‘‘Other workers’’ 29 1.28 83 0.89 23 1.46 93 0.88 96 1.01 324 0.97 0.87*1.08<br />
54 Economically inactive 646 1.04 1 530 1.02 51 0.97 1 357 1.03 3 919 1.03 7 503 1.02 1.00*1.05<br />
1 54 All categories 1 194 1.00 5 082 1.00 232 1.00 3 189 1.00 7 064 1.00 16 761 1.00 Ref.<br />
Obs observed number of cases; SIR st<strong>and</strong>ardised incidence ratio; 95% CI 95% confidence interval.
Acta Oncol Downloaded from informahealthcare.com by 212.35.100.66 on 04/06/11<br />
For personal use only.<br />
Changes in diagnostic activity may at least partly<br />
explain the observed changes in the incidence of<br />
thyroid <strong>cancer</strong> in Icel<strong>and</strong>.<br />
Cancers of other endocrine gl<strong>and</strong>s<br />
Cancers of endocrine gl<strong>and</strong>s other than the thyroid<br />
gl<strong>and</strong> are so rare that they have hardly ever been<br />
included in epidemiological studies or even routine<br />
tabulations as separate entities. Therefore, there<br />
is no published information about the time trends<br />
of these <strong>cancer</strong>s in the Nordic countries. We do<br />
not publish tables on SIRs for each combination<br />
of gender, country <strong>and</strong> occupation as we do for<br />
more common <strong>cancer</strong>s, because the majority of<br />
the strata would show zero number of cases. Those<br />
who want to check the exact numbers of <strong>cancer</strong><br />
related to a given occupational category are advised<br />
to have a look at the appendix tables on the internet<br />
(http://astra.<strong>cancer</strong>.fi/NOCCA/Incidence/endo<br />
crine-gl<strong>and</strong>s)<br />
Gl<strong>and</strong>ula suprarenalis. There were 1 764 incident<br />
cases of <strong>cancer</strong> of the suprarenal gl<strong>and</strong> included in<br />
the study. Among men, the incidence was significantly<br />
elevated among smelting workers (SIR 1.85,<br />
95% CI 1.18 2.75), packers (1.72, 1.20 2.39),<br />
engine operators (1.55, 1.05 2.19) <strong>and</strong> woodworkers<br />
(1.33, 1.03 1.69). Male farmers had a deficit<br />
risk (0.77, 0.61 0.95). Shoe <strong>and</strong> leather workers had<br />
an excess risk among women (3.38, 1.36 6.96)<br />
based on seven cases, <strong>and</strong> building caretakers had<br />
an SIR of 1.42 (1.07 1.83), based on 58 cases.<br />
Female sales agents had a low risk (0.23, 0.03 0.84).<br />
Gl<strong>and</strong>ula parathyrioeda. Only 159 incident cases of<br />
parathyroid <strong>cancer</strong> were included in the study, 41 in<br />
men <strong>and</strong> 118 in women. There were no statistically<br />
significant excess or deficit risks.<br />
Thymus. In total, 680 incident cases of thymus<br />
<strong>cancer</strong> were included in the study. Men in the<br />
occupational category including glass makers <strong>and</strong><br />
several other similar occupations, had an excess risk<br />
(SIR 2.23, 95% CI 1.07 4.10), <strong>and</strong> mechanics had a<br />
deficit risk, SIR 0.60 (95%CI 0.34 0.99). No<br />
significant variation in risk was found across the<br />
occupational categories of women.<br />
Hypophysis. There were 216 cases of <strong>cancer</strong> of the<br />
hypophysis. Beverage workers had an SIR of 16.60<br />
(95% CI 2.01 59.95), however based on only two<br />
cases, <strong>and</strong> sales agents an SIR of 2.31 (1.11 4.25),<br />
<strong>Occupation</strong> <strong>and</strong> <strong>cancer</strong> in Nordic countries 743<br />
based on ten cases. There were no significant SIRs<br />
among women.<br />
Corpus pineale. Only a total of 48 incident cases of<br />
corpus pineale were included in the present study.<br />
Swedish <strong>and</strong> Danish observations were missing, <strong>and</strong><br />
there were no cases diagnosed in Finl<strong>and</strong>. The only<br />
significant excess risk, SIR of 5.48 (1.13-16-01)<br />
among ‘‘other construction workers’’ is based on<br />
three cases <strong>and</strong> must be interpreted as a chance find.<br />
Comment. We could not identify studies indicating<br />
environmental or occupational causes of any of these<br />
rare tumours in the literature. Hence, all observations<br />
made in our data set should be interpreted as<br />
suggestive or chance findings to be confirmed or<br />
rejected on the basis of cumulative information from<br />
other parts of the world.<br />
Bone <strong>cancer</strong><br />
Bone <strong>cancer</strong> is rare, <strong>and</strong> the disease has been on the<br />
decrease for both men <strong>and</strong> women in the Nordic<br />
countries (Figure 43), possibly due to improving<br />
means of separating bone metastases from primary<br />
bone <strong>cancer</strong>s. It is now between about 1 per 100 000<br />
in men <strong>and</strong> one-third less in women.<br />
‘‘Other health workers’’ had an excess risk of<br />
bone <strong>cancer</strong> in men (SIR 2.25, 95%CI 1.29 3.66).<br />
Seamen, military personnel <strong>and</strong> public safety workers<br />
were also at excess risk (Table 64). The only<br />
category with a significantly decreased SIR was<br />
‘‘other workers’’ (SIR 0.75, 0.56 0.99). There were<br />
no significant SIRs in women, except the one based<br />
on zero observed cases among woodworkers (95%<br />
CI 0.00 0.90; Table 65).<br />
About every second one of the bone <strong>cancer</strong>s<br />
in the present study series was of chondrosarcoma<br />
type (http://astra.<strong>cancer</strong>.fi/NOCCA/Incidence/bonechondrosarcoma).<br />
Men in ‘‘other health work’’<br />
had an an excess SIR of chondrosarcoma (2.97,<br />
1.28 5.85), <strong>and</strong> the SIR was also elevated among<br />
military workers (2.88, 1.68 4.61), seamen (1.92,<br />
1.05 3.22) <strong>and</strong> drivers (1.45, 1.09 1.88). In<br />
women, the only significant finding was among<br />
technical etc. workers (2.60, 1.12 5.12); this finding<br />
was dominated by the high SIR in Sweden.<br />
Comment. Previous studies have indicated that the<br />
main environmental factors for bone <strong>cancer</strong> are<br />
ionising radiation <strong>and</strong> chemotherapy. Radium dial<br />
painters exposed to radium 226, 228, <strong>and</strong> occupational<br />
<strong>and</strong> environmental exposure to plutonium in<br />
<strong>and</strong> around nuclear weapons factories had an
Acta Oncol Downloaded from informahealthcare.com by 212.35.100.66 on 04/06/11<br />
For personal use only.<br />
744 E. Pukkala et al.<br />
/ 100 000<br />
3<br />
2<br />
1<br />
0<br />
Men<br />
Denmark<br />
Finl<strong>and</strong><br />
Icel<strong>and</strong><br />
Norway<br />
Sweden<br />
1945 1960 1975 1990 2005<br />
increased risk [133]. Exposure to ionising radiation<br />
<strong>and</strong> other physical agents such as gamma rays,<br />
neutrons <strong>and</strong> radon gas can be observed in radiologists,<br />
technologists, nuclear workers, underground<br />
miners, plutonium workers, clean-up workers following<br />
nuclear accidents <strong>and</strong> aircraft crew. In the<br />
present study we found an excess risk of osteosarcoma<br />
among health care workers, military workers<br />
<strong>and</strong> seamen. It would deserve further investigation<br />
to establish if these are associated with radiation<br />
exposure.<br />
Soft tissue <strong>cancer</strong><br />
There has been a slight increase in the incidence of<br />
<strong>cancer</strong> of the soft tissue during the latest decades,<br />
but rates are still very low <strong>and</strong> similar (incidence<br />
around 2 per 100 000) in both genders <strong>and</strong> all<br />
Nordic countries (Figure 44).<br />
Among men, the only occupational categories<br />
with significantly elevated SIRs in the combined<br />
/ 100 000<br />
3<br />
2<br />
1<br />
0<br />
Women<br />
Denmark<br />
Finl<strong>and</strong><br />
Icel<strong>and</strong><br />
Norway<br />
Sweden<br />
1945 1960 1975 1990 2005<br />
Figure 43. Age st<strong>and</strong>ardised (World) incidence rates for bone <strong>cancer</strong> 1943 2005, by country <strong>and</strong> gender. Modified from NORDCAN [49].<br />
/ 100 000<br />
3<br />
2<br />
1<br />
0<br />
Denmark<br />
Finl<strong>and</strong><br />
Icel<strong>and</strong><br />
Norway<br />
Sweden<br />
Men<br />
1945 1960 1975 1990 2005<br />
/ 100 000<br />
Nordic data were building caretakers (SIR 1.30,<br />
95% CI 1.08 1.56) <strong>and</strong> military personnel (1.27,<br />
1,01 1.59), but there were significant single-country<br />
excesses among Norwegian welders, Danish men<br />
in the category of ‘‘religious workers etc.’’, Finnish<br />
gardeners <strong>and</strong> Swedish public safety workers<br />
(Table 66). Fishermen <strong>and</strong> packers had SIRs<br />
significantly below 1.0. No occupational category<br />
was either at an excess risk or a deficit risk among<br />
women (Table 67).<br />
The data set included 1328 cases in the subgroup<br />
of fibrosarcoma (http://astra.<strong>cancer</strong>.fi/NOCCA/Inci<br />
dence/soft-tissue-fibrosarcoma) in men <strong>and</strong> 1 174 in<br />
women from Finl<strong>and</strong>, Icel<strong>and</strong>, Norway <strong>and</strong> Sweden.<br />
The only significant excess in men was among<br />
building caretakers (1.71, 1.12 2.50) <strong>and</strong> in women<br />
among sales agents (1.62, 1.01 2.45).<br />
The only significant four-country SIR based on<br />
the 1 326 cases of liposarcoma (http://astra.<strong>cancer</strong>.fi/<br />
NOCCA/Incidence/soft-tissue-liposarcoma) in men<br />
3<br />
2<br />
1<br />
0<br />
Denmark<br />
Finl<strong>and</strong><br />
Icel<strong>and</strong><br />
Norway<br />
Sweden<br />
Women<br />
1945 1960 1975 1990 2005<br />
Figure 44. Age st<strong>and</strong>ardised (World) incidence rates for soft tissue <strong>cancer</strong> 1943 2005, by country <strong>and</strong> gender. Modified from NORDCAN<br />
[49].
Acta Oncol Downloaded from informahealthcare.com by 212.35.100.66 on 04/06/11<br />
For personal use only.<br />
Table 64. Observed number of bone <strong>cancer</strong> among men in the Nordic countries <strong>and</strong> st<strong>and</strong>ardised incidence ratios 1961 2005, by country<br />
<strong>and</strong> occupational category.<br />
Denmark Finl<strong>and</strong> Icel<strong>and</strong> Norway Sweden Total<br />
No <strong>Occupation</strong>al category Obs SIR Obs SIR Obs SIR Obs SIR Obs SIR Obs SIR 95% CI<br />
1 Technical workers, etc 16 0.99 24 0.86 1 1.83 9 0.55 109 1.20 159 1.05 0.90*1.22<br />
2 Laboratory assistants [0.32] 0.00 [0.73] 0.00 [0.10] 0.00 3 4.02 [0.63] 0.00 3 1.19 0.24*3.47<br />
3 Physicians 1 0.77 1 0.61 [0.18] 0.00 2 1.02 8 1.80 12 1.26 0.65*2.21<br />
4 Dentists [0.39] 0.00 [0.33] 0.00 [0.05] 0.00 1 1.14 [1.99] 0.00 1 0.27 0.01*1.53<br />
5 Nurses [0.02] 0.00 [0.13] 0.00 [0.00] 0.00 [0.13] 0.00 [0.48] 0.00 [0.76] 0.00 0.00*4.88<br />
6 Assistant nurses 1 2.55 [0.13] 0.00 [0.04] 0.00 [0.32] 0.00 2 1.11 3 1.12 0.23*3.27<br />
7 ‘‘Other health workers’’ 2 1.78 6 4.02 [0.05] 0.00 4 5.17 4 1.09 16 2.25 1.29*3.66<br />
8 Teachers 5 0.70 11 1.02 [0.71] 0.00 13 1.12 22 0.91 51 0.94 0.70*1.23<br />
9 Religious workers etc 1 0.35 7 1.05 [0.45] 0.00 8 1.41 23 1.13 39 1.08 0.77*1.48<br />
10 Artistic workers [0.91] 0.00 2 0.91 1 8.36 1 0.61 3 0.53 7 0.67 0.27*1.37<br />
11 Journalists 1 2.34 3 2.86 [0.07] 0.00 1 1.35 2 0.74 7 1.40 0.56*2.88<br />
12 Administrators 17 0.98 19 1.19 3 3.36 15 0.78 34 1.06 88 1.03 0.83*1.27<br />
13 Clerical workers 11 1.39 11 1.07 3 2.82 15 1.02 37 1.03 77 1.10 0.87*1.38<br />
14 Sales agents 4 0.95 14 0.91 [0.54] 0.00 13 0.78 45 0.84 76 0.84 0.66*1.06<br />
15 Shop workers 18 1.04 7 0.99 [0.43] 0.00 9 1.30 16 0.94 50 1.03 0.76*1.35<br />
16 Farmers 27 0.85 53 0.90 [1.40] 0.00 35 0.85 76 1.01 191 0.91 0.79*1.05<br />
17 Gardeners 4 0.87 11 1.12 [0.04] 0.00 12 1.13 29 0.97 56 1.02 0.77*1.32<br />
18 Fishermen [1.64] 0.00 1 1.22 [1.39] 0.00 19 1.37 5 1.59 25 1.20 0.78*1.77<br />
19 Forestry workers [0.66] 0.00 4 0.34 [0.01] 0.00 7 0.91 25 1.14 36 0.85 0.60*1.18<br />
20 Miners <strong>and</strong> quarry workers 1 4.81 1 0.51 [0.02] 0.00 4 1.69 5 0.86 11 1.06 0.53*1.90<br />
21 Seamen 5 2.67 4 1.53 [0.32] 0.00 18 1.44 10 1.90 37 1.64 1.15*2.26<br />
22 Transport workers 3 0.81 3 0.43 [0.48] 0.00 3 0.49 22 1.28 31 0.90 0.61*1.27<br />
23 Drivers 18 1.42 33 1.31 2 2.37 17 0.94 57 1.26 127 1.24 1.05*1.48<br />
24 Postal workers 3 1.20 5 1.33 [0.09] 0.00 1 0.29 3 0.30 12 0.61 0.32*1.07<br />
25 Textile workers 5 2.34 [2.27] 0.00 1 7.20 5 1.49 9 0.94 20 1.14 0.70*1.77<br />
26 Shoe <strong>and</strong> leather workers [0.51] 0.00 [0.99] 0.00 [0.03] 0.00 [1.41] 0.00 5 1.38 5 0.76 0.25*1.78<br />
27 Smelting workers 6 1.17 4 1.10 [0.23] 0.00 6 1.23 13 0.81 29 0.97 0.65*1.39<br />
28 Mechanics 6 0.44 24 0.94 [0.93] 0.00 25 1.00 86 1.05 141 0.96 0.81*1.13<br />
29 Plumbers 2 1.58 [4.35] 0.00 1 7.26 2 0.67 9 0.97 14 0.78 0.42*1.30<br />
30 Welders 8 1.74 [0.06] 0.00 2 0.58 15 1.33 25 1.29 0.83*1.90<br />
31 Electrical workers 6 1.78 11 0.97 1 1.63 11 0.98 16 0.55 45 0.81 0.59*1.08<br />
32 Wood workers 9 0.98 23 0.96 [0.45] 0.00 25 0.94 46 0.93 103 0.94 0.78*1.14<br />
33 Painters 1 0.33 9 1.66 [0.19] 0.00 9 1.98 19 1.28 38 1.36 0.96*1.86<br />
34 ‘‘Other construction workers’’ 16 1.45 15 0.94 2 1.89 7 1.23 29 1.07 69 1.13 0.88*1.43<br />
35 Bricklayers 1 0.29 2 0.80 1 0.38 4 0.63 8 0.54 0.23*1.06<br />
36 Printers 1 0.45 3 1.08 [0.18] 0.00 5 1.68 5 0.58 14 0.84 0.46*1.40<br />
37 Chemical process workers 2 1.05 3 0.71 [0.07] 0.00 5 0.84 8 0.67 18 0.74 0.44*1.18<br />
38 Food workers 6 0.95 1 0.33 [0.59] 0.00 5 0.73 11 0.90 23 0.79 0.50*1.19<br />
39 Beverage workers 1 1.30 [0.18] 0.00 [0.01] 0.00 [0.11] 0.00 [0.68] 0.00 1 0.57 0.01*3.18<br />
40 Tobacco workers [0.12] 0.00 [0.03] 0.00 [0.00] 0.00 [0.10] 0.00 [0.06] 0.00 [0.31] 0.00 0.00*11.74<br />
41 Glass makers etc 4 1.10 4 0.89 1 8.58 2 0.56 11 0.80 22 0.86 0.54*1.31<br />
42 Packers 2 0.63 10 1.14 1 2.89 8 0.77 29 1.20 50 1.07 0.79*1.41<br />
43 Engine operators 5 1.48 14 1.10 1 1.61 2 0.30 19 0.87 41 0.91 0.65*1.23<br />
44 Public safety workers 3 0.95 9 1.27 1 2.74 9 2.02 20 1.52 42 1.49 1.07*2.01<br />
45 Cooks <strong>and</strong> stewards [0.27] 0.00 [0.54] 0.00 [0.23] 0.00 2 0.91 [2.69] 0.00 2 0.34 0.04*1.22<br />
46 Domestic assistants [0.00] 0.00 [0.02] 0.00 [0.00] 0.00 [0.02] 0.00 [0.36] 0.00 [0.41] 0.00 0.00*8.97<br />
47 Waiters [0.55] 0.00 [0.54] 0.00 [0.03] 0.00 [0.91] 0.00 [1.39] 0.00 [3.41] 0.00 0.00*1.08<br />
48 Building caretakers 1 0.31 7 1.25 [0.11] 0.00 3 1.27 10 1.01 21 0.99 0.61*1.51<br />
49 Chimney sweeps [0.09] 0.00 1 2.36 [0.24] 0.00 [0.74] 0.00 1 0.67 0.02*3.74<br />
50 Hairdressers 4 4.28 [0.13] 0.00 [0.03] 0.00 2 3.02 1 0.42 7 1.70 0.68*3.50<br />
51 Launderers [0.44] 0.00 [0.13] 0.00 [0.01] 0.00 [0.39] 0.00 1 0.59 1 0.38 0.01*2.10<br />
52 Military personnel 2 1.18 4 1.53 6 1.50 13 1.70 25 1.57 1.02*2.32<br />
53 ‘‘Other workers’’ 11 1.07 4 0.58 [1.43] 0.00 23 1.21 12 0.41 50 0.75 0.56*0.99<br />
54 Economically inactive 10 1.05 45 1.23 [1.16] 0.00 13 1.15 53 1.04 121 1.10 0.92*1.32<br />
1 54 All categories 242 1.00 421 1.00 19 1.00 388 1.00 981 1.00 2 051 1.00 Ref.<br />
Obs observed number of cases; SIR st<strong>and</strong>ardised incidence ratio; 95% CI 95% confidence interval.<br />
<strong>Occupation</strong> <strong>and</strong> <strong>cancer</strong> in Nordic countries 745
Acta Oncol Downloaded from informahealthcare.com by 212.35.100.66 on 04/06/11<br />
For personal use only.<br />
746 E. Pukkala et al.<br />
Table 65. Observed number of bone <strong>cancer</strong> among women in the Nordic countries <strong>and</strong> st<strong>and</strong>ardised incidence ratios 1961 2005, by<br />
country <strong>and</strong> occupational category.<br />
Denmark Finl<strong>and</strong> Icel<strong>and</strong> Norway Sweden Total<br />
No <strong>Occupation</strong>al category Obs SIR Obs SIR Obs SIR Obs SIR Obs SIR Obs SIR 95% CI<br />
1 Technical workers, etc 1 1.64 2 0.97 [0.07] 0.00 [0.48] 0.00 7 1.78 10 1.40 0.67*2.57<br />
2 Laboratory assistants [0.47] 0.00 1 0.92 [0.09] 0.00 [0.55] 0.00 [1.38] 0.00 1 0.28 0.01*1.55<br />
3 Physicians 1 4.97 1 1.90 [0.01] 0.00 [0.23] 0.00 [0.97] 0.00 2 1.03 0.12*3.72<br />
4 Dentists [0.18] 0.00 [0.46] 0.00 [0.01] 0.00 [0.19] 0.00 1 1.48 1 0.66 0.02*3.69<br />
5 Nurses 5 1.42 7 1.27 [0.38] 0.00 7 1.59 14 1.21 33 1.30 0.89*1.82<br />
6 Assistant nurses 4 1.52 6 1.13 [0.54] 0.00 2 0.47 15 0.71 27 0.79 0.52*1.16<br />
7 ‘‘Other health workers’’ [2.00] 0.00 1 0.23 [0.12] 0.00 4 0.95 8 1.10 13 0.72 0.39*1.24<br />
8 Teachers 5 1.09 7 0.73 2 2.81 6 0.72 40 1.49 60 1.20 0.91*1.54<br />
9 Religious workers etc [0.60] 0.00 6 1.09 [0.10] 0.00 3 1.49 5 0.53 14 0.79 0.43*1.33<br />
10 Artistic workers [0.30] 0.00 [0.83] 0.00 [0.08] 0.00 [0.60] 0.00 2 1.16 2 0.57 0.07*2.04<br />
11 Journalists [0.07] 0.00 [0.52] 0.00 [0.02] 0.00 [0.17] 0.00 [0.82] 0.00 [1.59] 0.00 0.00*2.31<br />
12 Administrators 1 0.56 1 0.55 [0.05] 0.00 3 1.54 1 0.26 6 0.63 0.23*1.37<br />
13 Clerical workers 20 1.08 36 1.11 3 1.42 31 1.22 48 0.76 138 0.97 0.82*1.15<br />
14 Sales agents [0.16] 0.00 5 1.11 1 5.16 3 0.93 8 0.92 17 1.02 0.59*1.63<br />
15 Shop workers 7 0.58 18 1.12 1 0.81 16 0.81 29 0.82 71 0.84 0.66*1.06<br />
16 Farmers 7 0.83 8 0.83 1 1.28 19 1.55 3 0.84 38 1.10 0.78*1.50<br />
17 Gardeners [1.09] 0.00 18 0.66 [0.03] 0.00 7 0.96 8 0.87 33 0.74 0.51*1.04<br />
18 Fishermen [0.04] 0.00 [0.06] 0.00 1 28.44 [0.10] 0.00 [0.03] 0.00 1 3.60 0.09*20.06<br />
19 Forestry workers [0.01] 0.00 1 8.18 [0.00] 0.00 [0.14] 0.00 [0.21] 0.00 1 2.04 0.05*11.37<br />
20 Miners <strong>and</strong> quarry workers [0.00] 0.00 [0.05] 0.00 [0.00] 0.00 [0.01] 0.00 [0.05] 0.00 [0.11] 0.00 0.00*33.55<br />
21 Seamen [0.02] 0.00 [0.00] 0.00 [0.02] 0.00 [0.01] 0.00 [0.05] 0.00 0.00*73.39<br />
22 Transport workers [0.01] 0.00 1 1.32 [0.03] 0.00 [0.12] 0.00 [0.62] 0.00 1 0.65 0.02*3.61<br />
23 Drivers [0.31] 0.00 [0.40] 0.00 [0.02] 0.00 [0.42] 0.00 [1.64] 0.00 [2.78] 0.00 0.00*1.33<br />
24 Postal workers 3 4.80 5 1.04 1 2.68 7 1.45 9 0.86 25 1.18 0.77*1.75<br />
25 Textile workers 8 1.95 10 0.93 [0.59] 0.00 10 1.44 21 1.07 49 1.16 0.86*1.54<br />
26 Shoe <strong>and</strong> leather workers [0.31] 0.00 [1.32] 0.00 [0.03] 0.00 [0.50] 0.00 1 0.66 1 0.27 0.01*1.52<br />
27 Smelting workers [0.08] 0.00 [0.31] 0.00 [0.00] 0.00 [0.07] 0.00 1 2.10 1 1.08 0.03*6.00<br />
28 Mechanics [0.76] 0.00 [1.47] 0.00 [0.01] 0.00 1 1.54 7 1.48 8 1.05 0.45*2.08<br />
29 Plumbers [0.01] 0.00 [0.00] 0.00 [0.01] 0.00 [0.01] 0.00 [0.02] 0.00 0.00*155.56<br />
30 Welders [0.12] 0.00 [0.00] 0.00 [0.06] 0.00 [0.20] 0.00 [0.38] 0.00 0.00*9.65<br />
31 Electrical workers 3 2.81 [1.03] 0.00 [0.01] 0.00 [0.72] 0.00 3 1.14 6 1.10 0.40*2.39<br />
32 Wood workers [0.35] 0.00 [2.67] 0.00 [0.01] 0.00 [0.24] 0.00 [0.81] 0.00 [4.09] 0.00 0.00*0.90<br />
33 Painters [0.01] 0.00 [0.32] 0.00 [0.00] 0.00 [0.05] 0.00 [0.21] 0.00 [0.60] 0.00 0.00*6.11<br />
34 ‘‘Other construction workers’’ [0.01] 0.00 2 1.92 [0.00] 0.00 [0.02] 0.00 [0.03] 0.00 2 1.81 0.22*6.53<br />
35 Bricklayers [0.00] 0.00 [0.03] 0.00 [0.00] 0.00 [0.00] 0.00 [0.04] 0.00 0.00*98.27<br />
36 Printers [0.39] 0.00 1 0.71 [0.06] 0.00 1 1.57 1 0.52 3 0.68 0.14*1.98<br />
37 Chemical process workers [0.61] 0.00 [0.70] 0.00 [0.02] 0.00 [0.55] 0.00 [1.47] 0.00 [3.36] 0.00 0.00*1.10<br />
38 Food workers 5 1.68 5 1.41 1 0.68 4 1.18 4 0.94 19 1.22 0.73*1.90<br />
39 Beverage workers 1 3.56 [0.20] 0.00 [0.00] 0.00 [0.03] 0.00 [0.27] 0.00 1 1.28 0.03*7.14<br />
40 Tobacco workers 1 2.56 [0.11] 0.00 [0.12] 0.00 [0.17] 0.00 1 1.25 0.03*6.99<br />
41 Glass makers etc [0.74] 0.00 3 1.18 [0.04] 0.00 2 1.66 3 0.76 8 0.94 0.41*1.86<br />
42 Packers [0.21] 0.00 10 2.24 [0.12] 0.00 2 0.72 2 0.34 14 1.04 0.57*1.75<br />
43 Engine operators [0.01] 0.00 [0.74] 0.00 [0.00] 0.00 [0.05] 0.00 [0.44] 0.00 [1.24] 0.00 0.00*2.97<br />
44 Public safety workers [0.02] 0.00 [0.19] 0.00 [0.03] 0.00 [0.33] 0.00 [0.61] 0.00 [1.17] 0.00 0.00*3.15<br />
45 Cooks <strong>and</strong> stewards [0.01] 0.00 6 1.15 1 2.14 1 0.27 9 1.09 17 0.96 0.56*1.54<br />
46 Domestic assistants 3 0.66 8 1.35 1 8.17 6 0.60 24 0.97 42 0.93 0.67*1.25<br />
47 Waiters [0.81] 0.00 4 0.90 [0.06] 0.00 4 0.93 9 1.07 17 0.94 0.55*1.51<br />
48 Building caretakers 10 0.76 14 0.80 2 2.11 22 1.21 23 0.97 71 0.97 0.76*1.22<br />
49 Chimney sweeps [0.00] 0.00 [0.01] 0.00 [0.00] 0.00 [0.00] 0.00 [0.01] 0.00 0.00*295.10<br />
50 Hairdressers [0.83] 0.00 2 1.15 [0.08] 0.00 [1.15] 0.00 7 1.81 9 1.17 0.54*2.23<br />
51 Launderers 2 1.36 2 1.49 [0.13] 0.00 3 2.00 4 0.93 11 1.26 0.63*2.25<br />
52 Military personnel [0.01] 0.00 [0.02] 0.00 [0.01] 0.00 [0.02] 0.00 [0.06] 0.00 0.00*64.94<br />
53 ‘‘Other workers’’ 4 1.06 9 1.62 1 0.90 9 0.94 16 1.51 39 1.27 0.91*1.74<br />
54 Economically inactive 101 1.04 119 1.07 [3.67] 0.00 114 0.96 471 1.05 805 1.03 0.96*1.11<br />
1 54 All categories 192 1.00 319 1.00 16 1.00 287 1.00 804 1.00 1 618 1.00 Ref.<br />
Obs observed number of cases; SIR st<strong>and</strong>ardised incidence ratio; 95% CI 95% confidence interval.
Acta Oncol Downloaded from informahealthcare.com by 212.35.100.66 on 04/06/11<br />
For personal use only.<br />
Table 66. Observed number of soft tissue <strong>cancer</strong> among men in the Nordic countries <strong>and</strong> st<strong>and</strong>ardised incidence ratios 1961 2005, by<br />
country <strong>and</strong> occupational category.<br />
Denmark Finl<strong>and</strong> Icel<strong>and</strong> Norway Sweden Total<br />
No <strong>Occupation</strong>al category Obs SIR Obs SIR Obs SIR Obs SIR Obs SIR Obs SIR 95% CI<br />
1 Technical workers, etc 60 1.04 94 0.97 [0.99] 0.00 45 1.04 436 1.04 635 1.03 0.95*1.11<br />
2 Laboratory assistants 2 1.78 3 1.22 1 4.52 1 0.48 1 0.42 8 0.97 0.42*1.90<br />
3 Physicians 4 0.85 4 0.71 [0.38] 0.00 6 1.05 21 1.06 35 0.97 0.67*1.35<br />
4 Dentists [1.40] 0.00 2 1.72 [0.09] 0.00 2 0.79 13 1.39 17 1.17 0.68*1.88<br />
5 Nurses [0.07] 0.00 2 4.79 [0.01] 0.00 [0.29] 0.00 2 1.22 4 1.65 0.45*4.23<br />
6 Assistant nurses 1 0.73 [0.40] 0.00 [0.10] 0.00 2 2.05 5 0.67 8 0.77 0.33*1.52<br />
7 ‘‘Other health workers’’ 5 1.24 4 0.76 [0.11] 0.00 1 0.44 17 1.03 27 0.96 0.63*1.40<br />
8 Teachers 25 0.98 45 1.16 2 1.38 37 1.16 111 1.01 220 1.06 0.93*1.21<br />
9 Religious workers etc 18 1.73 27 1.19 1 1.12 22 1.34 84 0.95 152 1.09 0.93*1.28<br />
10 Artistic workers 2 0.62 3 0.39 [0.26] 0.00 7 1.48 30 1.17 42 1.01 0.73*1.37<br />
11 Journalists 2 1.31 2 0.54 [0.15] 0.00 1 0.48 18 1.49 23 1.18 0.75*1.77<br />
12 Administrators 66 1.04 70 1.23 1 0.52 59 1.04 164 1.06 360 1.08 0.97*1.19<br />
13 Clerical workers 27 0.97 28 0.76 1 0.41 47 1.10 182 1.08 285 1.02 0.91*1.15<br />
14 Sales agents 16 1.09 56 1.03 [1.18] 0.00 56 1.12 244 0.98 372 1.01 0.91*1.12<br />
15 Shop workers 62 0.98 26 1.07 [1.01] 0.00 14 0.72 85 1.07 187 1.00 0.87*1.15<br />
16 Farmers 111 0.91 208 0.90 5 1.52 127 0.92 385 0.98 836 0.94 0.88*1.01<br />
17 Gardeners 21 1.23 49 1.36 [0.11] 0.00 28 0.83 138 0.93 236 1.00 0.88*1.14<br />
18 Fishermen 4 0.69 3 0.96 2 0.65 32 0.73 11 0.70 52 0.72 0.54*0.95<br />
19 Forestry workers 3 1.21 29 0.69 [0.03] 0.00 24 0.95 97 0.90 153 0.86 0.73*1.01<br />
20 Miners <strong>and</strong> quarry workers 1 1.33 4 0.58 [0.05] 0.00 8 1.11 26 0.96 39 0.93 0.66*1.27<br />
21 Seamen 8 1.26 14 1.50 1 1.45 27 0.75 28 1.15 78 1.02 0.80*1.27<br />
22 Transport workers 18 1.33 21 0.81 2 1.88 26 1.41 72 0.87 139 0.98 0.83*1.15<br />
23 Drivers 36 0.81 81 0.91 3 1.60 49 0.93 213 1.03 382 0.97 0.88*1.07<br />
24 Postal workers 14 1.58 12 0.89 [0.20] 0.00 7 0.69 54 1.18 87 1.11 0.89*1.37<br />
25 Textile workers 7 0.91 8 0.95 1 2.82 11 1.03 49 1.03 76 1.02 0.80*1.27<br />
26 Shoe <strong>and</strong> leather workers [1.88] 0.00 1 0.27 [0.07] 0.00 3 0.65 21 1.14 25 0.87 0.57*1.29<br />
27 Smelting workers 16 0.91 9 0.69 [0.56] 0.00 17 1.14 91 1.19 133 1.08 0.91*1.29<br />
28 Mechanics 45 0.95 87 0.97 [2.12] 0.00 69 0.96 367 0.98 568 0.97 0.89*1.05<br />
29 Plumbers 8 1.88 16 1.06 [0.30] 0.00 7 0.83 48 1.12 79 1.11 0.88*1.39<br />
30 Welders 16 1.04 [0.15] 0.00 19 2.03 43 0.86 78 1.04 0.82*1.30<br />
31 Electrical workers 10 0.88 45 1.14 2 1.49 36 1.13 138 1.05 231 1.07 0.94*1.22<br />
32 Wood workers 31 0.95 94 1.07 1 0.94 90 1.10 187 0.78 403 0.91 0.82*1.00<br />
33 Painters 6 0.56 19 0.98 1 2.32 12 0.85 78 1.11 116 1.01 0.84*1.21<br />
34 ‘‘Other construction workers’’ 30 0.75 69 1.20 3 1.29 12 0.72 121 0.94 235 0.96 0.84*1.09<br />
35 Bricklayers 13 1.10 11 1.20 13 1.57 34 1.10 71 1.18 0.92*1.49<br />
36 Printers 9 1.18 8 0.84 [0.36] 0.00 6 0.70 50 1.28 73 1.12 0.88*1.41<br />
37 Chemical process workers 6 0.88 11 0.74 [0.18] 0.00 24 1.28 49 0.85 90 0.92 0.74*1.13<br />
38 Food workers 20 0.89 10 0.92 1 0.62 23 1.08 64 1.08 118 1.03 0.86*1.23<br />
39 Beverage workers 3 1.14 2 2.94 [0.03] 0.00 [0.24] 0.00 3 0.92 8 1.17 0.51*2.31<br />
40 Tobacco workers 2 4.68 [0.12] 0.00 [0.00] 0.00 [0.33] 0.00 [0.27] 0.00 2 1.73 0.21*6.23<br />
41 Glass makers etc 15 1.15 16 1.02 [0.30] 0.00 8 0.77 55 0.85 94 0.90 0.73*1.11<br />
42 Packers 8 0.70 31 0.99 4 4.26 26 0.81 88 0.77 157 0.82 0.70*0.96<br />
43 Engine operators 12 1.00 46 1.03 2 1.45 14 0.76 103 1.03 177 1.00 0.87*1.16<br />
44 Public safety workers 12 1.08 27 1.08 1 1.24 11 0.81 79 1.32 130 1.18 0.99*1.40<br />
45 Cooks <strong>and</strong> stewards 1 1.14 1 0.55 [0.49] 0.00 9 1.47 11 0.96 22 1.06 0.66*1.60<br />
46 Domestic assistants [0.01] 0.00 [0.10] 0.00 [0.00] 0.00 [0.05] 0.00 2 1.47 2 1.32 0.16*4.76<br />
47 Waiters 3 1.69 1 0.55 [0.06] 0.00 3 1.13 8 1.38 15 1.24 0.69*2.04<br />
48 Building caretakers 19 1.64 22 1.08 [0.29] 0.00 7 0.99 63 1.36 111 1.30 1.08*1.56<br />
49 Chimney sweeps [0.31] 0.00 3 2.00 [0.72] 0.00 1 0.30 4 0.68 0.19*1.74<br />
50 Hairdressers 3 0.90 [0.44] 0.00 [0.06] 0.00 1 0.49 15 1.31 19 1.10 0.66*1.72<br />
51 Launderers 2 1.23 1 2.20 1 35.63 [1.22] 0.00 8 0.98 12 1.04 0.54*1.82<br />
52 Military personnel 9 1.48 11 1.23 16 1.46 42 1.19 78 1.27 1.01*1.59<br />
53 ‘‘Other workers’’ 39 1.10 30 1.23 2 0.59 73 1.20 138 0.99 282 1.07 0.95*1.20<br />
54 Economically inactive 32 1.00 130 1.04 5 1.82 30 0.90 214 0.96 411 0.99 0.90*1.09<br />
1 54 All categories 867 1.00 1 512 1.00 43 1.00 1 168 1.00 4 607 1.00 8 197 1.00 Ref.<br />
Obs observed number of cases; SIR st<strong>and</strong>ardised incidence ratio; 95% CI 95% confidence interval.<br />
<strong>Occupation</strong> <strong>and</strong> <strong>cancer</strong> in Nordic countries 747
Acta Oncol Downloaded from informahealthcare.com by 212.35.100.66 on 04/06/11<br />
For personal use only.<br />
748 E. Pukkala et al.<br />
Table 67. Observed number of soft tissue <strong>cancer</strong> among women in the Nordic countries <strong>and</strong> st<strong>and</strong>ardised incidence ratios 1961 2005, by<br />
country <strong>and</strong> occupational category.<br />
Denmark Finl<strong>and</strong> Icel<strong>and</strong> Norway Sweden Total<br />
No <strong>Occupation</strong>al category Obs SIR Obs SIR Obs SIR Obs SIR Obs SIR Obs SIR 95% CI<br />
1 Technical workers, etc 4 1.71 7 0.71 [0.11] 0.00 2 1.40 13 0.66 26 0.78 0.51*1.14<br />
2 Laboratory assistants 1 0.57 7 1.31 1 6.20 1 0.58 8 1.28 18 1.18 0.70*1.86<br />
3 Physicians 1 1.29 4 1.61 [0.02] 0.00 [0.74] 0.00 6 1.28 11 1.26 0.63*2.26<br />
4 Dentists 2 2.92 3 1.27 [0.01] 0.00 1 1.62 3 0.88 9 1.27 0.58*2.42<br />
5 Nurses 11 0.81 26 0.95 [0.69] 0.00 9 0.68 52 0.90 98 0.87 0.71*1.06<br />
6 Assistant nurses 10 0.99 22 0.83 1 1.11 11 0.87 97 0.94 141 0.92 0.78*1.08<br />
7 ‘‘Other health workers’’ 6 0.77 29 1.35 [0.21] 0.00 12 0.92 33 0.94 80 1.03 0.81*1.28<br />
8 Teachers 15 0.85 57 1.19 2 1.57 23 0.89 129 1.00 226 1.02 0.89*1.16<br />
9 Religious workers etc 4 1.71 24 0.92 [0.18] 0.00 6 0.95 52 1.13 86 1.06 0.85*1.31<br />
10 Artistic workers [1.17] 0.00 3 0.74 [0.14] 0.00 3 1.55 7 0.82 13 0.82 0.44*1.41<br />
11 Journalists 1 3.84 3 1.18 [0.04] 0.00 1 1.95 4 1.00 9 1.23 0.56*2.33<br />
12 Administrators 6 0.86 5 0.58 [0.10] 0.00 9 1.42 21 1.09 41 0.99 0.71*1.35<br />
13 Clerical workers 87 1.23 146 0.92 1 0.28 91 1.14 311 0.99 636 1.01 0.94*1.10<br />
14 Sales agents [0.63] 0.00 30 1.36 [0.37] 0.00 15 1.30 48 1.10 93 1.18 0.96*1.45<br />
15 Shop workers 42 0.90 70 0.87 1 0.45 61 0.95 168 0.91 342 0.91 0.81*1.01<br />
16 Farmers 27 0.81 60 1.30 [1.49] 0.00 33 0.74 16 0.92 136 0.95 0.81*1.13<br />
17 Gardeners 9 2.12 145 1.08 [0.05] 0.00 16 0.61 52 1.10 222 1.05 0.92*1.19<br />
18 Fishermen [0.17] 0.00 [0.31] 0.00 [0.06] 0.00 1 3.09 [0.16] 0.00 1 0.97 0.02*5.42<br />
19 Forestry workers [0.04] 0.00 [0.61] 0.00 [0.01] 0.00 1 2.18 1 0.94 2 0.92 0.11*3.31<br />
20 Miners <strong>and</strong> quarry workers [0.00] 0.00 [0.24] 0.00 [0.00] 0.00 [0.03] 0.00 [0.26] 0.00 [0.53] 0.00 0.00*6.96<br />
21 Seamen [0.09] 0.00 [0.00] 0.00 [0.08] 0.00 [0.04] 0.00 [0.20] 0.00 0.00*18.31<br />
22 Transport workers [0.05] 0.00 2 0.54 [0.06] 0.00 [0.38] 0.00 5 1.55 7 0.94 0.38*1.94<br />
23 Drivers [1.19] 0.00 3 1.54 [0.03] 0.00 [1.32] 0.00 7 0.90 10 0.81 0.39*1.50<br />
24 Postal workers 2 0.81 27 1.14 1 1.41 12 0.77 65 1.22 107 1.12 0.92*1.35<br />
25 Textile workers 12 0.77 57 1.08 2 1.74 27 1.07 120 1.14 218 1.09 0.96*1.25<br />
26 Shoe <strong>and</strong> leather workers [1.17] 0.00 5 0.77 1 15.67 2 1.11 11 1.36 19 1.08 0.65*1.68<br />
27 Smelting workers [0.28] 0.00 3 1.97 [0.00] 0.00 [0.19] 0.00 1 0.43 4 0.92 0.25*2.36<br />
28 Mechanics 1 0.35 6 0.84 [0.02] 0.00 4 1.86 25 1.06 36 1.01 0.71*1.40<br />
29 Plumbers [0.02] 0.00 [0.02] 0.00 [0.01] 0.00 [0.04] 0.00 [0.10] 0.00 0.00*37.88<br />
30 Welders 1 1.71 [0.00] 0.00 [0.16] 0.00 1 1.04 2 1.17 0.14*4.24<br />
31 Electrical workers 2 0.50 8 1.61 [0.01] 0.00 2 0.87 16 1.21 28 1.14 0.76*1.65<br />
32 Wood workers [1.32] 0.00 16 1.21 [0.02] 0.00 1 1.37 1 0.25 18 0.94 0.55*1.48<br />
33 Painters [0.05] 0.00 4 2.49 [0.01] 0.00 1 6.02 2 1.89 7 2.42 0.97*4.99<br />
34 ‘‘Other construction workers’’ [0.04] 0.00 4 0.78 [0.00] 0.00 [0.07] 0.00 [0.15] 0.00 4 0.74 0.20*1.91<br />
35 Bricklayers [0.01] 0.00 [0.18] 0.00 [0.00] 0.00 [0.00] 0.00 [0.20] 0.00 0.00*18.83<br />
36 Printers 1 0.68 6 0.87 [0.11] 0.00 [2.16] 0.00 10 1.03 17 0.83 0.49*1.33<br />
37 Chemical process workers 3 1.31 8 2.34 [0.04] 0.00 4 2.11 7 0.92 22 1.44 0.90*2.18<br />
38 Food workers 6 0.53 13 0.73 6 2.28 9 0.76 21 0.95 55 0.84 0.63*1.09<br />
39 Beverage workers 1 0.95 3 3.07 [0.01] 0.00 [0.10] 0.00 2 1.44 6 1.71 0.63*3.71<br />
40 Tobacco workers [1.46] 0.00 [0.55] 0.00 [0.45] 0.00 1 1.13 1 0.30 0.01*1.66<br />
41 Glass makers etc 2 0.71 11 0.87 [0.08] 0.00 2 0.50 28 1.38 43 1.08 0.78*1.45<br />
42 Packers [0.80] 0.00 22 0.99 [0.23] 0.00 7 0.74 32 1.06 61 0.97 0.74*1.25<br />
43 Engine operators [0.03] 0.00 6 1.64 [0.00] 0.00 [0.13] 0.00 1 0.48 7 1.19 0.48*2.45<br />
44 Public safety workers [0.08] 0.00 2 2.21 [0.05] 0.00 2 1.81 5 1.68 9 1.76 0.80*3.34<br />
45 Cooks <strong>and</strong> stewards [0.03] 0.00 33 1.30 [0.89] 0.00 10 0.73 38 0.88 81 0.97 0.77*1.21<br />
46 Domestic assistants 16 0.91 19 0.68 [0.24] 0.00 38 1.09 110 0.90 183 0.90 0.78*1.04<br />
47 Waiters 2 0.66 12 0.55 [0.11] 0.00 15 1.04 56 1.25 85 1.01 0.81*1.25<br />
48 Building caretakers 46 0.91 80 0.94 2 1.10 64 1.07 107 0.90 299 0.95 0.85*1.06<br />
49 Chimney sweeps [0.00] 0.00 [0.04] 0.00 [0.01] 0.00 [0.00] 0.00 [0.06] 0.00 0.00*62.81<br />
50 Hairdressers 2 0.64 11 1.31 [0.13] 0.00 2 0.51 25 1.26 40 1.13 0.81*1.54<br />
51 Launderers 4 0.71 3 0.45 1 3.92 3 0.56 23 1.00 34 0.83 0.58*1.16<br />
52 Military personnel [0.03] 0.00 [0.10] 0.00 [0.02] 0.00 [0.10] 0.00 [0.24] 0.00 0.00*15.24<br />
53 ‘‘Other workers’’ 16 1.11 17 0.63 2 1.02 28 0.90 54 1.01 117 0.91 0.76*1.09<br />
54 Economically inactive 397 1.06 550 1.00 8 1.19 485 1.06 2 330 1.00 3 770 1.01 0.98*1.05<br />
1 54 All categories 739 1.00 1 573 1.00 29 1.00 1 014 1.00 4 125 1.00 7 480 1.00 Ref.<br />
Obs observed number of cases; SIR st<strong>and</strong>ardised incidence ratio; 95% CI 95% confidence interval.
Acta Oncol Downloaded from informahealthcare.com by 212.35.100.66 on 04/06/11<br />
For personal use only.<br />
was among the public safety workers (1.64, 1.10<br />
2.34), but Swedish artistic workers <strong>and</strong> building<br />
caretakers also had a significant, about twofold,<br />
excess of liposarcoma. In women (1 076 cases) there<br />
were no significant SIRs for liposarcoma in any<br />
occupational category in any country.<br />
Comment. Soft tissue sarcoma is a rare disease of<br />
the mesenchymal tissue other than bone <strong>and</strong><br />
cartilage [134]. Epidemiological studies have suffered<br />
from problems of misclassification of histology,<br />
since the histopathological classification of<br />
this <strong>cancer</strong> in <strong>cancer</strong> registries is often inconsistent<br />
<strong>and</strong> pathologists frequently disagree on histologic<br />
subtypes.<br />
Previous studies have indicated that exposure to<br />
phenoxy herbicides, dioxins, <strong>and</strong> pesticides may<br />
be associated with an increased risk, but these<br />
studies are rather inconsistent [134]. Exposure to<br />
vinyl chloride has been suggested as being associated<br />
with the development of soft tissue sarcoma.<br />
Exposure to radiation as therapy is a well-established<br />
cause of secondary soft tissue sarcoma, while<br />
tobacco use, exogenous hormonal factors <strong>and</strong> diet<br />
have only been inconsistently associated with risk.<br />
Non-Hodgkin lymphoma<br />
Up to the 1990s, the incidence of non-Hodgkin<br />
lymphoma increased in all Nordic countries more<br />
rapidly than that of any other form of <strong>cancer</strong> (Figure<br />
45). After that the increase has stopped [135].<br />
Incidence in men is higher than in women in all<br />
countries, <strong>and</strong> Finl<strong>and</strong> has the highest level.<br />
Variation in the incidence of non-Hodgkin<br />
lymphoma over occupational categories was small<br />
/ 100 000<br />
15<br />
10<br />
5<br />
0<br />
Denmark<br />
Finl<strong>and</strong><br />
Icel<strong>and</strong><br />
Norway<br />
Sweden<br />
Men<br />
1945 1960 1975 1990 2005<br />
/ 100 000<br />
(Tables 68, 69). Male physicians had the highest<br />
significant SIR (1.22, 95% CI 1.08 1.39) <strong>and</strong><br />
forestry workers the lowest one (0.86, 0.80 0.93).<br />
Among women, plumbers had the highest risk<br />
of Non-Hodgkin lymphoma (5.39, 1.11 15.76),<br />
however based on three cases only. Postal workers<br />
had the lowest significant SIR (0.89, 0.81 0.98).<br />
Comment. Known risk factors for non-Hodgkin<br />
lymphoma include immunosuppression, autoimmunity,<br />
HIV infection, <strong>and</strong> some specific viruses,<br />
but they explain only a small fraction of the cases<br />
[136]. Other possible risk associations with food<br />
products, medications, pesticides <strong>and</strong> hair dyes have<br />
been investigated, but the results are inconsistent<br />
[137]. Some carcinogenic substances found in working<br />
places may be associated with the development<br />
of non-Hodgkin lymphoma. These include 2,3,<br />
7,8-Tetrachlorodibenzopara-dioxin (TCDD), nonarsenical<br />
insecticides, Tetrachloroethylene, <strong>and</strong> Trichloroethylene.<br />
These exposures are not easily<br />
identified in the occupational categories used here.<br />
<strong>Occupation</strong>s such as hairdressers or barbers have<br />
also been associated with the development on non-<br />
Hodgkin lymphoma in some studies [87,103]. In the<br />
present study, the SIR among female hairdressers<br />
was 1.00, <strong>and</strong> among male hair dressers 0.99.<br />
An about 20% excess among both male <strong>and</strong> female<br />
physicians might indicate that accurate diagnostics of<br />
non-Hodgkin lymphoma is sometimes challenging.<br />
The rapidly changing classifications also made it<br />
difficult to find subcategories of non-Hodgkin lymphoma<br />
that would have been comparable over<br />
decades <strong>and</strong> countries, although there may well be<br />
work-related factors that are only relevant in some of<br />
the numerous sub-types of non-Hodgkin lymphoma.<br />
15<br />
10<br />
5<br />
0<br />
<strong>Occupation</strong> <strong>and</strong> <strong>cancer</strong> in Nordic countries 749<br />
Denmark<br />
Finl<strong>and</strong><br />
Icel<strong>and</strong><br />
Norway<br />
Sweden<br />
Women<br />
1945 1960 1975 1990 2005<br />
Figure 45. Age st<strong>and</strong>ardised (World) incidence rates for non-Hodgkin lymphoma 1943 2005, by country <strong>and</strong> gender. Modified from<br />
NORDCAN [49].
Acta Oncol Downloaded from informahealthcare.com by 212.35.100.66 on 04/06/11<br />
For personal use only.<br />
750 E. Pukkala et al.<br />
Table 68. Observed number of non-Hodgkin lymphoma among men in the Nordic countries <strong>and</strong> st<strong>and</strong>ardised incidence ratios 1961 2005,<br />
by country <strong>and</strong> occupational category.<br />
Denmark Finl<strong>and</strong> Icel<strong>and</strong> Norway Sweden Total<br />
No <strong>Occupation</strong>al category Obs SIR Obs SIR Obs SIR Obs SIR Obs SIR Obs SIR 95% CI<br />
1 Technical workers, etc 422 1.04 598 1.08 10 1.61 332 1.11 1 958 1.04 3 320 1.05 1.02*1.09<br />
2 Laboratory assistants 5 0.63 12 0.86 1 0.84 12 0.92 6 0.54 36 0.76 0.53*1.05<br />
3 Physicians 40 1.21 36 1.12 4 1.78 47 1.32 107 1.21 234 1.22 1.08*1.39<br />
4 Dentists 11 1.12 7 1.07 1 1.67 15 0.99 36 0.86 70 0.94 0.74*1.19<br />
5 Nurses [0.47] 0.00 3 1.35 [0.03] 0.00 4 1.61 9 1.38 16 1.36 0.78*2.21<br />
6 Assistant nurses 5 0.51 4 1.87 [0.37] 0.00 4 0.72 29 0.92 42 0.85 0.61*1.15<br />
7 ‘‘Other health workers’’ 31 1.09 32 1.07 [0.64] 0.00 13 0.97 62 0.86 138 0.95 0.81*1.13<br />
8 Teachers 187 1.05 248 1.11 17 1.98 207 0.99 518 1.03 1 177 1.05 0.99*1.11<br />
9 Religious workers etc 75 1.03 108 0.84 7 1.24 106 1.05 398 1.02 694 0.99 0.92*1.07<br />
10 Artistic workers 19 0.84 46 1.06 2 1.32 23 0.81 125 1.09 215 1.02 0.89*1.16<br />
11 Journalists 10 0.93 19 0.91 1 1.11 22 1.69 45 0.84 97 0.98 0.79*1.19<br />
12 Administrators 451 1.01 370 1.12 17 1.30 367 1.09 704 1.02 1 909 1.05 1.01*1.10<br />
13 Clerical workers 189 0.96 223 1.06 13 0.85 252 1.01 755 1.00 1 432 1.00 0.95*1.06<br />
14 Sales agents 93 0.89 318 1.03 10 1.31 296 1.07 1 118 1.02 1 835 1.02 0.98*1.07<br />
15 Shop workers 448 1.01 135 0.98 5 0.88 129 1.08 368 1.03 1 085 1.02 0.96*1.08<br />
16 Farmers 770 0.91 1 298 0.98 24 1.11 689 1.06 1 712 1.01 4 493 0.99 0.96*1.02<br />
17 Gardeners 113 0.94 200 0.98 [0.72] 0.00 142 0.83 595 0.92 1 050 0.92 0.86*0.97<br />
18 Fishermen 45 1.09 18 1.02 14 0.89 206 0.95 65 0.95 348 0.97 0.87*1.07<br />
19 Forestry workers 19 1.09 179 0.75 [0.14] 0.00 110 0.92 422 0.90 730 0.86 0.80*0.93<br />
20 Miners <strong>and</strong> quarry workers 4 0.75 52 1.34 [0.25] 0.00 34 0.89 133 1.12 223 1.11 0.97*1.26<br />
21 Seamen 38 0.84 46 0.87 8 2.06 170 0.82 105 0.98 367 0.88 0.80*0.98<br />
22 Transport workers 85 0.88 169 1.11 4 0.58 99 0.97 354 0.95 711 0.98 0.91*1.05<br />
23 Drivers 323 1.02 507 0.99 10 0.91 317 1.05 993 1.08 2 150 1.04 1.00*1.09<br />
24 Postal workers 62 0.99 92 1.20 1 0.77 66 1.22 229 1.15 450 1.14 1.04*1.25<br />
25 Textile workers 45 0.82 48 1.00 2 0.89 60 1.09 212 1.02 367 1.00 0.90*1.11<br />
26 Shoe <strong>and</strong> leather workers 9 0.67 21 1.02 [0.47] 0.00 17 0.80 74 0.94 121 0.90 0.75*1.08<br />
27 Smelting workers 123 0.98 79 1.06 3 0.90 68 0.87 300 0.89 573 0.93 0.86*1.01<br />
28 Mechanics 349 1.04 498 0.98 12 1.06 398 0.94 1 628 0.97 2 885 0.98 0.94*1.01<br />
29 Plumbers 37 1.21 88 1.03 [1.76] 0.00 41 0.81 193 1.01 359 1.00 0.90*1.11<br />
30 Welders 74 0.85 [0.72] 0.00 45 0.74 222 0.98 341 0.91 0.82*1.01<br />
31 Electrical workers 79 0.97 217 0.97 6 0.85 180 0.95 599 1.02 1 081 0.99 0.93*1.05<br />
32 Wood workers 235 1.02 450 0.90 3 0.50 425 0.96 1 057 1.01 2 170 0.97 0.93*1.02<br />
33 Painters 77 1.01 85 0.78 4 1.63 77 1.06 318 1.03 561 0.99 0.91*1.07<br />
34 ‘‘Other construction workers’’ 272 0.96 295 0.91 11 0.85 84 0.91 527 0.94 1 189 0.93 0.88*0.99<br />
35 Bricklayers 84 1.00 51 0.97 33 0.77 143 1.05 311 0.99 0.88*1.10<br />
36 Printers 55 1.02 50 0.93 3 1.44 46 0.94 172 0.98 326 0.98 0.88*1.09<br />
37 Chemical process workers 45 0.93 90 1.06 [1.07] 0.00 101 1.09 239 0.96 475 0.99 0.91*1.09<br />
38 Food workers 163 1.03 50 0.82 12 1.30 99 0.90 268 1.03 592 0.99 0.91*1.07<br />
39 Beverage workers 20 1.05 4 1.03 [0.15] 0.00 4 2.00 11 0.79 39 1.00 0.71*1.36<br />
40 Tobacco workers 4 1.31 1 1.39 [0.01] 0.00 3 2.01 2 1.65 10 1.54 0.74*2.83<br />
41 Glass makers etc 74 0.80 90 1.01 2 1.20 56 0.96 243 0.85 465 0.88 0.81*0.97<br />
42 Packers 79 0.97 187 1.05 8 1.50 183 1.13 502 1.01 959 1.04 0.98*1.11<br />
43 Engine operators 84 0.99 275 1.08 4 0.52 124 1.11 435 0.98 922 1.02 0.96*1.09<br />
44 Public safety workers 86 1.09 154 1.08 5 1.00 84 1.13 268 1.01 597 1.05 0.97*1.14<br />
45 Cooks <strong>and</strong> stewards 4 0.64 7 0.69 1 0.38 30 0.81 46 0.92 88 0.83 0.67*1.03<br />
46 Domestic assistants [0.07] 0.00 [0.55] 0.00 [0.01] 0.00 1 2.45 3 0.58 4 0.65 0.18*1.65<br />
47 Waiters 14 1.09 13 1.31 [0.31] 0.00 17 1.15 25 0.98 69 1.09 0.84*1.37<br />
48 Building caretakers 101 1.23 112 0.96 4 2.02 53 1.37 198 1.00 468 1.07 0.98*1.17<br />
49 Chimney sweeps 2 0.91 7 0.83 2 0.52 11 0.73 22 0.75 0.47*1.13<br />
50 Hairdressers 28 1.19 4 1.64 [0.37] 0.00 14 1.33 49 0.98 95 1.09 0.88*1.33<br />
51 Launderers 15 1.30 [2.52] 0.00 [0.19] 0.00 5 0.81 34 0.94 54 0.96 0.72*1.25<br />
52 Military personnel 46 1.09 55 1.08 78 1.12 164 1.03 343 1.06 0.96*1.18<br />
53 ‘‘Other workers’’ 269 1.06 112 0.82 15 0.74 290 0.99 606 1.01 1 292 0.99 0.94*1.04<br />
54 Economically inactive 285 1.22 721 1.08 9 0.60 111 0.73 935 1.00 2 061 1.03 0.99*1.08<br />
1 54 All categories 6 129 1.00 8 558 1.00 253 1.00 6 391 1.00 20 330 1.00 41 661 1.00 Ref.<br />
Obs observed number of cases; SIR st<strong>and</strong>ardised incidence ratio; 95% CI 95% confidence interval.
Acta Oncol Downloaded from informahealthcare.com by 212.35.100.66 on 04/06/11<br />
For personal use only.<br />
Table 69. Observed number of non-Hodgkin lymphoma among women in the Nordic countries <strong>and</strong> st<strong>and</strong>ardised incidence ratios 1961<br />
2005, by country <strong>and</strong> occupational category.<br />
Denmark Finl<strong>and</strong> Icel<strong>and</strong> Norway Sweden Total<br />
No <strong>Occupation</strong>al category Obs SIR Obs SIR Obs SIR Obs SIR Obs SIR Obs SIR 95% CI<br />
1 Technical workers, etc 22 1.24 57 1.12 [0.57] 0.00 11 1.08 62 0.81 152 0.98 0.83*1.15<br />
2 Laboratory assistants 20 1.54 26 0.92 5 6.19 10 0.83 27 1.24 88 1.16 0.93*1.43<br />
3 Physicians 7 1.18 12 0.96 1 7.18 7 1.47 21 1.19 48 1.17 0.86*1.56<br />
4 Dentists 5 0.95 19 1.46 [0.05] 0.00 3 0.79 14 1.04 41 1.15 0.83*1.57<br />
5 Nurses 106 1.02 149 1.04 4 1.08 97 1.00 246 1.07 602 1.04 0.96*1.13<br />
6 Assistant nurses 67 0.89 149 1.03 6 1.13 100 1.02 449 1.12 771 1.06 0.99*1.14<br />
7 ‘‘Other health workers’’ 70 1.17 124 1.08 [1.11] 0.00 87 0.94 140 1.03 421 1.04 0.95*1.15<br />
8 Teachers 124 0.94 259 1.00 7 1.06 184 1.06 505 0.98 1 079 0.99 0.94*1.05<br />
9 Religious workers etc 24 1.35 150 1.14 1 1.01 46 1.04 162 0.95 383 1.05 0.95*1.16<br />
10 Artistic workers 9 0.98 17 0.80 1 1.29 12 0.94 35 1.06 74 0.96 0.76*1.21<br />
11 Journalists 2 1.02 9 0.66 [0.19] 0.00 4 1.11 19 1.24 34 0.98 0.68*1.37<br />
12 Administrators 58 1.07 43 0.94 2 3.27 32 0.78 59 0.79 194 0.90 0.78*1.03<br />
13 Clerical workers 563 1.05 902 1.06 25 1.24 564 1.03 1 269 1.00 3 323 1.03 1.00*1.07<br />
14 Sales agents 5 1.03 126 1.03 1 0.48 89 1.35 183 1.04 404 1.09 0.99*1.20<br />
15 Shop workers 349 0.96 431 0.96 5 0.39 449 1.01 800 1.03 2 034 1.00 0.95*1.04<br />
16 Farmers 202 0.79 269 1.00 8 0.88 271 0.97 63 0.92 813 0.92 0.86*0.99<br />
17 Gardeners 32 0.97 763 0.97 2 6.41 151 0.88 204 1.02 1 152 0.97 0.91*1.02<br />
18 Fishermen [1.30] 0.00 3 1.71 [0.33] 0.00 4 1.67 [0.66] 0.00 7 1.09 0.44*2.24<br />
19 Forestry workers [0.34] 0.00 4 1.16 [0.04] 0.00 5 1.44 4 0.91 13 1.11 0.59*1.90<br />
20 Miners <strong>and</strong> quarry workers [0.02] 0.00 [1.40] 0.00 [0.01] 0.00 [0.19] 0.00 1 0.94 1 0.37 0.01*2.07<br />
21 Seamen [0.42] 0.00 [0.00] 0.00 [0.55] 0.00 [0.13] 0.00 [1.10] 0.00 0.00*3.35<br />
22 Transport workers [0.36] 0.00 21 0.97 1 3.04 5 1.95 14 1.13 41 1.10 0.79*1.49<br />
23 Drivers 8 0.88 11 1.05 [0.15] 0.00 6 0.65 39 1.27 64 1.07 0.82*1.37<br />
24 Postal workers 21 1.10 109 0.81 3 0.73 95 0.93 200 0.91 428 0.89 0.81*0.98<br />
25 Textile workers 114 0.94 284 0.94 8 1.05 147 1.01 428 0.97 981 0.96 0.91*1.03<br />
26 Shoe <strong>and</strong> leather workers 9 1.01 27 0.73 1 2.45 8 0.75 39 1.15 84 0.92 0.73*1.14<br />
27 Smelting workers 2 0.92 8 0.92 1 58.16 5 3.36 10 1.05 26 1.19 0.78*1.74<br />
28 Mechanics 25 1.17 36 0.91 1 13.62 7 0.50 101 1.07 170 1.00 0.86*1.16<br />
29 Plumbers 1 4.83 [0.10] 0.00 1 8.92 1 7.05 3 5.39 1.11*15.76<br />
30 Welders 2 0.63 [0.01] 0.00 2 1.65 5 1.37 9 1.12 0.51*2.13<br />
31 Electrical workers 38 1.26 36 1.38 [0.06] 0.00 16 1.02 49 0.92 139 1.11 0.94*1.32<br />
32 Wood workers 15 1.50 73 0.96 [0.13] 0.00 6 1.09 16 1.01 110 1.03 0.85*1.24<br />
33 Painters [0.39] 0.00 10 1.11 [0.04] 0.00 1 0.82 3 0.71 14 0.94 0.51*1.58<br />
34 ‘‘Other construction workers’’ 1 3.37 34 1.14 [0.02] 0.00 [0.49] 0.00 [0.54] 0.00 35 1.12 0.78*1.56<br />
35 Bricklayers [0.06] 0.00 2 1.93 [0.03] 0.00 [0.02] 0.00 2 1.75 0.21*6.34<br />
36 Printers 11 0.97 36 0.94 [0.68] 0.00 12 0.92 37 0.94 96 0.93 0.76*1.14<br />
37 Chemical process workers 16 0.90 14 0.72 2 6.97 11 0.93 30 0.96 73 0.91 0.71*1.14<br />
38 Food workers 88 1.01 92 0.91 10 0.63 77 1.03 84 0.91 351 0.95 0.85*1.05<br />
39 Beverage workers 6 0.73 2 0.35 [0.04] 0.00 2 2.71 2 0.35 12 0.59 0.30*1.03<br />
40 Tobacco workers 16 1.42 3 0.93 [2.28] 0.00 4 1.08 23 1.12 0.71*1.68<br />
41 Glass makers etc 22 1.03 79 1.10 [0.43] 0.00 27 1.04 87 1.04 215 1.06 0.93*1.21<br />
42 Packers 4 0.65 142 1.12 1 0.65 60 0.97 132 1.06 339 1.06 0.95*1.18<br />
43 Engine operators [0.18] 0.00 17 0.83 [0.02] 0.00 [1.02] 0.00 8 0.98 25 0.84 0.54*1.23<br />
44 Public safety workers [0.68] 0.00 6 1.21 [0.31] 0.00 8 1.00 17 1.63 31 1.27 0.86*1.80<br />
45 Cooks <strong>and</strong> stewards [0.23] 0.00 123 0.86 7 1.20 80 1.00 169 0.95 379 0.93 0.84*1.03<br />
46 Domestic assistants 157 1.15 131 0.85 1 0.60 223 1.04 447 0.94 959 0.98 0.92*1.04<br />
47 Waiters 32 1.39 122 1.01 [0.68] 0.00 86 0.91 166 0.89 406 0.95 0.86*1.05<br />
48 Building caretakers 404 1.03 481 0.99 12 1.03 431 1.04 506 1.05 1 834 1.03 0.98*1.07<br />
49 Chimney sweeps [0.04] 0.00 1 4.24 [0.06] 0.00 [0.01] 0.00 1 2.88 0.07*16.04<br />
50 Hairdressers 32 1.34 47 1.02 [0.72] 0.00 23 0.94 73 0.90 175 0.99 0.86*1.15<br />
51 Launderers 47 1.06 43 1.12 4 2.16 31 0.95 85 0.88 210 0.98 0.86*1.13<br />
52 Military personnel [0.23] 0.00 [0.50] 0.00 [0.14] 0.00 1 3.05 1 0.83 0.02*4.65<br />
53 ‘‘Other workers’’ 108 0.97 158 1.04 11 0.91 201 0.93 231 1.06 709 1.00 0.93*1.08<br />
54 Economically inactive 2 937 0.99 3 206 1.01 43 1.03 2 208 1.00 9 786 1.00 18 180 1.00 0.98*1.01<br />
1 54 All categories 5 779 1.00 8 868 1.00 174 1.00 5 905 1.00 17 033 1.00 37 759 1.00 Ref.<br />
Obs observed number of cases; SIR st<strong>and</strong>ardised incidence ratio; 95% CI 95% confidence interval.<br />
<strong>Occupation</strong> <strong>and</strong> <strong>cancer</strong> in Nordic countries 751
Acta Oncol Downloaded from informahealthcare.com by 212.35.100.66 on 04/06/11<br />
For personal use only.<br />
752 E. Pukkala et al.<br />
/ 100 000<br />
5<br />
4<br />
3<br />
2<br />
1<br />
0<br />
Denmark<br />
Finl<strong>and</strong><br />
Icel<strong>and</strong><br />
Norway<br />
Sweden<br />
Men<br />
1945 1960 1975 1990 2005<br />
Hodgkin lymphoma<br />
The incidence of Hodgkin lymphoma in the<br />
Nordic countries is slightly higher in males than<br />
in females, <strong>and</strong> rates have been rather stable over<br />
time (Figure 46).<br />
Male bricklayers had the highest risk of Hodgkin<br />
lymphoma, SIR 1.33 (95% CI 1.04 1.68; Table 70),<br />
while electrical workers represent the group with a<br />
significant decreased risk (0.83, 0.71 0.98).<br />
Among women (Table 71), the only findings<br />
worth mentioning are the borderline significant<br />
excess risk among farmers (1.21, CI 1.00 1.45) <strong>and</strong><br />
the decreased risk among drivers (0.14, 0.00 0.80).<br />
Comment. Epstein Barr virus, immunodeficiency<br />
conditions <strong>and</strong> infectious mononucleosis have been<br />
implicated in the aetiology of Hodgkin lymphoma<br />
[138]. <strong>Occupation</strong>al studies have suggested that<br />
occupations related to woodworking industries <strong>and</strong><br />
/ 100 000<br />
5<br />
4<br />
3<br />
2<br />
1<br />
0<br />
Denmark<br />
Finl<strong>and</strong><br />
Icel<strong>and</strong><br />
Norway<br />
Sweden<br />
Women<br />
1945 1960 1975 1990 2005<br />
Figure 46. Age st<strong>and</strong>ardised (World) incidence rates for Hodgkin lymphoma 1943 2005, by country <strong>and</strong> gender. Modified from<br />
NORDCAN [49].<br />
/ 100 000<br />
5<br />
4<br />
3<br />
2<br />
1<br />
0<br />
Denmark<br />
Finl<strong>and</strong><br />
Icel<strong>and</strong><br />
Norway<br />
Sweden<br />
Men<br />
1945 1960 1975 1990 2005<br />
/ 100 000<br />
certain chemical exposures are related to risk [139].<br />
We found no clear evidence of variation in risk<br />
according to occupation.<br />
Multiple myeloma<br />
For multiple myeloma, incidence rates are rather<br />
similar between genders <strong>and</strong> in all Nordic countries<br />
(Figure 47). There was an increase in rates until the<br />
late 1980s, which then levelled off or even turned<br />
into a decrease, especially in Finl<strong>and</strong>.<br />
The variation between occupational categories<br />
in the incidence of multiple myeloma was small<br />
(Tables 72, 73). A weak increase in the risk of<br />
multiple myeloma was observed among male farmers,<br />
SIR 1.07 (95% CI 1.03 1.11) <strong>and</strong> a lowered<br />
risk among male printers (0.80, 0.68 0.95).<br />
Female farmers also had a somewhat increased<br />
risk (1.14, 1.05 1.24), while no occupation showed<br />
a decreased risk among women.<br />
5<br />
4<br />
3<br />
2<br />
1<br />
0<br />
Denmark<br />
Finl<strong>and</strong><br />
Icel<strong>and</strong><br />
Norway<br />
Sweden<br />
Women<br />
1945 1960 1975 1990 2005<br />
Figure 47. Age st<strong>and</strong>ardised (World) incidence rates for multiple myeloma 1943 2005, by country <strong>and</strong> gender. Modified from<br />
NORDCAN [49].
Acta Oncol Downloaded from informahealthcare.com by 212.35.100.66 on 04/06/11<br />
For personal use only.<br />
Table 70. Observed number of Hodgkin lymphoma among men in the Nordic countries <strong>and</strong> st<strong>and</strong>ardised incidence ratios 1961 2005, by<br />
country <strong>and</strong> occupational category.<br />
Denmark Finl<strong>and</strong> Icel<strong>and</strong> Norway Sweden Total<br />
No <strong>Occupation</strong>al category Obs SIR Obs SIR Obs SIR Obs SIR Obs SIR Obs SIR 95% CI<br />
1 Technical workers, etc 64 0.96 89 0.99 2 2.30 42 0.86 291 1.02 488 0.99 0.91*1.08<br />
2 Laboratory assistants 4 3.08 3 1.25 [0.18] 0.00 1 0.43 2 1.10 10 1.25 0.60*2.30<br />
3 Physicians 7 1.34 6 1.16 [0.30] 0.00 6 0.96 14 1.01 33 1.07 0.74*1.51<br />
4 Dentists 2 1.22 1 0.93 [0.08] 0.00 3 1.09 7 1.08 13 1.08 0.57*1.85<br />
5 Nurses [0.08] 0.00 1 1.95 [0.01] 0.00 [0.42] 0.00 2 1.52 3 1.29 0.27*3.76<br />
6 Assistant nurses 1 0.62 [0.51] 0.00 [0.07] 0.00 [1.04] 0.00 7 1.24 8 0.90 0.39*1.78<br />
7 ‘‘Other health workers’’ 4 0.88 7 1.46 [0.09] 0.00 4 1.60 8 0.68 23 0.97 0.62*1.46<br />
8 Teachers 28 0.95 39 1.17 1 0.84 31 0.86 64 0.85 163 0.93 0.80*1.08<br />
9 Religious workers etc 10 0.89 26 1.16 [0.75] 0.00 14 0.78 54 0.85 104 0.90 0.74*1.09<br />
10 Artistic workers [3.63] 0.00 8 1.15 [0.20] 0.00 2 0.39 22 1.22 32 0.94 0.65*1.33<br />
11 Journalists [1.73] 0.00 2 0.60 [0.11] 0.00 2 0.86 11 1.27 15 0.93 0.52*1.53<br />
12 Administrators 57 0.82 41 0.83 2 1.43 59 0.97 107 0.99 266 0.92 0.82*1.04<br />
13 Clerical workers 29 0.90 31 0.99 1 0.57 44 0.96 120 1.01 225 0.98 0.86*1.12<br />
14 Sales agents 12 0.70 39 0.82 1 1.17 54 1.01 178 1.02 284 0.97 0.86*1.09<br />
15 Shop workers 71 1.02 12 0.54 2 2.84 16 0.74 55 1.01 156 0.92 0.79*1.08<br />
16 Farmers 106 0.85 199 1.17 4 1.74 146 1.07 278 0.99 733 1.03 0.96*1.11<br />
17 Gardeners 13 0.72 29 0.99 [0.08] 0.00 32 0.94 106 1.01 180 0.96 0.83*1.12<br />
18 Fishermen 6 0.89 2 0.81 1 0.44 41 0.91 9 0.80 59 0.87 0.66*1.12<br />
19 Forestry workers 3 1.17 34 0.98 [0.02] 0.00 27 1.07 87 1.12 151 1.08 0.92*1.26<br />
20 Miners <strong>and</strong> quarry workers [0.82] 0.00 4 0.68 [0.04] 0.00 8 1.04 25 1.25 37 1.08 0.76*1.48<br />
21 Seamen 5 0.64 9 1.12 2 3.94 38 0.96 16 0.90 70 0.95 0.74*1.20<br />
22 Transport workers 16 1.07 22 1.05 [0.75] 0.00 24 1.27 47 0.87 109 1.00 0.83*1.20<br />
23 Drivers 55 1.05 85 1.11 1 0.74 61 1.05 142 0.97 344 1.03 0.93*1.14<br />
24 Postal workers 12 1.15 7 0.60 [0.14] 0.00 9 0.82 36 1.11 64 0.97 0.75*1.24<br />
25 Textile workers 9 1.06 7 1.04 [0.23] 0.00 14 1.30 37 1.09 67 1.11 0.86*1.41<br />
26 Shoe <strong>and</strong> leather workers 1 0.49 4 1.36 [0.05] 0.00 6 1.28 14 1.02 25 1.07 0.69*1.58<br />
27 Smelting workers 21 0.99 13 1.19 1 2.69 20 1.27 51 0.92 106 1.02 0.84*1.24<br />
28 Mechanics 70 1.25 71 0.88 2 1.32 96 1.22 265 1.01 504 1.05 0.96*1.15<br />
29 Plumbers 8 1.55 12 0.89 1 4.47 10 1.06 34 1.13 65 1.11 0.86*1.42<br />
30 Welders 10 0.67 [0.11] 0.00 18 1.69 31 0.89 59 0.98 0.74*1.26<br />
31 Electrical workers 14 1.00 36 0.99 1 1.00 31 0.89 66 0.72 148 0.83 0.71*0.98<br />
32 Wood workers 46 1.24 79 1.11 1 1.36 77 0.91 179 1.04 382 1.04 0.94*1.15<br />
33 Painters 18 1.45 12 0.74 [0.30] 0.00 14 0.95 48 0.95 92 0.97 0.79*1.19<br />
34 ‘‘Other construction workers’’ 39 0.88 41 0.86 2 1.17 24 1.31 104 1.09 210 1.01 0.89*1.16<br />
35 Bricklayers 13 0.95 13 1.75 12 1.40 31 1.39 69 1.33 1.04*1.68<br />
36 Printers 10 1.09 10 1.12 [0.29] 0.00 7 0.73 23 0.82 50 0.89 0.66*1.18<br />
37 Chemical process workers 13 1.72 13 1.00 [0.12] 0.00 16 0.82 39 0.92 81 0.98 0.78*1.22<br />
38 Food workers 26 1.02 8 0.87 2 1.98 26 1.16 50 1.20 112 1.12 0.93*1.35<br />
39 Beverage workers 3 0.96 [0.57] 0.00 [0.02] 0.00 [0.32] 0.00 1 0.40 4 0.61 0.17*1.57<br />
40 Tobacco workers 1 2.18 [0.11] 0.00 [0.00] 0.00 [0.34] 0.00 [0.19] 0.00 1 0.90 0.02*5.04<br />
41 Glass makers etc 17 1.17 17 1.21 [0.20] 0.00 14 1.24 39 0.83 87 1.00 0.80*1.24<br />
42 Packers 13 1.02 25 0.93 [0.58] 0.00 29 0.85 97 1.13 164 1.03 0.88*1.20<br />
43 Engine operators 16 1.16 44 1.12 1 1.00 21 1.00 73 1.01 155 1.05 0.90*1.23<br />
44 Public safety workers 21 1.70 20 0.92 [0.60] 0.00 18 1.26 41 0.97 100 1.10 0.90*1.33<br />
45 Cooks <strong>and</strong> stewards 1 0.90 3 1.55 1 2.70 4 0.57 3 0.35 12 0.64 0.33*1.11<br />
46 Domestic assistants [0.01] 0.00 [0.08] 0.00 [0.00] 0.00 [0.06] 0.00 1 0.94 1 0.82 0.02*4.58<br />
47 Waiters 1 0.44 1 0.51 [0.05] 0.00 2 0.68 3 0.69 7 0.61 0.24*1.25<br />
48 Building caretakers 15 1.17 15 0.88 [0.18] 0.00 6 0.78 34 0.98 70 0.96 0.75*1.22<br />
49 Chimney sweeps [0.37] 0.00 1 0.78 [0.76] 0.00 3 1.23 4 0.82 0.22*2.11<br />
50 Hairdressers 5 1.37 [0.41] 0.00 [0.05] 0.00 1 0.46 9 1.12 15 1.05 0.59*1.73<br />
51 Launderers [1.75] 0.00 [0.40] 0.00 [0.02] 0.00 1 0.79 6 1.05 7 0.77 0.31*1.58<br />
52 Military personnel 9 1.24 6 0.73 19 1.59 20 0.86 54 1.07 0.80*1.39<br />
53 ‘‘Other workers’’ 51 1.22 29 1.37 [2.28] 0.00 59 0.94 117 1.13 256 1.11 0.98*1.25<br />
54 Economically inactive 31 0.81 102 0.90 2 0.99 31 0.83 184 1.01 350 0.94 0.85*1.04<br />
1 54 All categories 977 1.00 1 288 1.00 31 1.00 1 240 1.00 3 291 1.00 6 827 1.00 Ref.<br />
Obs observed number of cases; SIR st<strong>and</strong>ardised incidence ratio; 95% CI 95% confidence interval.<br />
<strong>Occupation</strong> <strong>and</strong> <strong>cancer</strong> in Nordic countries 753
Acta Oncol Downloaded from informahealthcare.com by 212.35.100.66 on 04/06/11<br />
For personal use only.<br />
754 E. Pukkala et al.<br />
Table 71. Observed number of Hodgkin lymphoma among women in the Nordic countries <strong>and</strong> st<strong>and</strong>ardised incidence ratios 1961 2005,<br />
by country <strong>and</strong> occupational category.<br />
Denmark Finl<strong>and</strong> Icel<strong>and</strong> Norway Sweden Total<br />
No <strong>Occupation</strong>al category Obs SIR Obs SIR Obs SIR Obs SIR Obs SIR Obs SIR 95% CI<br />
1 Technical workers, etc 1 0.54 9 1.38 [0.08] 0.00 1 0.94 7 0.70 18 0.92 0.55*1.46<br />
2 Laboratory assistants [1.39] 0.00 4 1.23 [0.09] 0.00 2 1.58 5 1.56 11 1.20 0.60*2.14<br />
3 Physicians 1 1.64 [1.68] 0.00 [0.02] 0.00 [0.57] 0.00 [2.35] 0.00 1 0.19 0.00*1.07<br />
4 Dentists 1 1.85 2 1.44 [0.00] 0.00 3 6.23 1 0.58 7 1.68 0.68*3.47<br />
5 Nurses 14 1.30 11 0.67 [0.35] 0.00 10 1.08 28 0.95 63 0.95 0.73*1.22<br />
6 Assistant nurses 4 0.50 14 0.92 1 1.29 10 1.18 50 0.95 79 0.93 0.74*1.16<br />
7 ‘‘Other health workers’’ 9 1.47 16 1.23 [0.14] 0.00 10 1.06 23 1.28 58 1.24 0.94*1.61<br />
8 Teachers 13 0.94 29 1.03 [0.69] 0.00 16 0.82 52 0.78 110 0.85 0.71*1.03<br />
9 Religious workers etc [1.84] 0.00 11 0.63 [0.10] 0.00 2 0.44 22 0.92 35 0.73 0.51*1.02<br />
10 Artistic workers 2 2.15 1 0.39 [0.07] 0.00 [1.46] 0.00 4 0.91 7 0.74 0.30*1.53<br />
11 Journalists [0.21] 0.00 2 1.29 [0.02] 0.00 [0.38] 0.00 1 0.49 3 0.71 0.15*2.09<br />
12 Administrators 3 0.54 2 0.37 1 22.44 8 1.69 14 1.39 28 1.09 0.72*1.57<br />
13 Clerical workers 66 1.18 80 0.85 3 1.19 46 0.78 177 1.12 372 1.01 0.91*1.11<br />
14 Sales agents [0.49] 0.00 9 0.70 [0.19] 0.00 7 0.78 25 1.03 41 0.88 0.63*1.19<br />
15 Shop workers 36 0.97 32 0.73 1 0.68 34 0.74 100 1.06 203 0.91 0.79*1.04<br />
16 Farmers 27 1.04 29 1.11 2 2.46 40 1.27 16 1.56 114 1.21 1.00*1.45<br />
17 Gardeners 5 1.50 81 1.17 [0.04] 0.00 15 0.82 30 1.21 131 1.13 0.95*1.34<br />
18 Fishermen [0.13] 0.00 [0.17] 0.00 [0.03] 0.00 [0.22] 0.00 1 11.49 1 1.56 0.04*8.71<br />
19 Forestry workers [0.03] 0.00 [0.33] 0.00 [0.01] 0.00 [0.31] 0.00 [0.54] 0.00 [1.22] 0.00 0.00*3.02<br />
20 Miners <strong>and</strong> quarry workers [0.00] 0.00 [0.13] 0.00 [0.00] 0.00 [0.02] 0.00 [0.13] 0.00 [0.28] 0.00 0.00*12.97<br />
21 Seamen [0.06] 0.00 [0.00] 0.00 [0.05] 0.00 [0.02] 0.00 [0.14] 0.00 0.00*27.01<br />
22 Transport workers [0.04] 0.00 [1.95] 0.00 1 32.00 [0.28] 0.00 2 1.18 3 0.75 0.16*2.20<br />
23 Drivers [0.95] 0.00 1 0.89 [0.01] 0.00 [0.94] 0.00 [3.95] 0.00 1 0.14 0.00*0.80<br />
24 Postal workers 2 1.03 21 1.62 1 2.64 14 1.19 23 0.85 61 1.13 0.86*1.45<br />
25 Textile workers 11 0.88 31 1.08 [0.76] 0.00 16 0.81 45 0.79 103 0.87 0.72*1.05<br />
26 Shoe <strong>and</strong> leather workers [0.93] 0.00 2 0.57 [0.04] 0.00 3 2.12 6 1.40 11 1.08 0.54*1.93<br />
27 Smelting workers 1 4.37 1 1.24 [0.00] 0.00 [0.12] 0.00 2 1.75 4 1.74 0.47*4.45<br />
28 Mechanics 5 2.19 2 0.51 [0.00] 0.00 1 0.62 12 1.01 20 1.01 0.62*1.56<br />
29 Plumbers [0.02] 0.00 [0.01] 0.00 [0.01] 0.00 [0.02] 0.00 [0.06] 0.00 0.00*61.00<br />
30 Welders 1 2.98 [0.00] 0.00 [0.11] 0.00 1 2.10 2 2.17 0.26*7.85<br />
31 Electrical workers 2 0.62 2 0.66 [0.01] 0.00 2 1.15 3 0.45 9 0.61 0.28*1.16<br />
32 Wood workers 1 0.95 3 0.43 [0.02] 0.00 1 2.00 [2.02] 0.00 5 0.47 0.15*1.11<br />
33 Painters [0.04] 0.00 [0.87] 0.00 [0.01] 0.00 [0.12] 0.00 [0.55] 0.00 [1.59] 0.00 0.00*2.33<br />
34 ‘‘Other construction workers’’ [0.03] 0.00 3 1.14 [0.00] 0.00 [0.04] 0.00 [0.08] 0.00 3 1.07 0.22*3.14<br />
35 Bricklayers [0.01] 0.00 [0.10] 0.00 [0.00] 0.00 [0.00] 0.00 [0.11] 0.00 0.00*34.61<br />
36 Printers [1.19] 0.00 5 1.26 [0.08] 0.00 [1.69] 0.00 4 0.78 9 0.75 0.34*1.42<br />
37 Chemical process workers 1 0.54 [1.85] 0.00 [0.03] 0.00 1 0.69 3 0.76 5 0.55 0.18*1.27<br />
38 Food workers 10 1.10 8 0.84 [1.89] 0.00 8 0.90 8 0.66 34 0.82 0.57*1.15<br />
39 Beverage workers 2 2.29 3 5.72 [0.00] 0.00 [0.07] 0.00 1 1.28 6 2.67 0.98*5.81<br />
40 Tobacco workers 2 1.65 [0.28] 0.00 2 5.18 [0.44] 0.00 4 1.72 0.47*4.41<br />
41 Glass makers etc 2 0.89 11 1.59 [0.05] 0.00 2 0.65 8 0.77 23 1.01 0.64*1.52<br />
42 Packers 1 1.57 12 1.00 [0.17] 0.00 5 0.72 15 0.95 33 0.93 0.64*1.30<br />
43 Engine operators [0.02] 0.00 3 1.50 [0.01] 0.00 [0.09] 0.00 1 1.01 4 1.29 0.35*3.30<br />
44 Public safety workers [0.07] 0.00 2 3.66 [0.03] 0.00 [0.73] 0.00 2 1.25 4 1.34 0.37*3.43<br />
45 Cooks <strong>and</strong> stewards [0.02] 0.00 17 1.18 [0.61] 0.00 18 1.73 23 0.94 58 1.16 0.88*1.50<br />
46 Domestic assistants 13 0.93 16 0.94 [0.17] 0.00 19 0.72 60 0.88 108 0.86 0.71*1.04<br />
47 Waiters 2 0.82 15 1.20 [0.09] 0.00 9 0.84 26 1.10 52 1.06 0.79*1.38<br />
48 Building caretakers 55 1.35 44 0.94 [1.09] 0.00 40 0.95 70 1.08 209 1.07 0.94*1.23<br />
49 Chimney sweeps [0.00] 0.00 [0.02] 0.00 [0.00] 0.00 [0.00] 0.00 [0.03] 0.00 0.00*113.90<br />
50 Hairdressers 2 0.80 5 1.01 [0.13] 0.00 2 0.66 7 0.70 16 0.78 0.44*1.26<br />
51 Launderers 8 1.76 1 0.29 [0.19] 0.00 2 0.49 15 1.18 26 1.04 0.68*1.53<br />
52 Military personnel [0.02] 0.00 [0.06] 0.00 [0.01] 0.00 [0.05] 0.00 [0.14] 0.00 0.00*25.50<br />
53 ‘‘Other workers’’ 16 1.38 21 1.36 [1.49] 0.00 22 0.97 35 1.22 94 1.18 0.95*1.44<br />
54 Economically inactive 280 0.91 331 1.05 9 2.12 424 1.09 1 302 1.01 2 346 1.02 0.98*1.06<br />
1 54 All categories 598 1.00 893 1.00 19 1.00 795 1.00 2 230 1.00 4 535 1.00 Ref.<br />
Obs observed number of cases; SIR st<strong>and</strong>ardised incidence ratio; 95% CI 95% confidence interval.
Acta Oncol Downloaded from informahealthcare.com by 212.35.100.66 on 04/06/11<br />
For personal use only.<br />
Table 72. Observed number of multiple myeloma among men in the Nordic countries <strong>and</strong> st<strong>and</strong>ardised incidence ratios 1961 2005, by<br />
country <strong>and</strong> occupational category.<br />
Denmark Finl<strong>and</strong> Icel<strong>and</strong> Norway Sweden Total<br />
No <strong>Occupation</strong>al category Obs SIR Obs SIR Obs SIR Obs SIR Obs SIR Obs SIR 95% CI<br />
1 Technical workers, etc 220 0.97 175 1.00 [2.39] 0.00 192 1.13 904 1.01 1 491 1.02 0.97*1.07<br />
2 Laboratory assistants 6 1.33 4 0.95 [0.48] 0.00 4 0.47 3 0.77 17 0.79 0.46*1.26<br />
3 Physicians 17 0.91 13 1.30 [1.02] 0.00 25 1.04 33 0.82 88 0.94 0.75*1.16<br />
4 Dentists 4 0.74 2 0.93 [0.25] 0.00 6 0.56 22 1.10 34 0.88 0.61*1.23<br />
5 Nurses [0.25] 0.00 1 2.06 [0.01] 0.00 1 1.19 3 1.58 5 1.43 0.46*3.34<br />
6 Assistant nurses 7 1.30 [0.42] 0.00 [0.11] 0.00 4 0.95 14 1.01 25 1.04 0.67*1.54<br />
7 ‘‘Other health workers’’ 18 1.11 8 0.80 [0.26] 0.00 8 0.87 46 1.34 80 1.14 0.91*1.42<br />
8 Teachers 102 1.03 73 0.99 4 1.10 143 1.12 215 0.95 537 1.01 0.93*1.10<br />
9 Religious workers etc 54 1.29 46 1.17 1 0.43 66 0.97 186 1.07 353 1.09 0.98*1.21<br />
10 Artistic workers 16 1.23 16 1.12 1 1.55 15 0.76 45 0.83 93 0.91 0.74*1.12<br />
11 Journalists 6 0.98 5 0.72 [0.36] 0.00 7 0.82 26 1.04 44 0.93 0.68*1.25<br />
12 Administrators 270 1.06 117 1.02 3 0.49 217 0.89 350 0.99 957 0.99 0.93*1.05<br />
13 Clerical workers 99 0.89 66 0.87 10 1.48 170 0.95 377 1.00 722 0.96 0.90*1.04<br />
14 Sales agents 46 0.78 110 1.03 3 0.85 211 0.98 572 1.06 942 1.02 0.95*1.08<br />
15 Shop workers 274 1.06 45 1.02 1 0.42 78 0.99 172 0.99 570 1.02 0.94*1.11<br />
16 Farmers 498 1.00 581 1.04 11 1.11 689 1.07 1 091 1.12 2 870 1.07 1.03*1.11<br />
17 Gardeners 72 1.02 77 1.01 [0.31] 0.00 151 0.99 401 1.13 701 1.07 1.00*1.16<br />
18 Fishermen 18 0.76 7 0.97 4 0.68 185 0.95 44 1.16 258 0.96 0.85*1.08<br />
19 Forestry workers 7 0.67 75 0.85 [0.05] 0.00 116 1.00 250 0.97 448 0.95 0.87*1.04<br />
20 Miners <strong>and</strong> quarry workers 4 1.25 13 0.93 [0.10] 0.00 33 1.08 75 1.20 125 1.13 0.95*1.35<br />
21 Seamen 22 0.87 17 0.91 2 1.23 123 0.83 53 0.97 217 0.88 0.77*1.00<br />
22 Transport workers 53 0.96 65 1.15 7 2.16 88 1.10 186 1.00 399 1.05 0.95*1.15<br />
23 Drivers 156 0.86 181 1.04 7 1.48 204 0.95 445 1.00 993 0.97 0.91*1.04<br />
24 Postal workers 29 0.83 33 1.23 [0.59] 0.00 45 1.05 83 0.84 190 0.93 0.81*1.07<br />
25 Textile workers 27 0.84 20 1.09 [0.99] 0.00 44 0.91 101 0.89 192 0.90 0.78*1.04<br />
26 Shoe <strong>and</strong> leather workers 5 0.63 8 0.99 [0.22] 0.00 16 0.77 51 1.12 80 0.97 0.77*1.21<br />
27 Smelting workers 99 1.38 29 1.05 [1.44] 0.00 64 1.01 150 0.84 342 1.00 0.90*1.11<br />
28 Mechanics 206 1.07 147 0.85 4 0.89 285 0.96 727 0.90 1 369 0.93 0.88*0.98<br />
29 Plumbers 15 0.87 35 1.23 [0.73] 0.00 41 1.22 99 1.06 190 1.09 0.95*1.26<br />
30 Welders 30 1.15 1 3.61 33 0.90 96 0.92 160 0.95 0.82*1.11<br />
31 Electrical workers 44 0.97 72 1.00 3 1.13 128 0.98 280 1.01 527 1.00 0.92*1.09<br />
32 Wood workers 120 0.90 169 0.88 2 0.77 399 1.10 573 1.03 1 263 1.01 0.96*1.07<br />
33 Painters 40 0.92 45 1.13 [1.08] 0.00 44 0.73 151 0.94 280 0.92 0.82*1.03<br />
34 ‘‘Other construction workers’’ 200 1.19 116 0.94 8 1.55 75 1.08 292 0.97 691 1.04 0.96*1.12<br />
35 Bricklayers 47 0.97 22 1.10 55 1.53 62 0.85 186 1.05 0.91*1.21<br />
36 Printers 28 0.92 17 0.99 [0.86] 0.00 27 0.77 63 0.74 135 0.80 0.68*0.95<br />
37 Chemical process workers 24 0.84 32 1.09 [0.48] 0.00 98 1.20 129 0.96 283 1.03 0.92*1.16<br />
38 Food workers 99 1.07 16 0.75 5 1.25 92 1.00 148 1.09 360 1.05 0.94*1.16<br />
39 Beverage workers 8 0.71 3 2.05 [0.07] 0.00 [0.79] 0.00 7 0.91 18 0.85 0.50*1.34<br />
40 Tobacco workers 1 0.54 1 4.00 [0.01] 0.00 1 0.70 [0.59] 0.00 3 0.73 0.15*2.13<br />
41 Glass makers etc 45 0.83 35 1.14 1 1.39 57 1.33 147 1.00 285 1.03 0.92*1.16<br />
42 Packers 39 0.81 67 1.03 3 1.31 121 0.88 268 1.00 498 0.96 0.88*1.04<br />
43 Engine operators 47 0.96 88 1.04 4 1.29 72 0.98 212 0.97 423 0.99 0.90*1.09<br />
44 Public safety workers 45 0.98 56 1.12 5 2.25 68 1.16 143 1.13 317 1.12 1.00*1.25<br />
45 Cooks <strong>and</strong> stewards 5 1.41 7 2.39 [1.05] 0.00 21 0.86 21 0.94 54 0.99 0.75*1.30<br />
46 Domestic assistants [0.04] 0.00 [0.22] 0.00 [0.00] 0.00 [0.19] 0.00 [1.77] 0.00 [2.23] 0.00 0.00*1.66<br />
47 Waiters 8 1.06 4 1.44 1 9.01 13 1.20 11 0.95 37 1.13 0.79*1.55<br />
48 Building caretakers 54 1.11 37 0.85 3 3.09 26 0.87 117 1.13 237 1.05 0.92*1.19<br />
49 Chimney sweeps 4 3.22 2 0.63 3 0.99 8 1.10 17 1.15 0.67*1.85<br />
50 Hairdressers 7 0.50 2 2.28 [0.16] 0.00 6 0.68 31 1.17 46 0.91 0.67*1.22<br />
51 Launderers 13 1.92 1 1.11 [0.09] 0.00 6 1.14 22 1.16 42 1.31 0.95*1.78<br />
52 Military personnel 22 0.95 19 1.24 35 0.77 75 1.00 151 0.95 0.81*1.11<br />
53 ‘‘Other workers’’ 150 1.01 49 0.96 6 0.66 281 1.05 317 0.98 803 1.00 0.93*1.07<br />
54 Economically inactive 143 0.96 280 0.97 8 1.24 118 0.85 409 0.84 958 0.90 0.84*0.96<br />
1 54 All categories 3 543 1.00 3 139 1.00 108 1.00 5 010 1.00 10 306 1.00 22 106 1.00 Ref.<br />
Obs observed number of cases; SIR st<strong>and</strong>ardised incidence ratio; 95% CI 95% confidence interval.<br />
<strong>Occupation</strong> <strong>and</strong> <strong>cancer</strong> in Nordic countries 755
Acta Oncol Downloaded from informahealthcare.com by 212.35.100.66 on 04/06/11<br />
For personal use only.<br />
756 E. Pukkala et al.<br />
Table 73. Observed number of multiple myeloma among women in the Nordic countries <strong>and</strong> st<strong>and</strong>ardised incidence ratios 1961 2005, by<br />
country <strong>and</strong> occupational category.<br />
Denmark Finl<strong>and</strong> Icel<strong>and</strong> Norway Sweden Total<br />
No <strong>Occupation</strong>al category Obs SIR Obs SIR Obs SIR Obs SIR Obs SIR Obs SIR 95% CI<br />
1 Technical workers, etc 8 0.92 16 1.05 [0.23] 0.00 5 1.11 33 1.02 62 1.02 0.78*1.30<br />
2 Laboratory assistants 6 1.00 11 1.22 [0.36] 0.00 3 0.48 4 0.59 24 0.84 0.54*1.26<br />
3 Physicians 3 1.04 [3.60] 0.00 1 14.61 1 0.39 11 1.61 16 1.00 0.57*1.63<br />
4 Dentists [2.59] 0.00 5 1.03 [0.03] 0.00 1 0.43 8 1.35 14 0.89 0.49*1.49<br />
5 Nurses 49 0.95 49 1.08 [1.86] 0.00 56 1.16 96 0.95 250 1.01 0.89*1.14<br />
6 Assistant nurses 37 1.01 53 1.04 3 1.20 44 0.90 164 0.97 301 0.98 0.87*1.09<br />
7 ‘‘Other health workers’’ 33 1.12 39 1.00 [0.51] 0.00 44 0.87 51 0.92 167 0.95 0.82*1.11<br />
8 Teachers 67 1.06 98 1.09 1 0.32 104 1.11 226 1.02 496 1.05 0.97*1.15<br />
9 Religious workers etc 4 0.46 40 1.11 [0.47] 0.00 24 1.02 65 0.95 133 0.97 0.82*1.15<br />
10 Artistic workers 8 1.72 [6.74] 0.00 [0.39] 0.00 6 0.80 14 1.00 28 0.84 0.56*1.22<br />
11 Journalists 1 1.04 5 1.10 [0.10] 0.00 2 1.08 10 1.57 18 1.30 0.77*2.06<br />
12 Administrators 35 1.26 12 0.81 [0.35] 0.00 24 0.96 30 0.92 101 1.00 0.83*1.22<br />
13 Clerical workers 231 0.89 269 0.95 18 1.85 287 0.92 569 1.03 1 374 0.97 0.92*1.02<br />
14 Sales agents 2 0.83 44 0.95 1 0.89 48 0.94 74 0.86 169 0.90 0.78*1.05<br />
15 Shop workers 175 0.96 154 0.93 4 0.61 269 0.96 379 0.99 981 0.96 0.91*1.03<br />
16 Farmers 126 0.99 142 1.17 7 1.41 258 1.22 37 1.07 570 1.14 1.05*1.24<br />
17 Gardeners 18 1.09 356 1.06 1 6.07 143 1.14 90 0.89 608 1.05 0.97*1.13<br />
18 Fishermen [0.64] 0.00 1 1.47 [0.16] 0.00 2 1.45 1 3.06 4 1.26 0.34*3.22<br />
19 Forestry workers [0.17] 0.00 [1.28] 0.00 [0.02] 0.00 1 0.46 4 1.93 5 0.87 0.28*2.04<br />
20 Miners <strong>and</strong> quarry workers [0.01] 0.00 1 1.68 [0.00] 0.00 [0.09] 0.00 [0.46] 0.00 1 0.86 0.02*4.76<br />
21 Seamen [0.12] 0.00 [0.00] 0.00 [0.31] 0.00 [0.04] 0.00 [0.48] 0.00 0.00*7.73<br />
22 Transport workers [0.18] 0.00 4 0.45 [0.17] 0.00 [1.35] 0.00 5 0.88 9 0.55 0.25*1.05<br />
23 Drivers 5 1.10 3 0.86 [0.07] 0.00 6 1.13 9 0.70 23 0.87 0.55*1.31<br />
24 Postal workers 7 0.72 62 1.20 1 0.43 71 1.12 100 0.97 241 1.05 0.92*1.19<br />
25 Textile workers 63 1.03 103 0.87 6 1.42 134 1.19 226 0.96 532 1.00 0.92*1.09<br />
26 Shoe <strong>and</strong> leather workers 8 1.79 16 1.10 [0.21] 0.00 5 0.63 15 0.84 44 0.98 0.71*1.31<br />
27 Smelting workers 2 1.83 1 0.29 [0.01] 0.00 1 1.45 6 1.47 10 1.07 0.51*1.97<br />
28 Mechanics 11 1.04 18 1.24 [0.04] 0.00 6 0.67 40 0.94 75 0.98 0.77*1.22<br />
29 Plumbers [0.11] 0.00 [0.03] 0.00 [0.06] 0.00 [0.05] 0.00 [0.24] 0.00 0.00*15.33<br />
30 Welders [1.01] 0.00 [0.00] 0.00 1 1.93 [1.39] 0.00 1 0.34 0.01*1.91<br />
31 Electrical workers 5 0.34 7 0.85 [0.03] 0.00 13 1.39 26 1.10 51 0.91 0.68*1.20<br />
32 Wood workers 5 1.01 28 0.91 [0.06] 0.00 4 1.33 10 1.46 47 1.03 0.76*1.37<br />
33 Painters [0.19] 0.00 4 1.14 [0.02] 0.00 [0.71] 0.00 3 1.56 7 1.10 0.44*2.27<br />
34 ‘‘Other construction workers’’ [0.15] 0.00 13 1.00 [0.01] 0.00 [0.27] 0.00 [0.20] 0.00 13 0.95 0.51*1.62<br />
35 Bricklayers [0.03] 0.00 1 2.51 [0.01] 0.00 [0.01] 0.00 1 2.23 0.06*12.44<br />
36 Printers 12 2.12 13 0.90 1 2.87 5 0.56 16 0.86 47 0.98 0.72*1.30<br />
37 Chemical process workers 7 0.77 10 1.29 [0.16] 0.00 5 0.62 20 1.31 42 1.04 0.75*1.41<br />
38 Food workers 44 1.00 30 0.73 8 0.97 52 0.96 59 1.23 193 0.99 0.86*1.14<br />
39 Beverage workers 6 1.41 1 0.42 [0.02] 0.00 2 4.66 2 0.65 11 1.08 0.54*1.93<br />
40 Tobacco workers 5 0.86 3 2.26 3 1.54 1 0.57 12 1.11 0.57*1.94<br />
41 Glass makers etc 11 1.04 23 0.83 1 4.76 19 1.11 41 1.02 95 0.99 0.80*1.21<br />
42 Packers 3 0.98 54 1.09 [0.84] 0.00 42 1.00 63 1.03 162 1.04 0.89*1.21<br />
43 Engine operators [0.08] 0.00 4 0.52 [0.01] 0.00 [0.45] 0.00 1 0.32 5 0.44 0.14*1.03<br />
44 Public safety workers [0.38] 0.00 1 0.57 [0.16] 0.00 7 1.33 5 1.24 13 1.12 0.60*1.92<br />
45 Cooks <strong>and</strong> stewards [0.12] 0.00 63 1.13 4 1.27 73 1.16 104 1.09 244 1.12 0.99*1.27<br />
46 Domestic assistants 58 0.84 61 1.10 3 3.17 168 1.05 224 0.99 514 1.01 0.92*1.10<br />
47 Waiters 11 0.94 47 1.06 1 2.86 59 0.93 89 0.92 207 0.96 0.84*1.10<br />
48 Building caretakers 209 1.04 207 1.06 4 0.62 272 1.01 234 0.97 926 1.01 0.95*1.08<br />
49 Chimney sweeps [0.02] 0.00 [0.09] 0.00 [0.04] 0.00 [0.00] 0.00 [0.15] 0.00 0.00*23.93<br />
50 Hairdressers 10 0.87 12 0.72 [0.29] 0.00 14 0.89 28 0.76 64 0.79 0.61*1.01<br />
51 Launderers 14 0.62 16 0.98 [1.06] 0.00 27 1.08 53 1.02 110 0.94 0.78*1.13<br />
52 Military personnel [0.12] 0.00 [0.11] 0.00 [0.06] 0.00 [0.10] 0.00 [0.39] 0.00 0.00*9.56<br />
53 ‘‘Other workers’’ 54 0.95 69 1.19 9 1.43 122 0.90 120 1.13 374 1.03 0.93*1.14<br />
54 Economically inactive 1 602 1.03 1 383 0.98 16 0.74 1 926 0.98 5 186 1.00 10 113 1.00 0.98*1.02<br />
1 54 All categories 2 955 1.00 3 552 1.00 90 1.00 4 359 1.00 8 552 1.00 19 508 1.00 Ref.<br />
Obs observed number of cases; SIR st<strong>and</strong>ardised incidence ratio; 95% CI 95% confidence interval.
Acta Oncol Downloaded from informahealthcare.com by 212.35.100.66 on 04/06/11<br />
For personal use only.<br />
Comment. Previous studies have found associations<br />
between multiple myeloma <strong>and</strong> work in the production<br />
of non-arsenical insecticides, pest control,<br />
agricultural work <strong>and</strong> flour <strong>and</strong> grain mill work<br />
[87]. In our study, we found a modest but consistent<br />
excess risk among farmers in both genders <strong>and</strong> in<br />
all countries except Denmark.<br />
Leukaemia<br />
Incidence rates for leukaemia are higher among men<br />
than among women in all Nordic countries <strong>and</strong> have<br />
been quite stable over the latest decades (Figure 48).<br />
Generally, there was only minor variation in<br />
the incidence of leukaemia between the occupations<br />
(Tables 74, 75). Significantly elevated SIRs for<br />
leukaemia were seen among male public safety<br />
workers (1.11, 95% CI 1.02 1.21), sales agents<br />
<strong>and</strong> clerical workers. The SIR was decreased among<br />
launderers (0.71, 0.50 0.99), fishermen <strong>and</strong> forestry<br />
workers. The risk of 0.28 (0.03 0.99) among male<br />
nurses was derived from two cases only. There were<br />
no elevated leukaemia risks according to occupation<br />
among women. A slightly decreased SIR (0.91,<br />
0.84 0.98) was observed in textile workers.<br />
A somewhat elevated SIR of chronic lymphocytic<br />
leukaemia (CLL) was observed among male<br />
farmers (1.09, 1.03 1.14), while reduced risks<br />
were observed among ‘‘other health workers’’<br />
(0.59, 0.37 0.89) <strong>and</strong> seamen (0.80, 0.66 0.96).<br />
No female occupation showed any significantly<br />
elevated or reduced risk of CLL (http://astra.can<br />
cer.fi/NOCCA/Incidence/CLL).<br />
The risk of acute myeloid leukaemia (AML) in<br />
men was highest among drivers (1.16, 1.07 1.27),<br />
<strong>and</strong> sales agents (1.11, 1.01 1.22) also had a somewhat<br />
elevated risk. The lowest risks were observed<br />
among seamen, (0.79, 0.64 0.96) <strong>and</strong> forestry<br />
workers (0.85, 0.73 0.99). None of the female<br />
/ 100 000<br />
10<br />
5<br />
Men<br />
0<br />
Denmark<br />
Finl<strong>and</strong><br />
Icel<strong>and</strong><br />
Norway<br />
Sweden<br />
1945 1960 1975 1990 2005<br />
/ 100 000<br />
occupations had a significantly elevated risk, while<br />
textile workers were observed to have a lowered<br />
risk (0.83, 0.72 0.96; http://astra.<strong>cancer</strong>.fi/NOCCA/<br />
Incidence/AML).<br />
Comment. Leukaemia comprises a heterogeneous<br />
group of acute <strong>and</strong> chronic myelogenous <strong>and</strong><br />
lymphocytic malignancies originating in different<br />
cells of the haematopoietic system. Exposure to<br />
ionising radiation is a common aetiological factor<br />
for all types of leukaemia. Several chemical <strong>and</strong><br />
physical exposures occurring in occupational settings<br />
have been previously reported as associated<br />
with an increased risk of leukaemia. Such exposures<br />
with substantial evidence include benzene, ethylene<br />
oxide, ionising radiation (including x-rays, gamma<br />
rays, neutrons, <strong>and</strong> radon gas <strong>and</strong> its decay products)<br />
1,3-butadiene, non-arsenical insecticides<br />
[87], work in boot <strong>and</strong> shoe manufacturing <strong>and</strong><br />
repair, the rubber industry <strong>and</strong> petroleum refining In<br />
this study there was very little variation in SIRs<br />
between occupational categories, <strong>and</strong> for instance,<br />
the incidence of leukaemia in shoe <strong>and</strong> leather work<br />
was 6 7% below the average in both genders.<br />
There was a small (about 10%) excess risk of<br />
CLL among farmers <strong>and</strong> clerical workers in both<br />
genders which is similar to the effect found in some<br />
previous studies [140,141].<br />
Environmental <strong>and</strong> occupational risk factors for<br />
AML include exposure to toxic chemicals present in<br />
tobacco smoke, emissions from industrial operations<br />
<strong>and</strong> petroleum refinery waste dumps [142], as well<br />
as high dose radiation exposure, exposure to high<br />
dose benzene <strong>and</strong> prior treatment with chemotherapeutic<br />
agents [143]. <strong>Occupation</strong>al activities such as<br />
wood processing <strong>and</strong> agricultural work <strong>and</strong> jobs with<br />
high levels of exposure to electromagnetic fields, in<br />
particular the extremely low range (0 300 Hz), have<br />
10<br />
5<br />
<strong>Occupation</strong> <strong>and</strong> <strong>cancer</strong> in Nordic countries 757<br />
Denmark<br />
Finl<strong>and</strong><br />
Icel<strong>and</strong><br />
Norway<br />
Sweden<br />
Women<br />
0<br />
1945 1960 1975 1990 2005<br />
Figure 48. Age st<strong>and</strong>ardised (World) incidence rates for leukaemia 1943 2005, by country <strong>and</strong> gender. Modified from NORDCAN [49].
Acta Oncol Downloaded from informahealthcare.com by 212.35.100.66 on 04/06/11<br />
For personal use only.<br />
758 E. Pukkala et al.<br />
Table 74. Observed number of leukaemia among men in the Nordic countries <strong>and</strong> st<strong>and</strong>ardised incidence ratios 1961 2005, by country<br />
<strong>and</strong> occupational category.<br />
Denmark Finl<strong>and</strong> Icel<strong>and</strong> Norway Sweden Total<br />
No <strong>Occupation</strong>al category Obs SIR Obs SIR Obs SIR Obs SIR Obs SIR Obs SIR 95% CI<br />
1 Technical workers, etc 449 0.95 317 0.98 4 0.87 243 0.98 1 397 0.99 2 410 0.98 0.94*1.02<br />
2 Laboratory assistants 14 1.47 6 0.75 [0.83] 0.00 12 0.98 3 0.40 35 0.92 0.64*1.28<br />
3 Physicians 27 0.68 16 0.86 3 1.73 41 1.20 61 0.94 148 0.93 0.79*1.09<br />
4 Dentists 14 1.23 6 1.49 [0.46] 0.00 23 1.50 31 0.98 74 1.18 0.92*1.48<br />
5 Nurses [0.52] 0.00 [1.07] 0.00 [0.01] 0.00 1 0.71 1 0.23 2 0.28 0.03*0.99<br />
6 Assistant nurses 6 0.53 2 2.10 [0.22] 0.00 8 1.36 18 0.77 34 0.82 0.57*1.14<br />
7 ‘‘Other health workers’’ 36 1.05 13 0.71 [0.46] 0.00 15 1.14 54 0.99 118 0.98 0.82*1.17<br />
8 Teachers 233 1.13 122 0.92 7 1.08 179 0.96 374 1.02 915 1.02 0.95*1.08<br />
9 Religious workers etc 95 1.06 90 1.21 6 1.42 99 1.01 300 1.05 590 1.07 0.99*1.16<br />
10 Artistic workers 28 1.01 30 1.14 [1.14] 0.00 34 1.21 83 0.97 175 1.04 0.89*1.20<br />
11 Journalists 14 1.08 15 1.18 [0.64] 0.00 13 1.06 39 0.98 81 1.03 0.82*1.28<br />
12 Administrators 564 1.04 220 1.06 15 1.45 366 1.06 523 0.98 1 688 1.03 0.98*1.08<br />
13 Clerical workers 237 1.00 160 1.16 15 1.28 299 1.18 592 1.03 1 303 1.07 1.01*1.13<br />
14 Sales agents 140 1.13 215 1.11 6 1.02 347 1.15 899 1.07 1 607 1.10 1.05*1.15<br />
15 Shop workers 559 1.02 77 0.95 6 1.41 107 0.95 239 0.89 988 0.97 0.91*1.04<br />
16 Farmers 1 005 0.94 1 021 1.03 15 0.88 910 1.03 1 419 1.01 4 370 1.00 0.97*1.03<br />
17 Gardeners 157 1.04 126 0.93 [0.56] 0.00 204 0.97 505 0.97 992 0.97 0.91*1.04<br />
18 Fishermen 35 0.70 15 1.16 8 0.76 215 0.80 39 0.70 312 0.78 0.70*0.88<br />
19 Forestry workers 19 0.85 149 0.95 [0.09] 0.00 157 0.99 324 0.86 649 0.91 0.84*0.98<br />
20 Miners <strong>and</strong> quarry workers 5 0.73 36 1.43 [0.17] 0.00 33 0.77 97 1.04 171 1.02 0.87*1.18<br />
21 Seamen 39 0.74 38 1.13 2 0.71 176 0.84 88 1.07 343 0.90 0.81*1.00<br />
22 Transport workers 119 1.01 112 1.12 7 1.29 121 1.09 274 0.97 633 1.03 0.95*1.11<br />
23 Drivers 394 1.03 321 1.02 9 1.12 314 1.03 743 1.07 1 781 1.05 1.00*1.10<br />
24 Postal workers 76 1.04 43 0.88 [1.00] 0.00 55 0.91 146 0.95 320 0.95 0.85*1.06<br />
25 Textile workers 72 1.05 33 1.00 2 1.14 58 0.87 162 0.97 327 0.97 0.87*1.08<br />
26 Shoe <strong>and</strong> leather workers 13 0.76 9 0.62 [0.37] 0.00 27 0.94 68 1.04 117 0.93 0.78*1.11<br />
27 Smelting workers 147 0.98 50 1.01 2 0.82 83 0.94 256 0.97 538 0.97 0.89*1.05<br />
28 Mechanics 383 0.94 300 0.95 5 0.62 401 0.95 1 261 1.00 2 350 0.97 0.94*1.02<br />
29 Plumbers 38 1.05 49 0.94 [1.29] 0.00 49 1.02 131 0.90 267 0.95 0.84*1.07<br />
30 Welders 59 1.21 [0.49] 0.00 49 0.93 186 1.11 294 1.09 0.97*1.23<br />
31 Electrical workers 104 1.10 131 0.99 5 1.04 197 1.06 439 1.00 876 1.02 0.96*1.09<br />
32 Wood workers 258 0.91 337 0.98 4 0.89 466 0.93 833 1.00 1 898 0.96 0.92*1.01<br />
33 Painters 83 0.90 78 1.09 1 0.57 85 1.01 228 0.94 475 0.97 0.88*1.06<br />
34 ‘‘Other construction workers’’ 367 1.02 205 0.92 7 0.76 96 0.98 451 1.01 1 126 0.99 0.93*1.05<br />
35 Bricklayers 106 1.04 35 0.98 49 0.99 103 0.95 293 0.99 0.88*1.11<br />
36 Printers 57 0.89 20 0.63 1 0.67 50 1.00 139 1.05 267 0.96 0.85*1.08<br />
37 Chemical process workers 48 0.79 49 0.92 1 1.23 130 1.15 219 1.10 447 1.05 0.95*1.15<br />
38 Food workers 210 1.08 40 1.03 9 1.30 137 1.08 204 1.00 600 1.05 0.97*1.14<br />
39 Beverage workers 28 1.16 2 0.76 1 8.09 1 0.80 12 1.07 44 1.12 0.81*1.50<br />
40 Tobacco workers 5 1.25 [0.46] 0.00 [0.01] 0.00 4 2.02 [0.91] 0.00 9 1.22 0.56*2.32<br />
41 Glass makers etc 115 0.99 31 0.55 2 1.58 59 0.97 233 1.05 440 0.97 0.88*1.06<br />
42 Packers 101 0.97 107 0.91 6 1.52 182 0.95 383 0.97 779 0.96 0.89*1.03<br />
43 Engine operators 108 1.05 146 0.95 8 1.44 114 1.08 356 1.05 732 1.04 0.96*1.11<br />
44 Public safety workers 101 1.05 107 1.18 5 1.28 101 1.24 209 1.04 523 1.11 1.02*1.21<br />
45 Cooks <strong>and</strong> stewards 6 0.80 5 0.88 3 1.61 28 0.79 39 1.07 81 0.93 0.74*1.16<br />
46 Domestic assistants [0.08] 0.00 [0.42] 0.00 [0.01] 0.00 [0.29] 0.00 4 1.12 4 0.91 0.25*2.34<br />
47 Waiters 18 1.12 6 1.10 [0.20] 0.00 21 1.37 21 1.13 66 1.19 0.92*1.51<br />
48 Building caretakers 111 1.07 85 1.08 1 0.61 40 0.94 166 1.06 403 1.05 0.95*1.16<br />
49 Chimney sweeps 1 0.38 7 1.24 5 1.19 11 0.97 24 1.01 0.65*1.50<br />
50 Hairdressers 25 0.84 1 0.61 [0.27] 0.00 13 1.06 33 0.84 72 0.86 0.68*1.09<br />
51 Launderers 7 0.48 1 0.61 1 6.38 6 0.82 22 0.78 37 0.71 0.50*0.99<br />
52 Military personnel 51 1.06 35 1.25 63 0.97 131 1.10 280 1.08 0.96*1.21<br />
53 ‘‘Other workers’’ 360 1.14 89 0.96 10 0.65 364 0.98 465 0.97 1 288 1.01 0.96*1.07<br />
54 Economically inactive 349 1.07 522 0.96 11 0.99 183 0.90 721 0.98 1 786 0.98 0.94*1.03<br />
1 54 All categories 7 537 1.00 5 689 1.00 188 1.00 7 033 1.00 15 735 1.00 36 182 1.00 Ref.<br />
Obs observed number of cases; SIR st<strong>and</strong>ardised incidence ratio; 95% CI 95% confidence interval.
Acta Oncol Downloaded from informahealthcare.com by 212.35.100.66 on 04/06/11<br />
For personal use only.<br />
Table 75. Observed number of leukaemia among women in the Nordic countries <strong>and</strong> st<strong>and</strong>ardised incidence ratios 1961 2005, by country<br />
<strong>and</strong> occupational category.<br />
Denmark Finl<strong>and</strong> Icel<strong>and</strong> Norway Sweden Total<br />
No <strong>Occupation</strong>al category Obs SIR Obs SIR Obs SIR Obs SIR Obs SIR Obs SIR 95% CI<br />
1 Technical workers, etc 12 0.71 24 0.99 [0.45] 0.00 5 0.79 53 1.04 94 0.95 0.77*1.16<br />
2 Laboratory assistants 9 0.77 26 1.89 1 1.52 6 0.73 12 0.84 54 1.11 0.83*1.45<br />
3 Physicians 4 0.71 3 0.51 [0.12] 0.00 6 1.72 16 1.37 29 1.08 0.72*1.55<br />
4 Dentists 4 0.80 6 0.86 [0.04] 0.00 2 0.65 7 0.77 19 0.79 0.47*1.23<br />
5 Nurses 105 1.05 53 0.76 4 1.33 59 0.94 156 1.02 377 0.97 0.88*1.07<br />
6 Assistant nurses 79 1.12 73 0.99 3 0.71 58 0.94 283 1.05 496 1.04 0.95*1.13<br />
7 ‘‘Other health workers’’ 64 1.12 72 1.24 1 1.10 51 0.79 94 1.04 282 1.04 0.93*1.17<br />
8 Teachers 128 1.04 153 1.16 5 0.89 125 1.00 331 0.96 742 1.02 0.95*1.09<br />
9 Religious workers etc 25 1.49 57 0.94 2 2.36 29 0.95 126 1.09 239 1.07 0.94*1.21<br />
10 Artistic workers 7 0.78 10 0.95 [0.65] 0.00 7 0.72 26 1.18 50 0.96 0.72*1.27<br />
11 Journalists [1.86] 0.00 12 1.76 [0.16] 0.00 [2.44] 0.00 10 0.98 22 1.02 0.64*1.55<br />
12 Administrators 51 0.96 25 1.09 1 2.07 25 0.78 48 0.95 150 0.94 0.80*1.11<br />
13 Clerical workers 492 0.98 422 1.00 19 1.18 389 0.98 913 1.08 2 235 1.03 0.98*1.07<br />
14 Sales agents 3 0.64 60 0.90 3 1.74 74 1.18 121 1.01 261 1.02 0.90*1.15<br />
15 Shop workers 347 0.99 240 1.02 11 1.09 323 0.95 535 1.03 1 456 1.00 0.95*1.05<br />
16 Farmers 238 0.98 170 1.03 5 0.66 251 1.01 40 0.84 704 0.99 0.92*1.06<br />
17 Gardeners 46 1.45 447 0.99 1 3.70 155 1.06 141 1.04 790 1.03 0.96*1.11<br />
18 Fishermen 3 2.44 [0.95] 0.00 [0.27] 0.00 2 1.19 1 2.23 6 1.31 0.48*2.85<br />
19 Forestry workers 1 3.11 2 1.10 [0.03] 0.00 1 0.40 2 0.68 6 0.79 0.29*1.71<br />
20 Miners <strong>and</strong> quarry workers [0.02] 0.00 1 1.22 [0.01] 0.00 [0.12] 0.00 [0.70] 0.00 1 0.60 0.02*3.32<br />
21 Seamen [0.21] 0.00 [0.00] 0.00 1 2.56 [0.09] 0.00 1 1.46 0.04*8.11<br />
22 Transport workers [0.35] 0.00 14 1.16 1 3.39 2 1.13 4 0.47 21 0.92 0.57*1.40<br />
23 Drivers 12 1.39 3 0.58 [0.12] 0.00 5 0.75 27 1.33 47 1.15 0.84*1.53<br />
24 Postal workers 18 0.98 62 0.86 2 0.62 67 0.84 160 1.08 309 0.96 0.86*1.08<br />
25 Textile workers 120 1.03 146 0.89 8 1.21 114 0.83 273 0.90 661 0.91 0.84*0.98<br />
26 Shoe <strong>and</strong> leather workers 8 0.94 20 0.99 [0.38] 0.00 13 1.34 17 0.73 58 0.94 0.71*1.21<br />
27 Smelting workers [2.09] 0.00 3 0.63 [0.01] 0.00 1 1.12 4 0.64 8 0.57 0.25*1.13<br />
28 Mechanics 20 0.99 16 0.77 [0.05] 0.00 11 1.00 63 1.00 110 0.96 0.79*1.15<br />
29 Plumbers 2 9.22 [0.04] 0.00 [0.07] 0.00 [0.09] 0.00 2 4.71 0.57*17.02<br />
30 Welders [1.53] 0.00 [0.01] 0.00 1 1.43 4 1.66 5 1.08 0.35*2.52<br />
31 Electrical workers 33 1.17 15 1.18 1 17.04 11 0.95 39 1.10 99 1.13 0.92*1.37<br />
32 Wood workers 9 0.95 38 0.91 [0.11] 0.00 2 0.54 12 1.14 61 0.93 0.71*1.19<br />
33 Painters [0.37] 0.00 4 0.82 [0.03] 0.00 [0.86] 0.00 2 0.70 6 0.67 0.25*1.46<br />
34 ‘‘Other construction workers’’ [0.29] 0.00 15 0.86 [0.02] 0.00 [0.34] 0.00 [0.36] 0.00 15 0.81 0.45*1.34<br />
35 Bricklayers [0.06] 0.00 [0.56] 0.00 [0.02] 0.00 [0.01] 0.00 [0.65] 0.00 0.00*5.71<br />
36 Printers 4 0.37 17 0.83 [0.55] 0.00 12 1.08 28 1.06 61 0.88 0.67*1.13<br />
37 Chemical process workers 19 1.10 15 1.40 [0.23] 0.00 8 0.81 25 1.19 67 1.13 0.88*1.44<br />
38 Food workers 81 0.97 62 1.11 17 1.28 52 0.80 58 0.92 270 0.96 0.85*1.08<br />
39 Beverage workers 9 1.11 2 0.62 [0.03] 0.00 [0.51] 0.00 6 1.51 17 1.08 0.63*1.72<br />
40 Tobacco workers 18 1.63 1 0.56 2 0.84 2 0.81 23 1.30 0.82*1.95<br />
41 Glass makers etc 18 0.89 39 1.01 [0.38] 0.00 21 1.01 57 1.02 135 0.99 0.84*1.17<br />
42 Packers 4 0.68 88 1.29 3 2.32 49 0.98 89 1.06 233 1.11 0.98*1.26<br />
43 Engine operators [0.15] 0.00 9 0.83 [0.02] 0.00 1 1.67 5 0.95 15 0.89 0.50*1.46<br />
44 Public safety workers [0.71] 0.00 4 1.55 [0.28] 0.00 8 1.27 3 0.42 15 0.88 0.49*1.45<br />
45 Cooks <strong>and</strong> stewards [0.23] 0.00 85 1.08 7 1.37 76 1.00 128 1.04 296 1.05 0.93*1.17<br />
46 Domestic assistants 121 0.92 70 0.86 1 0.66 203 1.04 326 1.00 721 0.98 0.91*1.06<br />
47 Waiters 22 0.99 59 0.93 [0.53] 0.00 72 0.94 109 0.86 262 0.90 0.80*1.02<br />
48 Building caretakers 369 0.96 266 0.98 7 0.69 347 1.08 342 1.04 1 331 1.01 0.96*1.07<br />
49 Chimney sweeps [0.04] 0.00 [0.13] 0.00 [0.04] 0.00 [0.01] 0.00 [0.22] 0.00 0.00*16.88<br />
50 Hairdressers 19 0.84 18 0.74 [0.60] 0.00 19 0.96 48 0.89 104 0.86 0.71*1.04<br />
51 Launderers 48 1.11 16 0.73 [1.65] 0.00 23 0.77 80 1.21 167 1.03 0.88*1.19<br />
52 Military personnel [0.22] 0.00 [0.20] 0.00 [0.08] 0.00 [0.22] 0.00 [0.72] 0.00 0.00*5.12<br />
53 ‘‘Other workers’’ 107 0.99 82 1.00 7 0.69 159 0.96 156 1.06 511 0.99 0.91*1.08<br />
54 Economically inactive 2 992 1.00 1 957 1.01 37 1.00 2 572 1.03 6 614 0.98 14 172 1.00 0.98*1.02<br />
1 54 All categories 5 671 1.00 4 982 1.00 147 1.00 5 420 1.00 11 596 1.00 27 816 1.00 Ref.<br />
Obs observed number of cases; SIR st<strong>and</strong>ardised incidence ratio; 95% CI 95% confidence interval.<br />
<strong>Occupation</strong> <strong>and</strong> <strong>cancer</strong> in Nordic countries 759
Acta Oncol Downloaded from informahealthcare.com by 212.35.100.66 on 04/06/11<br />
For personal use only.<br />
760 E. Pukkala et al.<br />
also been associated with AML in earlier studies<br />
[144], but it is hard to observe any effects of these<br />
factors from the present results. Drivers <strong>and</strong> sales<br />
agents, who had significantly elevated SIRs for AML<br />
in the present study have also been previously<br />
reported to have a somewhat elevated risk of AML<br />
[143,145].<br />
Mycosis fungoides<br />
Mycosis fungoides is a cutaneous T-cell lymphoma<br />
which represents a spectrum of lymphoproliferative<br />
disorders that affect the skin. It is a rare <strong>cancer</strong> with<br />
a total of 3 634 cases included in the present study.<br />
Cooks <strong>and</strong> stewards represented a high risk group<br />
among men with an SIR of 2.65 (95% CI 1.37 4.63).<br />
Gardeners (0.67, 0.49 0.89) were at the bottom<br />
together with ‘‘other construction workers’’ <strong>and</strong><br />
farmers (Table 76). In women, farmers were at a<br />
deficit risk (0.36, 0.15 0.75; Table 77).<br />
Comment. The aetiology of mycosis fungoides is<br />
poorly understood, <strong>and</strong> infectious agents may be<br />
involved. Previous occupational studies have indicated<br />
a possible association with men working in the<br />
industries of non-metallic mineral products, wholesale<br />
trade, glass formers, potters, <strong>and</strong> ceramics<br />
workers <strong>and</strong> technical salesmen. A high risk was<br />
found for female employees in the sector of pulp<br />
paper manufacture, government executives <strong>and</strong> railway<br />
<strong>and</strong> road vehicles loaders [146].<br />
An earlier study also indicated an increased risk<br />
among women in Sweden working in agriculture <strong>and</strong><br />
textile industries, housekeepers, <strong>and</strong> post office<br />
employees [147]. The present study did not pick<br />
up any of the occupational categories reported to<br />
have had excess risk in the earlier studies.<br />
Other <strong>and</strong> unknown <strong>cancer</strong> sites<br />
The category of ‘‘other <strong>and</strong> unknown <strong>cancer</strong>s’’ (199<br />
in ICD 7) includes few <strong>cancer</strong>s of other specific<br />
organs not included in any other ICD category, but<br />
mainly <strong>cancer</strong>s with an unspecified primary site.<br />
Incidence of <strong>cancer</strong>s classified to this category has<br />
been quite stable over several decades <strong>and</strong> similar in<br />
both genders, e.g. in Finl<strong>and</strong> about 5 <strong>and</strong> in Sweden<br />
about 7 per 100 000 person-years [148,149]. The<br />
proportion of an unknown primary site was 2 4% in<br />
all Nordic countries in 1998 2002 [150].<br />
Tobacco workers had the highest non-significant<br />
SIR (1.73, 95% CI 0.86 3.09) <strong>and</strong> waiters the<br />
highest significant SIR (1.49, 1.19 1.84) of unspecified<br />
<strong>cancer</strong> among the men, followed by cooks <strong>and</strong><br />
stewards, hairdressers, seamen <strong>and</strong> assistant nurses.<br />
The SIR was low among the physicians (0.68, 0.57<br />
0.82), teachers <strong>and</strong> farmers (Table 78).<br />
In women (Table 79), significantly high SIRs were<br />
observed among ‘‘other construction workers’’<br />
(1.45, 1.02 2.00; dominated by the finding in Finl<strong>and</strong>),<br />
chemical process workers, <strong>and</strong> waiters. The<br />
SIR was low among physicians (0.66, 0.43 0.97),<br />
artistic workers, teachers, <strong>and</strong> nurses.<br />
Comment. In a previous study in Finl<strong>and</strong> covering<br />
the 1970s <strong>and</strong> early 1980s, there appeared to be<br />
two types of persons with an excess of unspecified<br />
<strong>cancer</strong>s: persons with a low level of awareness<br />
about <strong>cancer</strong> who may have gone to the doctor<br />
with an already advanced stage of disease, consequently<br />
receiving less specialised medical care <strong>and</strong><br />
a delayed diagnosis, <strong>and</strong> persons with a predominantly<br />
high living st<strong>and</strong>ard who purposely did not<br />
want to have their <strong>cancer</strong> diagnosed [6]. It was<br />
also reported that the socioeconomic differences in<br />
the incidence of unspecified <strong>cancer</strong> were decreasing<br />
over time.<br />
In the present study series this is not as evident,<br />
apart from the finding related to physicians who<br />
had the lowest SIR in both genders. Otherwise,<br />
most of the categories with the highest <strong>and</strong> lowest<br />
incidence of unspecified <strong>cancer</strong>s also have similar<br />
rates for all <strong>cancer</strong>s combined (see next chapter).<br />
Hence, the likelihood of getting a proper <strong>cancer</strong><br />
diagnosis, or having the <strong>cancer</strong> diagnosed before it<br />
is so spread in the body that the origin cannot be<br />
defined any more, seems not to vary markedly<br />
between most occupations.<br />
All <strong>cancer</strong> sites combined<br />
The age-adjusted incidence of all <strong>cancer</strong>s combined<br />
(excluding non-melanoma skin <strong>cancer</strong>) has been<br />
slowly increasing for several decades in all Nordic<br />
countries (Figure 49). The speed of growth has been<br />
highest in Norway <strong>and</strong> lowest in Finl<strong>and</strong>. The rates<br />
for men in Finl<strong>and</strong> have been markedly higher than<br />
for women, while in the other Nordic countries there<br />
is no large difference between the gender-specific<br />
rates.<br />
In men, high SIRs were observed among waiters<br />
(1.48, 95% CI 1.43 1.54), beverage manufacture<br />
workers, tobacco manufacture workers, seamen,<br />
chimney sweeps <strong>and</strong> cooks <strong>and</strong> stewards. The SIRs<br />
were lowest among domestic assistants (0.79, 0.66<br />
0.95), farmers, forestry workers <strong>and</strong> gardeners. The<br />
variation in incidence between Danish men was<br />
larger <strong>and</strong> among Finnish men smaller than in<br />
the other Nordic countries (Table 80).
Acta Oncol Downloaded from informahealthcare.com by 212.35.100.66 on 04/06/11<br />
For personal use only.<br />
Table 76. Observed number of mycosis fungoides among men in the Nordic countries <strong>and</strong> st<strong>and</strong>ardised incidence ratios 1961 2005, by<br />
country <strong>and</strong> occupational category.<br />
Denmark Finl<strong>and</strong> Icel<strong>and</strong> Norway Sweden Total<br />
No <strong>Occupation</strong>al category Obs SIR Obs SIR Obs SIR Obs SIR Obs SIR Obs SIR 95% CI<br />
1 Technical workers, etc 12 0.90 13 0.98 [0.30] 0.00 13 1.78 96 0.88 134 0.93 0.79*1.11<br />
2 Laboratory assistants [0.26] 0.00 [0.33] 0.00 [0.05] 0.00 [0.35] 0.00 [0.33] 0.00 [1.32] 0.00 0.00*2.78<br />
3 Physicians 1 0.88 [0.77] 0.00 [0.10] 0.00 2 2.13 9 1.85 12 1.54 0.80*2.69<br />
4 Dentists 1 3.23 [0.16] 0.00 [0.03] 0.00 [0.41] 0.00 2 0.77 3 0.86 0.18*2.51<br />
5 Nurses [0.01] 0.00 [0.04] 0.00 [0.00] 0.00 [0.04] 0.00 [0.17] 0.00 [0.27] 0.00 0.00*13.49<br />
6 Assistant nurses [0.31] 0.00 [0.04] 0.00 [0.01] 0.00 [0.16] 0.00 2 1.08 2 0.84 0.10*3.05<br />
7 ‘‘Other health workers’’ [0.97] 0.00 1 1.36 [0.02] 0.00 1 2.74 2 0.45 4 0.61 0.17*1.57<br />
8 Teachers 9 1.57 4 0.72 [0.39] 0.00 3 0.58 29 1.09 45 1.03 0.75*1.38<br />
9 Religious workers etc 5 1.95 5 1.67 [0.24] 0.00 4 1.48 27 1.25 41 1.36 0.98*1.85<br />
10 Artistic workers 1 1.28 1 0.95 1 15.32 1 1.27 5 0.73 9 0.94 0.43*1.78<br />
11 Journalists [0.36] 0.00 2 3.82 [0.04] 0.00 [0.35] 0.00 2 0.59 4 0.86 0.23*2.20<br />
12 Administrators 14 0.90 11 1.30 [0.56] 0.00 8 0.86 60 1.22 93 1.12 0.91*1.37<br />
13 Clerical workers 5 0.77 5 0.92 1 1.73 9 1.27 44 0.85 64 0.90 0.69*1.15<br />
14 Sales agents 4 1.18 6 0.77 [0.32] 0.00 7 0.86 86 1.16 103 1.10 0.91*1.33<br />
15 Shop workers 15 0.97 7 2.06 [0.22] 0.00 2 0.62 21 0.93 45 1.00 0.73*1.34<br />
16 Farmers 16 0.51 32 0.88 [0.82] 0.00 17 0.78 147 0.94 212 0.86 0.75*0.98<br />
17 Gardeners 1 0.23 1 0.19 [0.03] 0.00 2 0.35 43 0.79 47 0.67 0.49*0.89<br />
18 Fishermen 2 1.47 1 2.13 [0.64] 0.00 7 0.99 3 0.50 13 0.84 0.45*1.43<br />
19 Forestry workers [0.65] 0.00 12 1.88 [0.00] 0.00 1 0.25 33 0.83 46 0.90 0.66*1.20<br />
20 Miners <strong>and</strong> quarry workers [0.19] 0.00 1 0.97 [0.01] 0.00 4 3.43 14 1.46 19 1.58 0.95*2.47<br />
21 Seamen 3 2.13 [1.36] 0.00 1 6.33 5 0.84 11 1.37 20 1.18 0.72*1.83<br />
22 Transport workers 1 0.29 4 0.98 [0.29] 0.00 3 0.97 19 0.81 27 0.79 0.52*1.15<br />
23 Drivers 14 1.35 12 0.92 [0.48] 0.00 6 0.70 63 1.05 95 1.03 0.83*1.26<br />
24 Postal workers 3 1.50 1 0.52 [0.05] 0.00 2 1.25 17 1.20 23 1.16 0.74*1.75<br />
25 Textile workers 4 2.06 1 0.79 [0.07] 0.00 1 0.57 22 1.26 28 1.24 0.83*1.80<br />
26 Shoe <strong>and</strong> leather workers 2 4.16 [0.55] 0.00 [0.01] 0.00 [0.73] 0.00 9 1.14 11 1.14 0.57*2.04<br />
27 Smelting workers 5 1.24 2 1.02 [0.12] 0.00 4 1.67 22 0.81 33 0.93 0.64*1.30<br />
28 Mechanics 15 1.36 7 0.55 [0.46] 0.00 14 1.18 119 1.10 155 1.08 0.92*1.26<br />
29 Plumbers 1 1.02 1 0.46 [0.07] 0.00 1 0.73 7 0.56 10 0.58 0.28*1.07<br />
30 Welders 2 0.96 [0.03] 0.00 1 0.63 16 1.27 19 1.17 0.70*1.83<br />
31 Electrical workers 3 1.19 6 1.10 2 7.23 2 0.38 31 0.89 44 0.91 0.66*1.22<br />
32 Wood workers 4 0.51 15 1.12 [0.23] 0.00 12 0.89 92 1.09 123 1.03 0.86*1.23<br />
33 Painters 4 1.56 5 1.77 [0.10] 0.00 2 0.89 22 0.94 33 1.06 0.73*1.49<br />
34 ‘‘Other construction workers’’ 5 0.50 6 0.69 1 1.97 1 0.37 37 0.79 50 0.73 0.54*0.96<br />
35 Bricklayers 2 0.71 1 0.72 1 0.74 12 1.10 16 0.97 0.55*1.57<br />
36 Printers [1.72] 0.00 1 0.77 [0.09] 0.00 4 2.93 15 1.29 20 1.24 0.76*1.92<br />
37 Chemical process workers 3 1.75 2 0.92 [0.04] 0.00 8 2.68 25 1.18 38 1.35 0.96*1.85<br />
38 Food workers 6 1.11 2 1.28 [0.31] 0.00 5 1.46 18 0.92 31 1.02 0.69*1.45<br />
39 Beverage workers 2 3.10 [0.10] 0.00 [0.01] 0.00 [0.04] 0.00 3 2.23 5 2.34 0.76*5.46<br />
40 Tobacco workers [0.11] 0.00 [0.02] 0.00 [0.00] 0.00 [0.05] 0.00 [0.08] 0.00 [0.27] 0.00 0.00*13.79<br />
41 Glass makers etc 5 1.54 [2.27] 0.00 [0.06] 0.00 4 2.39 18 0.84 27 0.94 0.62*1.36<br />
42 Packers 3 1.04 7 1.51 [0.17] 0.00 7 1.37 50 1.15 67 1.19 0.92*1.51<br />
43 Engine operators 2 0.71 9 1.40 1 3.21 5 1.69 30 0.98 47 1.09 0.80*1.45<br />
44 Public safety workers 6 2.07 2 0.55 [0.21] 0.00 3 1.35 14 0.84 25 0.97 0.63*1.43<br />
45 Cooks <strong>and</strong> stewards [0.20] 0.00 [0.23] 0.00 [0.11] 0.00 3 3.00 9 3.00 12 2.65 1.37*4.63<br />
46 Domestic assistants [0.00] 0.00 [0.01] 0.00 [0.00] 0.00 [0.01] 0.00 [0.22] 0.00 [0.24] 0.00 0.00*15.06<br />
47 Waiters [0.41] 0.00 [0.21] 0.00 [0.01] 0.00 1 2.34 2 1.26 3 1.13 0.23*3.30<br />
48 Building caretakers 5 1.72 4 1.32 [0.06] 0.00 1 0.90 19 1.14 29 1.22 0.82*1.75<br />
49 Chimney sweeps [0.07] 0.00 [0.23] 0.00 [0.12] 0.00 3 2.96 3 2.10 0.43*6.14<br />
50 Hairdressers 1 1.17 [0.06] 0.00 [0.02] 0.00 [0.33] 0.00 4 1.05 5 0.98 0.32*2.29<br />
51 Launderers [0.41] 0.00 [0.06] 0.00 [0.01] 0.00 [0.20] 0.00 3 1.11 3 0.88 0.18*2.59<br />
52 Military personnel [1.30] 0.00 3 2.42 4 2.11 7 0.81 14 1.07 0.59*1.80<br />
53 ‘‘Other workers’’ 13 1.53 6 1.67 2 2.58 4 0.42 48 0.92 73 0.98 0.76*1.23<br />
54 Economically inactive 12 1.51 20 1.17 1 1.81 4 0.90 94 1.01 131 1.07 0.90*1.26<br />
1 54 All categories 210 1.00 221 1.00 10 1.00 189 1.00 1 486 1.00 2 116 1.00 Ref.<br />
Obs observed number of cases; SIR st<strong>and</strong>ardised incidence ratio; 95% CI 95% confidence interval.<br />
<strong>Occupation</strong> <strong>and</strong> <strong>cancer</strong> in Nordic countries 761
Acta Oncol Downloaded from informahealthcare.com by 212.35.100.66 on 04/06/11<br />
For personal use only.<br />
762 E. Pukkala et al.<br />
Table 77. Observed number of mycosis fungoides among women in the Nordic countries <strong>and</strong> st<strong>and</strong>ardised incidence ratios 1961 2005, by<br />
country <strong>and</strong> occupational category.<br />
Denmark Finl<strong>and</strong> Icel<strong>and</strong> Norway Sweden Total<br />
No <strong>Occupation</strong>al category Obs SIR Obs SIR Obs SIR Obs SIR Obs SIR Obs SIR 95% CI<br />
1 Technical workers, etc 1 2.72 [0.90] 0.00 [0.03] 0.00 [0.16] 0.00 [3.43] 0.00 1 0.20 0.01*1.14<br />
2 Laboratory assistants [0.27] 0.00 [0.44] 0.00 [0.03] 0.00 1 5.19 1 2.80 2 1.54 0.19*5.57<br />
3 Physicians [0.12] 0.00 1 4.34 [0.00] 0.00 [0.08] 0.00 1 1.63 2 1.91 0.23*6.89<br />
4 Dentists 1 9.28 [0.20] 0.00 [0.00] 0.00 [0.06] 0.00 [0.66] 0.00 1 0.98 0.02*5.44<br />
5 Nurses 3 1.41 1 0.43 [0.11] 0.00 1 0.66 10 0.91 15 0.88 0.49*1.45<br />
6 Assistant nurses 2 1.28 2 0.93 1 5.56 3 1.96 22 1.26 30 1.31 0.89*1.88<br />
7 ‘‘Other health workers’’ 2 1.63 2 1.10 [0.04] 0.00 4 2.71 8 1.44 16 1.58 0.90*2.56<br />
8 Teachers 4 1.46 5 1.26 [0.21] 0.00 3 1.05 17 0.70 29 0.85 0.57*1.23<br />
9 Religious workers etc 1 2.72 2 0.84 [0.03] 0.00 [0.72] 0.00 6 0.89 9 0.88 0.40*1.66<br />
10 Artistic workers [0.18] 0.00 [0.35] 0.00 [0.02] 0.00 1 4.69 3 1.95 4 1.73 0.47*4.43<br />
11 Journalists [0.04] 0.00 [0.21] 0.00 [0.01] 0.00 [0.06] 0.00 1 1.51 1 1.02 0.03*5.68<br />
12 Administrators [1.10] 0.00 1 1.30 [0.01] 0.00 1 1.43 3 0.82 5 0.80 0.26*1.87<br />
13 Clerical workers 13 1.18 24 1.82 [0.64] 0.00 7 0.79 48 0.80 92 0.98 0.79*1.21<br />
14 Sales agents [0.10] 0.00 3 1.63 [0.04] 0.00 1 0.86 14 1.20 18 1.21 0.72*1.92<br />
15 Shop workers 6 0.81 12 1.91 [0.31] 0.00 10 1.37 49 1.03 77 1.12 0.88*1.40<br />
16 Farmers 2 0.38 3 0.78 [0.16] 0.00 2 0.41 [5.25] 0.00 7 0.36 0.15*0.75<br />
17 Gardeners 1 1.48 11 1.06 [0.01] 0.00 1 0.34 14 1.06 27 0.99 0.65*1.44<br />
18 Fishermen [0.03] 0.00 [0.03] 0.00 [0.01] 0.00 [0.04] 0.00 [0.04] 0.00 [0.14] 0.00 0.00*26.15<br />
19 Forestry workers [0.01] 0.00 [0.05] 0.00 [0.00] 0.00 [0.06] 0.00 [0.25] 0.00 [0.36] 0.00 0.00*10.37<br />
20 Miners <strong>and</strong> quarry workers [0.00] 0.00 [0.02] 0.00 [0.00] 0.00 [0.00] 0.00 [0.05] 0.00 [0.07] 0.00 0.00*53.66<br />
21 Seamen [0.01] 0.00 [0.00] 0.00 [0.01] 0.00 [0.00] 0.00 [0.02] 0.00 0.00*183.02<br />
22 Transport workers [0.01] 0.00 [0.29] 0.00 [0.00] 0.00 [0.04] 0.00 [0.69] 0.00 [1.04] 0.00 0.00*3.54<br />
23 Drivers [0.18] 0.00 [0.16] 0.00 [0.00] 0.00 1 6.58 [1.35] 0.00 1 0.54 0.01*3.00<br />
24 Postal workers 1 2.59 2 1.06 2 26.22 3 1.80 9 0.73 17 1.04 0.60*1.66<br />
25 Textile workers 2 0.81 6 1.44 [0.12] 0.00 2 0.79 35 1.07 45 1.07 0.78*1.43<br />
26 Shoe <strong>and</strong> leather workers 1 5.46 [0.51] 0.00 [0.01] 0.00 1 5.41 2 0.81 4 1.19 0.32*3.05<br />
27 Smelting workers [0.04] 0.00 [0.12] 0.00 [0.00] 0.00 [0.02] 0.00 1 2.41 1 1.67 0.04*9.28<br />
28 Mechanics 1 2.25 [0.57] 0.00 [0.00] 0.00 [0.24] 0.00 1 0.20 2 0.32 0.04*1.17<br />
29 Plumbers [0.00] 0.00 [0.00] 0.00 [0.00] 0.00 [0.00] 0.00 [0.01] 0.00 0.00*363.67<br />
30 Welders [0.05] 0.00 [0.00] 0.00 [0.02] 0.00 1 8.54 1 5.48 0.14*30.51<br />
31 Electrical workers [0.62] 0.00 1 2.41 [0.00] 0.00 [0.26] 0.00 2 0.75 3 0.76 0.16*2.22<br />
32 Wood workers [0.21] 0.00 2 1.96 [0.00] 0.00 [0.09] 0.00 [0.73] 0.00 2 0.98 0.12*3.53<br />
33 Painters [0.01] 0.00 [0.13] 0.00 [0.00] 0.00 [0.02] 0.00 [0.23] 0.00 [0.38] 0.00 0.00*9.66<br />
34 ‘‘Other construction workers’’ [0.01] 0.00 1 2.54 [0.00] 0.00 [0.01] 0.00 [0.02] 0.00 1 2.36 0.06*13.13<br />
35 Bricklayers [0.00] 0.00 [0.01] 0.00 [0.00] 0.00 [0.00] 0.00 [0.02] 0.00 0.00*230.45<br />
36 Printers [0.23] 0.00 [0.56] 0.00 [0.02] 0.00 1 4.54 1 0.42 2 0.58 0.07*2.11<br />
37 Chemical process workers [0.36] 0.00 [0.27] 0.00 [0.00] 0.00 [0.20] 0.00 4 2.04 4 1.43 0.39*3.66<br />
38 Food workers 2 1.11 1 0.72 [0.36] 0.00 [1.27] 0.00 3 0.45 6 0.52 0.19*1.14<br />
39 Beverage workers 1 6.04 [0.08] 0.00 [0.00] 0.00 [0.01] 0.00 1 2.18 2 2.80 0.34*10.13<br />
40 Tobacco workers [0.23] 0.00 [0.04] 0.00 [0.04] 0.00 [0.21] 0.00 [0.53] 0.00 0.00*7.02<br />
41 Glass makers etc 1 2.28 [1.00] 0.00 [0.01] 0.00 1 2.33 7 1.40 9 1.31 0.60*2.48<br />
42 Packers [0.13] 0.00 5 2.86 [0.03] 0.00 [1.04] 0.00 4 0.51 9 0.83 0.38*1.57<br />
43 Engine operators [0.00] 0.00 [0.29] 0.00 [0.00] 0.00 [0.02] 0.00 1 3.89 1 1.77 0.04*9.86<br />
44 Public safety workers [0.01] 0.00 [0.08] 0.00 [0.01] 0.00 [0.13] 0.00 1 2.46 1 1.57 0.04*8.76<br />
45 Cooks <strong>and</strong> stewards [0.00] 0.00 [2.08] 0.00 [0.10] 0.00 1 0.72 11 0.79 12 0.68 0.35*1.19<br />
46 Domestic assistants 1 0.36 2 0.84 [0.02] 0.00 3 0.83 35 1.13 41 1.03 0.74*1.40<br />
47 Waiters [0.47] 0.00 3 1.70 [0.02] 0.00 [1.57] 0.00 9 0.70 12 0.72 0.37*1.26<br />
48 Building caretakers 6 0.75 4 0.59 [0.19] 0.00 8 1.19 34 1.05 52 0.96 0.72*1.26<br />
49 Chimney sweeps [0.00] 0.00 [0.00] 0.00 [0.00] 0.00 [0.00] 0.00 [0.01] 0.00 0.00*673.62<br />
50 Hairdressers [0.49] 0.00 1 1.44 [0.03] 0.00 [0.42] 0.00 5 1.18 6 1.02 0.37*2.22<br />
51 Launderers 2 2.22 1 1.96 [0.03] 0.00 [0.56] 0.00 5 0.66 8 0.84 0.36*1.65<br />
52 Military personnel [0.00] 0.00 [0.01] 0.00 [0.00] 0.00 [0.00] 0.00 [0.02] 0.00 0.00*191.22<br />
53 ‘‘Other workers’’ 4 1.76 [2.22] 0.00 [0.27] 0.00 3 0.85 11 0.80 18 0.82 0.48*1.29<br />
54 Economically inactive 58 0.99 31 0.70 1 1.15 43 1.05 789 1.04 922 1.02 0.96*1.09<br />
1 54 All categories 116 1.00 127 1.00 4 1.00 102 1.00 1 169 1.00 1 518 1.00 Ref.<br />
Obs observed number of cases; SIR st<strong>and</strong>ardised incidence ratio; 95% CI 95% confidence interval.
Acta Oncol Downloaded from informahealthcare.com by 212.35.100.66 on 04/06/11<br />
For personal use only.<br />
Table 78. Observed number of other/unknown site among men in the Nordic countries <strong>and</strong> st<strong>and</strong>ardised incidence ratios 1961 2005, by<br />
country <strong>and</strong> occupational category.<br />
Denmark Finl<strong>and</strong> Icel<strong>and</strong> Norway Sweden Total<br />
No <strong>Occupation</strong>al category Obs SIR Obs SIR Obs SIR Obs SIR Obs SIR Obs SIR 95% CI<br />
1 Technical workers, etc 166 0.79 203 0.74 3 0.92 215 0.64 1 770 0.97 2 357 0.89 0.86*0.93<br />
2 Laboratory assistants 4 0.96 8 1.21 1 1.62 11 0.64 8 0.90 32 0.85 0.58*1.20<br />
3 Physicians 14 0.81 5 0.31 [1.35] 0.00 39 0.78 56 0.68 114 0.68 0.57*0.82<br />
4 Dentists [4.98] 0.00 1 0.29 [0.31] 0.00 15 0.67 40 0.98 56 0.78 0.59*1.01<br />
5 Nurses [0.23] 0.00 1 1.31 [0.01] 0.00 [1.40] 0.00 5 1.18 6 0.90 0.33*1.96<br />
6 Assistant nurses 5 1.00 [0.62] 0.00 [0.15] 0.00 12 1.34 35 1.25 52 1.22 0.91*1.60<br />
7 ‘‘Other health workers’’ 14 0.93 12 0.76 1 2.66 10 0.52 79 1.15 116 0.97 0.81*1.17<br />
8 Teachers 75 0.82 87 0.74 6 1.24 171 0.66 387 0.82 726 0.77 0.72*0.83<br />
9 Religious workers etc 26 0.67 44 0.71 2 0.62 109 0.77 318 0.89 499 0.83 0.76*0.91<br />
10 Artistic workers 8 0.67 16 0.71 [0.88] 0.00 34 0.83 99 0.90 157 0.84 0.72*0.99<br />
11 Journalists 7 1.25 8 0.73 [0.49] 0.00 12 0.68 75 1.48 102 1.20 0.98*1.45<br />
12 Administrators 243 1.03 156 0.85 7 0.84 435 0.85 673 0.97 1 514 0.93 0.88*0.97<br />
13 Clerical workers 96 0.94 98 0.80 8 0.84 320 0.86 707 0.95 1 229 0.91 0.86*0.96<br />
14 Sales agents 59 1.09 162 0.96 5 1.04 426 0.94 1 197 1.11 1 849 1.05 1.00*1.10<br />
15 Shop workers 224 0.95 68 0.98 2 0.60 156 0.98 374 1.07 824 1.01 0.94*1.08<br />
16 Farmers 316 0.69 882 0.96 9 0.64 1 168 0.81 1 414 0.77 3 789 0.81 0.79*0.84<br />
17 Gardeners 56 0.86 111 0.91 [0.43] 0.00 275 0.83 611 0.90 1 053 0.88 0.83*0.93<br />
18 Fishermen 27 1.25 8 0.68 6 0.78 502 1.19 79 1.09 622 1.16 1.07*1.25<br />
19 Forestry workers 9 0.94 165 1.19 [0.07] 0.00 231 0.90 401 0.81 806 0.90 0.84*0.96<br />
20 Miners <strong>and</strong> quarry workers 7 2.42 25 1.14 [0.13] 0.00 75 1.16 116 0.96 223 1.06 0.93*1.21<br />
21 Seamen 22 0.95 36 1.21 3 1.37 389 1.28 137 1.28 587 1.26 1.16*1.36<br />
22 Transport workers 64 1.24 79 0.88 5 1.12 157 0.94 364 0.98 669 0.97 0.90*1.05<br />
23 Drivers 177 1.07 282 1.03 11 1.76 526 1.19 992 1.11 1 988 1.12 1.07*1.17<br />
24 Postal workers 32 0.98 40 0.93 3 3.54 92 1.01 186 0.95 353 0.97 0.87*1.08<br />
25 Textile workers 35 1.20 34 1.14 3 2.06 91 0.87 225 1.03 388 1.01 0.92*1.12<br />
26 Shoe <strong>and</strong> leather workers 8 1.11 12 0.92 [0.32] 0.00 57 1.24 77 0.90 154 1.01 0.87*1.19<br />
27 Smelting workers 68 1.04 54 1.22 3 1.52 179 1.33 365 1.06 669 1.13 1.05*1.22<br />
28 Mechanics 188 1.07 279 1.03 8 1.33 717 1.18 1 729 1.06 2 921 1.09 1.05*1.13<br />
29 Plumbers 14 0.89 53 1.19 2 2.01 80 1.18 207 1.11 356 1.13 1.01*1.25<br />
30 Welders 51 1.26 1 2.85 94 1.31 230 1.07 376 1.15 1.04*1.27<br />
31 Electrical workers 46 1.11 113 1.01 5 1.39 261 0.98 555 0.99 980 0.99 0.93*1.06<br />
32 Wood workers 137 1.13 259 0.84 4 1.12 716 0.92 947 0.88 2 063 0.90 0.86*0.94<br />
33 Painters 52 1.30 78 1.24 1 0.68 161 1.24 326 1.04 618 1.13 1.05*1.22<br />
34 ‘‘Other construction workers’’ 164 1.07 238 1.22 5 0.71 167 1.15 618 1.07 1 192 1.10 1.04*1.17<br />
35 Bricklayers 51 1.16 35 1.09 90 1.17 163 1.16 339 1.16 1.04*1.29<br />
36 Printers 32 1.15 27 1.00 [1.16] 0.00 62 0.85 176 1.04 297 0.99 0.89*1.11<br />
37 Chemical process workers 33 1.27 42 0.91 [0.65] 0.00 212 1.20 316 1.23 603 1.19 1.10*1.29<br />
38 Food workers 101 1.20 31 0.91 8 1.42 239 1.22 269 1.02 648 1.11 1.03*1.20<br />
39 Beverage workers 12 1.18 2 0.85 [0.10] 0.00 [1.35] 0.00 16 1.10 30 1.05 0.71*1.50<br />
40 Tobacco workers 2 1.21 1 2.45 [0.01] 0.00 6 1.93 2 1.68 11 1.73 0.86*3.09<br />
41 Glass makers etc 51 1.03 51 1.05 1 1.04 111 1.25 338 1.18 552 1.16 1.07*1.26<br />
42 Packers 57 1.30 130 1.26 2 0.62 374 1.26 525 1.02 1 088 1.13 1.07*1.20<br />
43 Engine operators 40 0.89 115 0.86 2 0.48 170 1.15 474 1.09 801 1.05 0.98*1.12<br />
44 Public safety workers 47 1.12 67 0.85 4 1.31 118 0.95 267 1.04 503 1.00 0.91*1.09<br />
45 Cooks <strong>and</strong> stewards 4 1.25 6 1.30 [1.39] 0.00 65 1.30 61 1.35 136 1.30 1.10*1.54<br />
46 Domestic assistants [0.04] 0.00 [0.42] 0.00 [0.00] 0.00 [0.37] 0.00 3 0.80 3 0.66 0.14*1.92<br />
47 Waiters 12 1.78 5 1.15 [0.15] 0.00 26 1.16 42 1.79 85 1.49 1.19*1.84<br />
48 Building caretakers 51 1.15 76 1.10 3 2.10 69 1.08 198 1.00 397 1.05 0.95*1.16<br />
49 Chimney sweeps [1.14] 0.00 5 1.02 5 0.79 19 1.31 29 1.08 0.72*1.55<br />
50 Hairdressers 9 0.71 [1.34] 0.00 [0.20] 0.00 23 1.23 76 1.47 108 1.28 1.06*1.54<br />
51 Launderers 8 1.30 1 0.70 [0.13] 0.00 11 0.97 36 0.97 56 1.00 0.76*1.30<br />
52 Military personnel 26 1.20 17 0.72 87 0.96 155 1.01 285 0.98 0.88*1.10<br />
53 ‘‘Other workers’’ 161 1.20 99 1.22 8 0.64 641 1.09 672 1.08 1 581 1.10 1.05*1.15<br />
54 Economically inactive 177 1.45 629 1.36 16 1.83 412 1.33 1 107 1.20 2 341 1.28 1.23*1.33<br />
1 54 All categories 3 237 1.00 5 007 1.00 148 1.00 10 624 1.00 20 317 1.00 39 333 1.00 Ref.<br />
Obs observed number of cases; SIR st<strong>and</strong>ardised incidence ratio; 95% CI 95% confidence interval.<br />
<strong>Occupation</strong> <strong>and</strong> <strong>cancer</strong> in Nordic countries 763
Acta Oncol Downloaded from informahealthcare.com by 212.35.100.66 on 04/06/11<br />
For personal use only.<br />
764 E. Pukkala et al.<br />
Table 79. Observed number of other/unknown site among women in the Nordic countries <strong>and</strong> st<strong>and</strong>ardised incidence ratios 1961 2005,<br />
by country <strong>and</strong> occupational category.<br />
Denmark Finl<strong>and</strong> Icel<strong>and</strong> Norway Sweden Total<br />
No <strong>Occupation</strong>al category Obs SIR Obs SIR Obs SIR Obs SIR Obs SIR Obs SIR 95% CI<br />
1 Technical workers, etc 9 0.74 25 0.89 [0.52] 0.00 8 0.77 93 0.93 135 0.89 0.75*1.05<br />
2 Laboratory assistants 7 0.83 15 0.92 [0.79] 0.00 13 0.88 21 0.86 56 0.86 0.65*1.12<br />
3 Physicians 3 0.75 3 0.46 [0.14] 0.00 2 0.31 18 0.81 26 0.66 0.43*0.97<br />
4 Dentists 2 0.56 10 1.07 [0.05] 0.00 4 0.67 14 0.77 30 0.81 0.54*1.15<br />
5 Nurses 51 0.71 63 0.76 3 0.80 87 0.77 263 0.85 467 0.81 0.74*0.88<br />
6 Assistant nurses 52 1.02 76 0.82 2 0.39 90 0.81 492 0.94 712 0.91 0.84*0.98<br />
7 ‘‘Other health workers’’ 42 1.03 73 1.03 3 2.75 106 0.87 162 0.92 386 0.94 0.85*1.04<br />
8 Teachers 66 0.75 122 0.74 6 0.89 198 0.86 518 0.75 910 0.77 0.72*0.82<br />
9 Religious workers etc 16 1.33 59 0.89 1 0.97 60 1.07 181 0.83 317 0.90 0.81*1.00<br />
10 Artistic workers 4 0.62 10 0.80 [0.83] 0.00 14 0.75 30 0.69 58 0.71 0.54*0.92<br />
11 Journalists 4 3.01 6 0.71 [0.20] 0.00 3 0.68 13 0.65 26 0.76 0.50*1.11<br />
12 Administrators 40 1.05 17 0.62 2 3.03 62 0.97 82 0.83 203 0.89 0.77*1.02<br />
13 Clerical workers 321 0.89 478 0.93 21 1.05 624 0.83 1613 0.94 3 057 0.91 0.88*0.94<br />
14 Sales agents 4 1.20 93 1.08 4 1.78 119 0.88 234 0.94 454 0.95 0.87*1.04<br />
15 Shop workers 242 0.96 270 0.89 11 0.84 645 0.94 1 091 0.98 2 259 0.96 0.92*1.00<br />
16 Farmers 145 0.83 258 1.12 16 1.58 515 0.95 83 0.84 1 017 0.96 0.90*1.02<br />
17 Gardeners 21 0.92 591 0.95 [0.34] 0.00 313 0.99 285 0.98 1 210 0.97 0.91*1.02<br />
18 Fishermen 2 2.24 1 0.78 [0.34] 0.00 4 1.22 [0.94] 0.00 7 1.04 0.42*2.15<br />
19 Forestry workers [0.23] 0.00 1 0.40 [0.04] 0.00 6 1.16 4 0.65 11 0.78 0.39*1.40<br />
20 Miners <strong>and</strong> quarry workers [0.02] 0.00 2 1.81 [0.02] 0.00 [0.21] 0.00 [1.43] 0.00 2 0.72 0.09*2.60<br />
21 Seamen [0.22] 0.00 [0.00] 0.00 1 1.32 [0.15] 0.00 1 0.89 0.02*4.94<br />
22 Transport workers [0.26] 0.00 13 0.81 [0.39] 0.00 4 1.26 15 0.89 32 0.87 0.60*1.23<br />
23 Drivers 4 0.64 4 0.62 [0.16] 0.00 14 1.09 45 1.12 67 1.02 0.79*1.29<br />
24 Postal workers 17 1.27 99 1.06 2 0.46 132 0.84 339 1.09 589 1.02 0.94*1.10<br />
25 Textile workers 102 1.22 204 0.93 8 0.92 272 0.93 650 0.99 1 236 0.98 0.92*1.03<br />
26 Shoe <strong>and</strong> leather workers 3 0.49 31 1.17 [0.49] 0.00 18 0.88 56 1.12 108 1.04 0.86*1.26<br />
27 Smelting workers 1 0.67 7 1.12 [0.02] 0.00 2 1.30 10 0.79 20 0.91 0.56*1.41<br />
28 Mechanics 12 0.83 23 0.87 [0.07] 0.00 25 1.15 156 1.22 216 1.13 0.99*1.29<br />
29 Plumbers [0.16] 0.00 [0.05] 0.00 [0.12] 0.00 1 6.14 1 2.02 0.05*11.28<br />
30 Welders 1 0.54 [0.01] 0.00 3 2.66 4 0.88 8 1.07 0.46*2.10<br />
31 Electrical workers 24 1.18 17 1.14 [0.07] 0.00 28 1.26 82 1.15 151 1.17 1.00*1.37<br />
32 Wood workers 8 1.18 58 1.04 [0.13] 0.00 6 0.86 19 0.90 91 1.00 0.81*1.23<br />
33 Painters 2 7.39 5 0.80 [0.04] 0.00 [1.66] 0.00 7 1.22 14 1.00 0.55*1.68<br />
34 ‘‘Other construction workers’’ [0.21] 0.00 35 1.46 1 49.46 1 1.48 [0.66] 0.00 37 1.45 1.02*2.00<br />
35 Bricklayers [0.04] 0.00 [0.80] 0.00 [0.03] 0.00 [0.02] 0.00 [0.89] 0.00 0.00*4.15<br />
36 Printers 6 0.77 22 0.84 [0.68] 0.00 28 1.25 60 1.09 116 1.04 0.86*1.24<br />
37 Chemical process workers 17 1.38 10 0.72 1 3.23 21 1.05 64 1.45 113 1.24 1.04*1.50<br />
38 Food workers 55 0.92 72 0.96 23 1.35 148 1.08 168 1.25 466 1.10 1.00*1.20<br />
39 Beverage workers 12 2.09 2 0.46 [0.04] 0.00 3 3.01 8 0.93 25 1.27 0.82*1.88<br />
40 Tobacco workers 15 1.91 3 1.21 6 1.18 5 0.95 29 1.40 0.94*2.01<br />
41 Glass makers etc 20 1.38 49 0.96 1 2.09 41 0.98 113 0.96 224 0.99 0.87*1.13<br />
42 Packers 2 0.48 88 0.97 3 1.75 107 1.05 177 1.00 377 1.00 0.91*1.11<br />
43 Engine operators 1 8.88 19 1.36 [0.03] 0.00 3 3.03 11 1.08 34 1.34 0.93*1.87<br />
44 Public safety workers [0.50] 0.00 6 1.81 [0.36] 0.00 8 0.59 10 0.78 24 0.79 0.50*1.17<br />
45 Cooks <strong>and</strong> stewards [0.17] 0.00 82 0.79 6 0.90 154 0.92 299 1.14 541 1.00 0.92*1.09<br />
46 Domestic assistants 96 1.02 95 0.91 2 1.01 413 1.00 734 1.11 1 340 1.05 1.00*1.11<br />
47 Waiters 23 1.44 97 1.20 [0.68] 0.00 186 1.18 293 1.08 599 1.14 1.05*1.23<br />
48 Building caretakers 324 1.18 361 1.00 11 0.83 663 1.01 735 1.07 2 094 1.05 1.01*1.10<br />
49 Chimney sweeps [0.03] 0.00 [0.16] 0.00 [0.09] 0.00 [0.01] 0.00 [0.29] 0.00 0.00*12.73<br />
50 Hairdressers 14 0.87 32 1.04 [0.68] 0.00 40 1.03 94 0.85 180 0.91 0.79*1.05<br />
51 Launderers 28 0.90 32 1.07 [2.17] 0.00 50 0.78 146 1.02 256 0.95 0.84*1.07<br />
52 Military personnel 2 12.53 1 4.94 [0.13] 0.00 [0.35] 0.00 3 3.56 0.73*10.40<br />
53 ‘‘Other workers’’ 83 1.07 101 0.94 18 1.40 324 0.97 288 0.94 814 0.97 0.91*1.04<br />
54 Economically inactive 2 149 1.01 2 875 1.08 43 0.91 5 810 1.06 14 918 1.02 25 795 1.03 1.02*1.05<br />
1 54 All categories 4 051 1.00 6 617 1.00 188 1.00 11 384 1.00 24 704 1.00 46 944 1.00 Ref.<br />
Obs observed number of cases; SIR st<strong>and</strong>ardised incidence ratio; 95% CI 95% confidence interval.
Acta Oncol Downloaded from informahealthcare.com by 212.35.100.66 on 04/06/11<br />
For personal use only.<br />
/ 100 000<br />
350<br />
300<br />
250<br />
200<br />
150<br />
Men<br />
100<br />
Denmark<br />
Finl<strong>and</strong><br />
50<br />
Icel<strong>and</strong><br />
Norway<br />
0<br />
Sweden<br />
1945 1960 1975 1990 2005<br />
In women, tobacco manufacture workers had the<br />
highest SIR (1.27, 1.19 1.35); all other significant<br />
SIRs were below 1.15 (Table 81). The rates were<br />
lowest among female seafarers (0.58, 0.37 0.87)<br />
<strong>and</strong> bricklayers. From the more common occupations<br />
among the women, farming <strong>and</strong> gardening<br />
were associated with the lowest rates.<br />
Comment. The group of all <strong>cancer</strong> combined includes<br />
numerous <strong>cancer</strong> diseases with different aetiologies.<br />
The relative large variation in occupation-specific<br />
incidence rates indicates that risk-increasing factors<br />
may cumulate in some occupational categories.<br />
Among occupations with the highest SIRs in men<br />
were occupations such as waiters, beverage workers<br />
<strong>and</strong> tobacco workers that have also been seen at the<br />
top of the list of SIRs for alcohol <strong>and</strong> tobacco related<br />
<strong>cancer</strong>s. On the other h<strong>and</strong>, there were also many<br />
occupations with known or strongly suspected direct<br />
occupational exposures such as chimney sweeps,<br />
plumbers, hairdressers <strong>and</strong> printers. At the bottom<br />
of the list there are occupations related to farming<br />
<strong>and</strong> forestry which have a low exposure to industrial<br />
agents.<br />
In women, the top of the list is more mixed. There<br />
were industrial occupations with relatively high<br />
SIRs, e.g., tobacco workers, printers <strong>and</strong> plumbers,<br />
but many occupations in administration <strong>and</strong> technical<br />
work also showed high SIRs. The collection of<br />
occupations with a low overall <strong>cancer</strong> risk is also<br />
quite a mixture, with a likely under representation<br />
of occupations with a high degree of education.<br />
All of the lowest-risk occupations among the women<br />
are ‘‘male occupations’’ with quite heavy physical<br />
dem<strong>and</strong>s.<br />
/ 100 000<br />
350<br />
300<br />
250<br />
200<br />
150<br />
<strong>Occupation</strong> <strong>and</strong> <strong>cancer</strong> in Nordic countries 765<br />
Women<br />
100<br />
Denmark<br />
Finl<strong>and</strong><br />
50<br />
Icel<strong>and</strong><br />
Norway<br />
0<br />
Sweden<br />
1945 1960 1975 1990 2005<br />
Figure 49. Age st<strong>and</strong>ardised (World) incidence rates for all malignant neoplasms 1943 2005, by country <strong>and</strong> gender. Modified from<br />
NORDCAN [49].<br />
Discussion<br />
Validity of census occupation<br />
Correct classification of exposure categories is crucial<br />
in any study on work-related <strong>cancer</strong>. In the<br />
present study, the information on occupations was<br />
based on national censuses from 1960 1990. The<br />
current population register systems allow tabulation<br />
of the entire population by sex, age, <strong>and</strong> several<br />
other demographic variables <strong>and</strong> have therefore<br />
diminished the incentive to undertake traditional<br />
censuses. Unfortunately, the detailed information on<br />
occupation <strong>and</strong> industry for each citizen may be<br />
difficult to obtain from registers with similar precision<br />
as they were collected from census questionnaires.<br />
We have therefore restricted the present study<br />
to the census populations for whom high quality data<br />
on occupation are available.<br />
Denmark became the first country in the world to<br />
abolish traditional censuses. In the first registerbased<br />
census in Denmark from 1981 the information<br />
on occupation came primarily from tax-forms,<br />
<strong>and</strong> 5% of the work force ended up being registered<br />
only as wage-earners without further information<br />
[2]. The Danish part of the present study is therefore<br />
based solely on the 1970 census. Finl<strong>and</strong> was<br />
the second country to skip traditional censuses, but<br />
according to internal quality controls by Statistics<br />
Finl<strong>and</strong> a sufficiently high quality of the occupational<br />
information was ensured when the transition<br />
took place in 1990. The present study therefore<br />
includes data from the 1970, the 1980, <strong>and</strong> the 1990<br />
censuses in Finl<strong>and</strong>. Icel<strong>and</strong> has a long census<br />
tradition, but the only census available with computerised<br />
data is from 1981. Sweden kept the traditional<br />
censuses throughout the 20th century, <strong>and</strong> the<br />
present study includes data from the 1960, 1970,
Acta Oncol Downloaded from informahealthcare.com by 212.35.100.66 on 04/06/11<br />
For personal use only.<br />
766 E. Pukkala et al.<br />
Table 80. Observed number of all malignant neoplasms among men in the Nordic countries <strong>and</strong> st<strong>and</strong>ardised incidence ratios 1961 2005,<br />
by country <strong>and</strong> occupational category.<br />
Denmark Finl<strong>and</strong> Icel<strong>and</strong> Norway Sweden Total<br />
No <strong>Occupation</strong>al category Obs SIR Obs SIR Obs SIR Obs SIR Obs SIR Obs SIR 95% CI<br />
1 Technical workers, etc 14 472 0.98 13 197 0.95 156 0.93 9 201 0.90 57 315 1.03 94 341 0.99 0.99*1.00<br />
2 Laboratory assistants 293 0.99 313 0.93 37 1.16 498 1.00 254 0.95 1 395 0.98 0.93*1.03<br />
3 Physicians 1 094 0.89 733 0.92 70 1.03 1 278 0.93 2 484 0.98 5 659 0.94 0.92*0.97<br />
4 Dentists 341 0.96 132 0.78 6 0.36 612 1.00 1 264 1.00 2 355 0.97 0.94*1.01<br />
5 Nurses 9 0.55 36 0.92 1 2.55 43 0.79 119 0.94 208 0.87 0.76*1.00<br />
6 Assistant nurses 320 0.91 38 1.12 4 0.50 240 1.02 884 1.02 1 486 0.99 0.94*1.04<br />
7 ‘‘Other health workers’’ 1 026 0.96 730 0.93 13 0.70 527 1.01 2 131 1.00 4 427 0.98 0.95*1.01<br />
8 Teachers 5 393 0.83 4 914 0.84 250 1.01 6 453 0.86 13 521 0.94 30 531 0.88 0.87*0.89<br />
9 Religious workers etc 2 519 0.91 2 994 0.96 188 1.15 3 572 0.92 11 046 1.01 20 319 0.97 0.96*0.99<br />
10 Artistic workers 858 1.00 1 119 0.99 60 1.34 1 191 1.05 3 636 1.08 6 864 1.05 1.02*1.07<br />
11 Journalists 416 1.03 525 0.96 28 1.10 474 0.96 1 740 1.11 3 183 1.05 1.01*1.09<br />
12 Administrators 17 050 1.01 9 072 1.01 436 1.03 14 314 1.04 23 185 1.07 64 057 1.04 1.03*1.05<br />
13 Clerical workers 7 123 0.97 5 910 0.99 536 1.12 10 114 0.99 24 553 1.06 48 236 1.02 1.01*1.03<br />
14 Sales agents 4 141 1.07 8 354 0.99 259 1.07 12 899 1.08 36 697 1.10 62 350 1.08 1.07*1.08<br />
15 Shop workers 17 514 1.03 3 364 0.96 168 0.99 4 610 1.01 11 203 1.04 36 859 1.02 1.01*1.03<br />
16 Farmers 23 400 0.71 38 820 0.90 508 0.72 28 709 0.83 49 126 0.84 140 563 0.83 0.82*0.83<br />
17 Gardeners 3 872 0.83 5 174 0.87 18 0.81 6 787 0.81 18 408 0.86 34 259 0.85 0.84*0.85<br />
18 Fishermen 1 736 1.12 524 0.94 429 1.07 10 869 1.02 2 210 0.97 15 768 1.02 1.00*1.04<br />
19 Forestry workers 564 0.82 6 639 0.96 [3.69] 0.00 5 023 0.80 12 567 0.81 24 793 0.84 0.83*0.85<br />
20 Miners <strong>and</strong> quarry workers 205 0.97 1 398 1.28 6 0.91 1 774 1.04 3 855 1.01 7 238 1.06 1.04*1.08<br />
21 Seamen 2 143 1.30 1 742 1.19 138 1.24 10 124 1.20 4 119 1.23 18 266 1.22 1.20*1.23<br />
22 Transport workers 3 713 1.01 4 250 0.97 228 1.01 4 654 1.03 11 584 1.01 24 429 1.01 1.00*1.02<br />
23 Drivers 13 551 1.14 14 290 1.04 329 1.02 13 842 1.13 29 686 1.07 71 698 1.09 1.08*1.10<br />
24 Postal workers 2 237 0.98 2 021 0.96 49 1.16 2 426 1.02 6 302 1.03 13 035 1.01 0.99*1.03<br />
25 Textile workers 2 184 1.03 1 469 1.02 59 0.81 2 651 1.00 6 749 0.98 13 112 1.00 0.98*1.01<br />
26 Shoe <strong>and</strong> leather workers 528 1.00 592 0.94 15 0.95 1 184 1.05 2 900 1.07 5 219 1.04 1.01*1.07<br />
27 Smelting workers 5 382 1.15 2 240 1.04 89 0.88 3 991 1.13 10 713 0.99 22 415 1.05 1.04*1.07<br />
28 Mechanics 13 654 1.08 13 773 1.02 286 0.92 18 230 1.07 51 641 1.03 97 584 1.04 1.03*1.05<br />
29 Plumbers 1 382 1.23 2 488 1.11 50 0.98 2 208 1.14 6 372 1.10 12 500 1.12 1.10*1.14<br />
30 Welders 2 256 1.09 18 0.96 2 323 1.06 6 903 1.05 11 500 1.06 1.04*1.08<br />
31 Electrical workers 3 264 1.11 5 601 0.99 188 1.01 7 763 1.03 17 406 1.01 34 222 1.02 1.01*1.03<br />
32 Wood workers 8 632 0.99 15 088 1.01 170 0.94 19 253 0.96 31 210 0.92 74 353 0.95 0.95*0.96<br />
33 Painters 3 192 1.12 3 279 1.06 69 0.94 3 567 1.07 10 020 1.02 20 127 1.05 1.04*1.06<br />
34 ‘‘Other construction workers’’ 11 543 1.04 10 939 1.14 360 1.00 4 235 1.08 18 733 1.03 45 810 1.06 1.05*1.07<br />
35 Bricklayers 3 503 1.10 1 680 1.08 2120 1.07 4 519 1.02 11 822 1.06 1.04*1.08<br />
36 Printers 2 236 1.12 1 383 1.02 53 0.90 2 172 1.09 5 725 1.09 11 569 1.08 1.06*1.10<br />
37 Chemical process workers 2 035 1.08 2 306 1.00 32 0.97 4 608 1.03 8 087 0.99 17 068 1.01 1.00*1.03<br />
38 Food workers 6 389 1.05 1 697 1.01 288 1.01 5 450 1.08 8 611 1.04 22 435 1.05 1.04*1.06<br />
39 Beverage workers 1 049 1.41 104 0.91 4 0.85 54 1.04 538 1.16 1 749 1.27 1.21*1.33<br />
40 Tobacco workers 154 1.25 26 1.30 [0.35] 0.00 96 1.24 40 1.09 316 1.23 1.10*1.37<br />
41 Glass makers etc 3 664 1.02 2 454 1.01 62 1.24 2 684 1.10 8 908 0.99 17 772 1.02 1.00*1.03<br />
42 Packers 3 491 1.09 5 670 1.11 179 1.09 8 722 1.15 17 283 1.07 35 345 1.10 1.08*1.11<br />
43 Engine operators 3 343 1.04 7 058 1.05 218 1.01 4 703 1.11 14 018 1.03 29 340 1.05 1.04*1.06<br />
44 Public safety workers 3 176 1.06 4 015 1.02 158 1.02 3 555 1.09 8 532 1.08 19 436 1.07 1.05*1.08<br />
45 Cooks <strong>and</strong> stewards 331 1.42 252 1.10 78 1.08 1 655 1.17 1 675 1.20 3 991 1.19 1.16*1.23<br />
46 Domestic assistants 4 1.57 4 0.24 [0.23] 0.00 14 1.20 93 0.81 115 0.79 0.66*0.95<br />
47 Waiters 913 1.84 251 1.15 8 1.05 832 1.36 1 046 1.45 3 050 1.48 1.43*1.54<br />
48 Building caretakers 3 643 1.13 3 376 1.00 87 1.25 1 922 1.15 6 622 1.05 15 650 1.07 1.05*1.09<br />
49 Chimney sweeps 114 1.40 261 1.06 203 1.20 557 1.23 1 135 1.20 1.13*1.27<br />
50 Hairdressers 950 1.04 54 0.78 10 0.97 539 1.11 1 823 1.13 3 376 1.09 1.06*1.13<br />
51 Launderers 454 1.01 75 1.08 10 1.50 339 1.17 1 188 1.03 2 066 1.05 1.01*1.10<br />
52 Military personnel 1 557 1.03 1 175 0.96 2 807 1.04 4 996 1.07 10 535 1.04 1.02*1.06<br />
53 ‘‘Other workers’’ 11 351 1.16 4 090 1.03 668 1.06 14 839 1.02 19 863 1.01 50 811 1.05 1.04*1.05<br />
54 Economically inactive 11 625 1.17 25 506 1.14 456 1.04 6 968 0.94 29 385 0.99 73 940 1.06 1.05*1.07<br />
1 54 All categories 233 733 1.00 245 451 1.00 7 532 1.00 279 921 1.00 634 045 1.00 1 400 682 1.00 Ref.<br />
Obs observed number of cases; SIR st<strong>and</strong>ardised incidence ratio; 95% CI 95% confidence interval.
Acta Oncol Downloaded from informahealthcare.com by 212.35.100.66 on 04/06/11<br />
For personal use only.<br />
Table 81. Observed number of all malignant neoplasms among women in the Nordic countries <strong>and</strong> st<strong>and</strong>ardised incidence ratios 1961<br />
2005, by country <strong>and</strong> occupational category.<br />
Denmark Finl<strong>and</strong> Icel<strong>and</strong> Norway Sweden Total<br />
No <strong>Occupation</strong>al category Obs SIR Obs SIR Obs SIR Obs SIR Obs SIR Obs SIR 95% CI<br />
1 Technical workers, etc 796 1.09 1 651 1.11 17 0.72 441 1.14 3 039 1.05 5944 1.08 1.05*1.10<br />
2 Laboratory assistants 551 1.02 894 1.10 40 1.17 479 1.03 954 1.02 2 918 1.05 1.01*1.08<br />
3 Physicians 266 1.10 438 1.19 6 1.06 186 0.97 704 1.01 1 600 1.06 1.01*1.12<br />
4 Dentists 225 1.05 440 1.22 2 0.87 163 1.03 519 1.04 1 349 1.09 1.03*1.15<br />
5 Nurses 4 157 0.97 4 543 1.10 154 0.99 3 491 0.96 8 553 1.00 20 898 1.01 0.99*1.02<br />
6 Assistant nurses 3 127 1.00 3 810 0.94 191 0.88 3 412 0.95 15 098 0.98 25 638 0.97 0.96*0.98<br />
7 ‘‘Other health workers’’ 2 449 1.00 3 476 1.07 37 0.80 3 521 0.99 5 354 1.02 14 837 1.02 1.00*1.04<br />
8 Teachers 5 435 1.00 8 093 1.11 267 0.95 6 808 0.99 19 518 1.00 40 121 1.02 1.01*1.03<br />
9 Religious workers etc 700 0.96 4 233 1.09 51 1.22 1 763 1.03 6 925 1.02 13 672 1.04 1.02*1.06<br />
10 Artistic workers 378 1.02 666 1.09 31 0.92 523 1.02 1 383 1.10 2981 1.07 1.03*1.11<br />
11 Journalists 95 1.17 434 1.12 8 0.90 158 1.14 657 1.11 1352 1.12 1.06*1.18<br />
12 Administrators 2 481 1.12 1 507 1.14 32 1.25 1 816 1.08 3 057 1.07 8893 1.10 1.08*1.12<br />
13 Clerical workers 23 863 1.08 26 565 1.10 900 1.06 23 079 1.07 51 572 1.09 125 979 1.09 1.08*1.09<br />
14 Sales agents 206 1.04 3 552 1.04 96 1.10 3 110 1.07 6 850 1.06 13 814 1.06 1.04*1.07<br />
15 Shop workers 14 979 1.02 12 250 0.99 524 0.99 17 582 1.00 28 353 1.03 73 688 1.02 1.01*1.02<br />
16 Farmers 7 757 0.75 6 526 0.90 303 0.81 10 020 0.87 2 321 0.89 26 927 0.84 0.83*0.85<br />
17 Gardeners 1 132 0.85 18 024 0.86 18 1.41 5 812 0.84 6 386 0.90 31 372 0.86 0.85*0.87<br />
18 Fishermen 41 0.77 42 0.88 17 1.21 80 0.89 26 1.09 206 0.90 0.78*1.03<br />
19 Forestry workers 16 1.14 50 0.53 1 0.54 118 0.91 144 0.90 329 0.82 0.74*0.92<br />
20 Miners <strong>and</strong> quarry workers [0.89] 0.00 31 0.81 [0.34] 0.00 7 0.97 19 0.48 57 0.66 0.50*0.86<br />
21 Seamen 9 0.71 [0.06] 0.00 9 0.42 5 0.90 23 0.58 0.37*0.87<br />
22 Transport workers 15 1.02 677 1.17 17 1.23 121 1.20 502 1.08 1 332 1.14 1.08*1.20<br />
23 Drivers 374 1.00 262 0.89 6 0.89 325 0.91 1 214 1.03 2 181 0.98 0.94*1.03<br />
24 Postal workers 792 1.02 3 712 1.01 161 0.93 4 188 1.01 8 455 1.06 17 308 1.03 1.02*1.05<br />
25 Textile workers 5 233 1.06 8 236 1.01 284 0.93 6 727 1.05 15 701 1.02 36 181 1.03 1.01*1.04<br />
26 Shoe <strong>and</strong> leather workers 379 1.03 972 0.96 21 1.28 450 0.97 1 296 1.09 3 118 1.02 0.99*1.06<br />
27 Smelting workers 95 1.06 218 0.92 2 2.58 54 0.99 352 1.00 721 0.98 0.91*1.06<br />
28 Mechanics 1 034 1.15 1 027 0.94 4 1.26 593 1.03 3 675 1.05 6333 1.04 1.02*1.07<br />
29 Plumbers 6 0.75 1 0.38 6 1.43 10 1.67 23 1.11 0.70*1.66<br />
30 Welders 78 0.87 [0.30] 0.00 53 1.19 153 1.06 284 1.02 0.91*1.15<br />
31 Electrical workers 1 483 1.18 765 1.02 4 1.46 707 1.13 2 006 1.02 4 965 1.08 1.05*1.11<br />
32 Wood workers 450 1.09 1 803 0.88 3 0.56 205 0.99 543 0.91 3004 0.92 0.89*0.95<br />
33 Painters 13 0.83 263 1.07 [1.51] 0.00 66 1.42 141 0.90 483 1.03 0.94*1.13<br />
34 ‘‘Other construction workers’’ 12 0.98 897 1.12 1 1.08 15 0.82 17 0.77 942 1.11 1.04*1.18<br />
35 Bricklayers 2 0.81 17 0.60 1 1.00 1 1.36 21 0.65 0.40*0.99<br />
36 Printers 542 1.16 1 148 1.08 26 0.96 666 1.19 1 658 1.15 4040 1.13 1.10*1.17<br />
37 Chemical process workers 842 1.15 508 0.96 11 0.95 534 1.08 1 171 1.04 3 066 1.06 1.02*1.10<br />
38 Food workers 3 629 1.01 2 560 0.93 653 1.00 3 029 0.97 3 346 1.02 13 217 0.99 0.97*1.00<br />
39 Beverage workers 430 1.28 120 0.79 2 1.28 34 1.23 199 0.97 785 1.09 1.01*1.16<br />
40 Tobacco workers 624 1.33 95 1.10 139 1.26 150 1.13 1 008 1.27 1.19*1.35<br />
41 Glass makers etc 962 1.09 1 883 0.96 20 1.13 1 172 1.10 3 125 1.04 7 162 1.03 1.01*1.06<br />
42 Packers 281 1.11 3 592 1.04 71 1.15 2 694 1.07 4 701 1.05 11 339 1.06 1.04*1.08<br />
43 Engine operators 14 1.78 578 1.02 1 1.06 44 1.18 290 0.92 927 1.00 0.94*1.07<br />
44 Public safety workers 24 0.89 175 1.27 11 0.90 324 1.06 464 1.09 998 1.10 1.03*1.17<br />
45 Cooks <strong>and</strong> stewards 10 1.06 3 944 1.01 246 1.06 3 647 1.05 6 531 1.03 14 378 1.03 1.01*1.04<br />
46 Domestic assistants 5 459 0.98 4 046 0.94 74 1.11 8 745 0.96 17 860 0.99 36 184 0.97 0.96*0.98<br />
47 Waiters 1 321 1.38 3 560 1.06 30 1.10 4 204 1.10 7 020 1.07 16 135 1.09 1.08*1.11<br />
48 Building caretakers 16 237 1.01 12 891 0.97 464 0.97 16 124 0.99 18 027 1.02 63 743 1.00 0.99*1.01<br />
49 Chimney sweeps [1.43] 0.00 6 0.93 3 1.36 [0.54] 0.00 9 0.85 0.39*1.60<br />
50 Hairdressers 1 026 1.05 1 367 1.06 17 0.58 1 050 1.03 3 171 1.08 6631 1.06 1.03*1.09<br />
51 Launderers 1 850 1.03 955 0.93 66 0.90 1 331 0.95 3 424 1.02 7 626 1.00 0.97*1.02<br />
52 Military personnel 16 1.71 20 1.36 5 1.00 13 0.90 54 1.24 0.93*1.62<br />
53 ‘‘Other workers’’ 5 010 1.10 4 051 0.97 514 1.04 8 244 0.97 8 295 1.04 26 114 1.02 1.00*1.03<br />
54 Economically inactive 117 999 0.99 86 283 1.00 1 767 1.03 109 954 1.01 338 703 0.98 654 706 0.99 0.98*0.99<br />
1<br />
54<br />
All categories 234 818 1.00 243 944 1.00 7 171 1.00 258 032 1.00 613 651 1.00 1 357 616 1.00 Ref.<br />
Obs observed number of cases; SIR st<strong>and</strong>ardised incidence ratio; 95% CI 95% confidence interval.<br />
<strong>Occupation</strong> <strong>and</strong> <strong>cancer</strong> in Nordic countries 767
Acta Oncol Downloaded from informahealthcare.com by 212.35.100.66 on 04/06/11<br />
For personal use only.<br />
768 E. Pukkala et al.<br />
1980 <strong>and</strong> 1990 censuses. For Norway the censuses<br />
of 1960, 1970, <strong>and</strong> 1980 have been included,<br />
as the 1990 census included only a sample of the<br />
Norwegian population.<br />
In Norway control surveys based on personal<br />
interviews with r<strong>and</strong>om samples of the census<br />
population were undertaken both in 1970 <strong>and</strong> in<br />
1980. Compared with the census, the interview data<br />
gave similar occupational codes on the two digit level<br />
of the NYK-code. Compared with the census, overall<br />
2.1% more men <strong>and</strong> 13.8% more women in the<br />
survey reported to have more than 500 hours of<br />
income producing work <strong>and</strong> should have been<br />
classified as economically active. The main deficits<br />
in the census data came from agriculture <strong>and</strong> public<br />
<strong>and</strong> private services [151].The validity was considered<br />
to be equally good for the 1960 census [41].<br />
In Sweden, a control study of the 1970 census<br />
data showed an underreporting of economic activity<br />
in the census data for persons with 20 or less hours<br />
of work per week coming especially from women in<br />
agriculture [152]. The distributions by the main<br />
occupational categories for those recorded economically<br />
active were fairly similar in the census <strong>and</strong><br />
control surveys. The accuracy of the occupational<br />
codes used in Finl<strong>and</strong> has also been proven to<br />
be high [153].<br />
In Denmark, no coding errors were detected in a<br />
sample of 1970 census questionnaires retrieved for a<br />
nested case-control study [154]. In general, the<br />
validity studies indicate that the classification by<br />
occupation in the Nordic censuses has been reasonably<br />
accurate, but that economic activity has been<br />
somewhat underestimated, especially among the<br />
women.<br />
We grouped the economically active population<br />
into relatively specific categories that are large<br />
enough to get stable numbers of observed cases<br />
<strong>and</strong> that can be defined similarly in different coding<br />
systems in the countries. From the point of view of<br />
work place exposures, some of the occupational<br />
categories are heterogeneous <strong>and</strong> may therefore<br />
hide occupational risks. For example, nickel smelting<br />
workers, who are known to have about a 30-fold<br />
excess risk of nasal <strong>cancer</strong> [80], are here grouped<br />
together with other occupations in the category of<br />
smelters <strong>and</strong> metal foundry workers, <strong>and</strong> the SIR<br />
for nasal <strong>cancer</strong> in this broad group was only 1.20<br />
(95% CI 0.93 1.53; Table 30). Still, a major part of<br />
the known associations between occupations <strong>and</strong><br />
specific <strong>cancer</strong> diseases was seen in the present<br />
study.<br />
<strong>Occupation</strong>al mobility<br />
<strong>Occupation</strong>al classification in this study is based on<br />
the occupation recorded in the first census the<br />
person participated in the age range of 30 64 years.<br />
The extent to which the first census occupation<br />
reflects the lifetime experience varies considerably<br />
across occupational categories. We estimated the<br />
occupational stability proportion of individuals who<br />
had the same occupational category (of the 53<br />
categories defined for the present study) in the first<br />
<strong>and</strong> second census available to us, i.e., 1960 <strong>and</strong><br />
1970 censuses in Norway <strong>and</strong> Sweden, <strong>and</strong> 1970<br />
<strong>and</strong> 1980 censuses in Finl<strong>and</strong> (Table 82). In general,<br />
stability was higher among men than women <strong>and</strong><br />
highest in occupational categories where a long<br />
education is required such as physicians, dentists<br />
<strong>and</strong> teachers. Nurses were more likely to keep their<br />
occupation than assistant nurses, except in Sweden,<br />
where female assistant nurses also had a high rate<br />
of staying in the occupation. Hairdressers in all<br />
countries <strong>and</strong> of both genders tended to remain<br />
in the occupation. Among men, the category of<br />
domestic assistants was the least stable. Among<br />
women, the least stable categories were occupations<br />
with male dominancy, <strong>and</strong> occupations requiring<br />
little specific education.<br />
There are several reasons for low occupational<br />
stability rates:<br />
(1) The number of employed persons in an<br />
occupational category may have decreased<br />
in the society as a whole. This applies, for<br />
instance, to agricultural work (farmers) or<br />
industrial plants which were closed down,<br />
such as asbestos mines in Finl<strong>and</strong> [155];<br />
(2) Individual career development may have<br />
moved workers to leading positions. To avoid<br />
the occupational misclassification related to<br />
the beginning of the work career, the followup<br />
in our study started with the occupation<br />
held at the age of 30 or older;<br />
(3) The changes in coding practises between<br />
subsequent censuses could have influenced<br />
classifications. This is believed to have only a<br />
minor impact, except for some new occupations.<br />
In terms of traditional occupational<br />
exposures, it is assumed that the movement<br />
has been from the more to the less exposed<br />
categories.<br />
An earlier study from Finl<strong>and</strong> analysed occupational<br />
mobility between the censuses from 1975, 1980, <strong>and</strong><br />
1985 [153]. In both genders, 85% of persons worked
Acta Oncol Downloaded from informahealthcare.com by 212.35.100.66 on 04/06/11<br />
For personal use only.<br />
<strong>Occupation</strong> <strong>and</strong> <strong>cancer</strong> in Nordic countries 769<br />
Table 82. Number of persons <strong>and</strong> proportion who stayed in their occupation between censuses, Finl<strong>and</strong> 1970 1980 census, Norway <strong>and</strong><br />
Sweden 1960 1970 census, by gender <strong>and</strong> occupational category. Only occupations N 10 are included.<br />
Men Women<br />
Finl<strong>and</strong> Norway Sweden Finl<strong>and</strong> Norway Sweden<br />
No <strong>Occupation</strong>al category N % N % N % N % N % N %<br />
1 Technical workers, etc. 32 190 64.1 15 823 66.9 97 410 70.2 2 595 65.9 264 65.2 3 479 37.6<br />
2 Laboratory assistants 760 55.3 964 50.9 1 875 65.1 299 43.8<br />
3 Physicians 1 930 90.2 2 077 91.5 3 664 95.0 665 97.0 220 92.7 605 96.2<br />
4 Dentists 310 85.5 854 93.3 2 062 93.6 845 94.1 209 91.9 707 94.3<br />
5 Nurses 70 50.0 18 61.1 9 335 89.8 774 88.4 10 223 75.3<br />
6 Assistant nurses 65 15.4 445 34.2 1 133 53.7 11 460 43.7 223 33.6 14 902 74.6<br />
7 ‘‘Other health workers’’ 1 545 72.8 839 53.9 3 487 71.5 8 125 68.7 2 425 31.8 4 934 77.6<br />
8 Teachers 15 130 86.1 9 602 90.6 20 677 83.0 18 270 89.8 5 013 90.7 18 860 92.5<br />
9 Religious workers etc. 5 695 59.0 6 010 64.3 14 684 66.8 5 060 66.0 1 125 50.8 5 243 64.2<br />
10 Artistic workers 2 570 70.6 1 968 53.9 5 706 66.0 1 120 55.8 385 60.8 1 265 66.1<br />
11 Journalists 1 260 65.1 864 71.1 2 768 69.9 935 42.8 93 68.8 574 65.9<br />
12 Administrators 18 215 68.6 23 412 53.2 38 193 50.9 2 110 49.8 1 187 30.8 2 637 40.2<br />
13 Clerical workers 12 445 42.9 19 922 54.2 42 817 48.8 55 810 78.9 17 651 82.0 60 234 79.4<br />
14 Sales agents 19 185 52.2 22 599 55.5 60 874 57.1 7 135 47.1 2 527 51.4 7 726 44.0<br />
15 Shop workers 8 900 48.4 8 603 49.3 21 826 45.0 34 585 64.1 8 906 68.7 44 687 62.0<br />
16 Farmers 72 600 77.8 57 683 72.8 97 276 70.3 8 075 44.8 1 353 64.3 1 649 50.0<br />
17 Gardeners 13 260 41.4 17 494 21.1 39 581 44.4 48 250 67.6 790 34.9 7 855 55.7<br />
18 Fishermen 845 60.9 21 857 50.1 4 009 63.7 90 72.2 17 5.9 21 66.7<br />
19 Forestry workers 14 820 45.8 12 056 35.2 26 533 48.7 195 10.3 134 14.2<br />
20 Miners <strong>and</strong> quarry workers 2 440 40.4 3 490 44.3 7 602 44.0 90 50.0 30 0.0<br />
21 Seamen 3 085 68.1 16 765 50.0 6 290 57.2 40 0.0<br />
22 Transport workers 8 520 76.5 9 537 76.8 25 728 70.7 1 355 42.4 87 33.3 719 41.3<br />
23 Drivers 35 755 73.6 25 905 64.8 54 010 60.2 610 54.1 43 18.6 922 37.0<br />
24 Postal workers 4 675 77.9 4 204 70.1 10 596 70.2 9 760 73.5 3 619 71.5 12 557 68.9<br />
25 Textile workers 2 950 50.3 5 600 55.2 13 194 57.5 18 900 59.4 6 572 59.3 27 369 57.2<br />
26 Shoe <strong>and</strong> leather workers 1 240 51.6 2 278 45.4 4 826 51.2 2 560 58.2 489 41.7 2 249 39.8<br />
27 Smelting workers 4 265 42.8 7 157 50.8 21 270 51.5 570 17.5 348 34.5<br />
28 Mechanics 29 755 58.6 33 571 55.8 96 054 61.4 2 345 43.9 500 38.4 4 422 44.3<br />
29 Plumbers 5 455 65.8 3 881 72.2 11 441 66.6<br />
30 Welders 5 120 52.4 4 102 52.3 12 707 52.8 180 36.1 78 16.7<br />
31 Electrical workers 13 135 70.2 14 279 64.3 31 654 65.2 1 645 46.8 602 46.3 2 615 42.3<br />
32 Wood workers 27 735 65.8 38 736 69.1 56 689 71.4 4 885 53.7 60 23.3 579 44.0<br />
33 Painters 6 980 72.6 6 489 69.6 17 940 80.8 680 26.5 15 20.0 170 29.4<br />
34 ‘‘Other construction workers’’ 17 630 45.4 6 664 22.9 31 696 56.7 1 660 22.0<br />
35 Bricklayers 3 060 74.3 4 091 63.9 8 075 75.8 75 0.0<br />
36 Printers 3 475 71.5 3 665 76.0 9 560 75.8 2 675 62.1 525 65.3 2 186 54.5<br />
37 Chemical process workers 5 340 53.4 8 993 46.1 14 740 44.4 1 210 44.6 467 28.5 1 819 45.4<br />
38 Food workers 4 185 53.4 10 242 55.4 16 291 59.4 7 080 57.0 1 922 42.1 5 231 43.3<br />
39 Beverage workers 195 48.7 767 43.2 365 34.2 298 49.0<br />
40 Tobacco workers 45 22.2 148 44.6 72 50.0 230 54.3 171 43.3 222 41.4<br />
41 Glass makers etc. 5 380 34.3 4 429 44.8 15 663 46.7 4 750 41.5 876 39.5 4 683 40.8<br />
42 Packers 10 500 41.4 15 069 42.6 29 180 44.2 9 010 43.5 1 508 44.3 6 960 32.4<br />
43 Engine operators 16 655 45.9 7 388 38.6 23 880 42.2 1 340 44.0 199 52.3<br />
44 Public safety workers 7 225 80.3 6 545 75.0 13 277 74.4 175 48.6 68 36.8 246 35.8<br />
45 Cooks <strong>and</strong> stewards 425 35.3 2 560 48.3 2 111 54.2 8 620 63.1 2 830 45.5 9 994 60.4<br />
46 Home helpers 15 0.0 46 8.7 5 410 44.8 6 749 30.7 14 210 47.8<br />
47 Waiters 320 28.1 1 254 43.5 1 412 55.5 8 350 44.1 2 507 46.7 12 154 46.7<br />
48 Building caretakers 6 310 65.9 2 385 69.6 8 835 59.5 27 275 65.3 4 242 70.1 20 890 56.3<br />
49 Chimney sweeps 520 63.5 348 78.2 914 79.8 25 0.0<br />
50 Hairdressers 115 78.3 1 078 89.2 3 452 88.3 2 745 78.0 1 188 84.5 4 336 78.4<br />
51 Launderers 155 58.1 611 39.4 2 422 52.8 2 440 48.8 1 146 40.2 5 878 40.9<br />
52 Military personnel 2 940 62.6 5 847 72.3 9 200 68.0<br />
53 ‘‘Other workers’’ 7 140 38.6 28 164 6.6 33 457 38.8 9 170 42.6 7 104 9.1 10 311 41.4<br />
1 53 All categories 464 535 62.8 508 573 55.5 1 077 756 60.4 352 770 64.3 86 774 57.9 337 420 62.5
Acta Oncol Downloaded from informahealthcare.com by 212.35.100.66 on 04/06/11<br />
For personal use only.<br />
770 E. Pukkala et al.<br />
in the same main occupational category in 1975 <strong>and</strong><br />
1980. The percentage among men varied from 91%<br />
in transport to 82% in administration <strong>and</strong> manufacture,<br />
<strong>and</strong> among women from 89% in communication<br />
to 77% in administration. The comparison<br />
between 1980 <strong>and</strong> 1985 also indicated a very stable<br />
labour market in Finl<strong>and</strong> at that time [153]. In<br />
Denmark, a comparison of subsequent birth cohorts<br />
in one census indicate that at least one fourth of men<br />
working in manufacture, construction <strong>and</strong> transport<br />
in 1970 had a background in agriculture [156]. A<br />
background in agriculture is expected to affect the<br />
<strong>cancer</strong> pattern of such occupational categories, as<br />
the <strong>cancer</strong> risk of farmers is in general low <strong>and</strong> as<br />
farmers normally had lower tobacco consumption<br />
than other occupational categories.<br />
Even for those who remained in the same<br />
occupation, job conditions may have changed considerably.<br />
Although in some occupations where the<br />
physical dem<strong>and</strong>s are still high, for instance mining,<br />
forestry, fishing, agriculture, construction, cleaning<br />
<strong>and</strong> some health care work, the physical work load<br />
has generally diminished with the automatisation of<br />
industrial processes. Physical activity during leisure<br />
time has to be considered in addition to physical<br />
activity at work when it comes to interpreting the<br />
occupational differences in, e.g., the incidence of<br />
breast <strong>and</strong> colon <strong>cancer</strong>s.<br />
In Finl<strong>and</strong>, occupation specific SMRs were calculated<br />
in two ways: first based on one single census<br />
(1980) <strong>and</strong> then restricted to persons who had<br />
stayed in the same occupation in subsequent censuses.<br />
The SMR estimates were practically identical<br />
[157]. We believe that the present results based on<br />
occupation in one census give, in most instances,<br />
similar results that we would have gotten from<br />
categorisations based on occupational titles kept in<br />
several censuses. This phenomenon will be studied<br />
in detail in specific NOCCA studies in restricted<br />
data sets for which we have data on several censuses<br />
available.<br />
Validity of <strong>cancer</strong> incidence data<br />
Nordic countries are well known of their long<br />
tradition of high-quality population-based <strong>cancer</strong><br />
registration [158]. In Denmark, several independent<br />
studies indicate a good coverage of the <strong>cancer</strong><br />
registration from the very beginning in 1943. Comparison<br />
between 1977 data from the newly established<br />
hospital discharge register <strong>and</strong> the <strong>cancer</strong><br />
register showed that 95% of the <strong>cancer</strong> cases in the<br />
hospital discharge register were also known in the<br />
<strong>cancer</strong> register, with the deficits seen for <strong>cancer</strong>s of<br />
the digestive organs, breast, female genital organs<br />
<strong>and</strong> lymphatic <strong>and</strong> haematopoietic tissue [159]. In<br />
1997, the registration of <strong>cancer</strong> in Denmark was<br />
moved from the Danish Cancer Society to the<br />
National Board of Health to be part of other national<br />
registration activities <strong>and</strong> based on electronic data<br />
capture. The change caused severe delays both in the<br />
<strong>cancer</strong> registration process <strong>and</strong> the mortality reporting,<br />
<strong>and</strong> in May 2008 the newest statistics were from<br />
2003. The effects of the system change on the<br />
coverage <strong>and</strong> accuracy are not yet known.<br />
Cancer registration in Norway has been compulsory<br />
from 1953, <strong>and</strong> was from the beginning based<br />
on a combination of reporting from clinical <strong>and</strong><br />
pathology departments [160]. A comparative study<br />
was undertaken for two counties in 1976 between<br />
the <strong>cancer</strong> register data <strong>and</strong> data retrieved from the<br />
Economic <strong>and</strong> Medical Information System. The<br />
study showed an overall completeness of the <strong>cancer</strong><br />
register of 98%, with the deficit coming in particular<br />
from leukaemia <strong>and</strong> multiple myeloma [192]. For all<br />
<strong>cancer</strong>s registered since 1953, 86.5% are histologically<br />
verified, <strong>and</strong> 1.3% of the diagnoses are based<br />
on death certificates alone [161].<br />
Cancer registration in Finl<strong>and</strong> is, like in Norway,<br />
based on a combination of reporting from clinical<br />
<strong>and</strong> pathological departments, <strong>and</strong> the registration<br />
has been compulsory since 1961. A linkage was<br />
made between the data from the <strong>cancer</strong> register <strong>and</strong><br />
from the national hospital discharge register for<br />
1985 1988. The agreement was good (about 99%)<br />
for most diagnostic groups, but showed about a 10%<br />
underreporting in the <strong>cancer</strong> register for benign<br />
neoplasms of the central nervous system, mainly<br />
among elderly people, chronic lymphatic leukaemia<br />
<strong>and</strong> multiple myeloma [162]. The main problem<br />
was slowness of reporting of these diseases; most<br />
of them were later reported via the normal registration<br />
procedure. The same phenomenon has been<br />
reported from other Nordic countries, e.g. Denmark<br />
[163] <strong>and</strong> Icel<strong>and</strong> [164].<br />
The Icel<strong>and</strong>ic Cancer Registry, which was<br />
founded in 1954, receives electronic notifications<br />
from the pathology <strong>and</strong> haematology laboratories on<br />
all <strong>cancer</strong>s <strong>and</strong> other reportable neoplasms in the<br />
country that are diagnosed at those laboratories.<br />
This information is supplemented by reports from<br />
hospital departments, healthcare facilities, privatepracticing<br />
consultants <strong>and</strong> information on death<br />
certificates. Recent results from record linkage with<br />
the Hospital Discharge Registry indicate 99% completeness<br />
of the registry [164].<br />
The registration procedure in Sweden has been<br />
somewhat different, as death certificates have not<br />
been used as a data source. Validation studies have<br />
been made by linking the cause of death registry with<br />
the <strong>cancer</strong> registry [165,166]. The studies showed a<br />
drop out in completeness of a maximum of 4.5%,
Acta Oncol Downloaded from informahealthcare.com by 212.35.100.66 on 04/06/11<br />
For personal use only.<br />
with the deficits seen for prostate <strong>cancer</strong>, stomach<br />
<strong>cancer</strong>, myeloma <strong>and</strong> leukaemia.<br />
The small inaccuracies in <strong>cancer</strong> registration are<br />
not likely to affect the SIR estimates of the present<br />
study because they are not related to occupation. The<br />
accuracy of the diagnostic procedure, instead, may<br />
vary over educational <strong>and</strong> socio-economic strata, <strong>and</strong><br />
there may even be occupation-specific special features<br />
such as annual health controls that directly<br />
affect the likelihood of a non-symptomatic <strong>cancer</strong><br />
diagnosis of the employee. Most of the categories<br />
with the highest <strong>and</strong> lowest incidence of unspecified<br />
<strong>cancer</strong>s in the present study (Tables 78, 79) were also<br />
among the top <strong>and</strong> bottom risk occupations of all<br />
<strong>cancer</strong>s combined (Tables 80, 81). Hence, the likelihood<br />
of getting a proper diagnosis for the <strong>cancer</strong><br />
seems not to vary markedly between occupations.<br />
Accuracy of linkage <strong>and</strong> person-year calculation<br />
The linkage between the census data, the mortality<br />
<strong>and</strong> emigration data <strong>and</strong> the <strong>cancer</strong> incidence data<br />
was based on the unique personal identity codes<br />
used in all five countries. Apart from errors in the<br />
identifiers, which are extremely rare, the method<br />
thus by definition ensured a complete ascertainment<br />
of relevant events [158].<br />
If the follow-up for vital status would be incomplete,<br />
there would be a risk of bias related to the<br />
occupational variation in general mortality. Fortunately<br />
the Nordic population register systems offer<br />
very accurate data on the vital status of all residents,<br />
<strong>and</strong> therefore the person-year calculations in the<br />
present study are precise.<br />
Statistical significance<br />
We present in this study SIRs for men <strong>and</strong> women,<br />
five countries, 54 occupational categories <strong>and</strong> close<br />
to 80 diagnostic groups, i.e., about 40 000 SIRs.<br />
Inevitably, many of these combinations will by<br />
chance come out with significantly high or low<br />
SIRs. In the interpretation of the findings, it is<br />
therefore important to pay attention not only to the<br />
size of the SIRs or the confidence intervals, but also<br />
to the consistency across countries <strong>and</strong> the biological<br />
plausibility.<br />
The present study covers up to 45 years of <strong>cancer</strong><br />
incidence in the population born between 1896 <strong>and</strong><br />
1960 <strong>and</strong> living in the five Nordic countries;<br />
Denmark, Finl<strong>and</strong>, Icel<strong>and</strong>, Norway <strong>and</strong> Sweden.<br />
Almost 15 million persons were included in the<br />
study, <strong>and</strong> close to 385 million person years at risk<br />
were accumulated. Approximately 3 million incident<br />
<strong>cancer</strong> cases occurred during the follow-up<br />
<strong>Occupation</strong> <strong>and</strong> <strong>cancer</strong> in Nordic countries 771<br />
period. The present study is thus the largest study<br />
ever reported on occupational <strong>cancer</strong> incidence.<br />
Due to the huge size of the study, many of the<br />
observations that are statistically significant correspond<br />
to such a small deviation from unity that it<br />
has no practical implication. For instance, a great<br />
majority of the 54 occupation-specific SIRs for<br />
all sites combined were statistically significant (42<br />
SIRs among the men <strong>and</strong> 40 among the women),<br />
although the relative risk difference in some instances<br />
was not more than some 2% as compared<br />
with the reference rate.<br />
Selection of reference rates<br />
Selection of the reference population has an effect on<br />
the SIR values. In the present paper, the expected<br />
numbers of <strong>cancer</strong> cases were based on national<br />
incidence rates. The other easily available option as<br />
to the reference rates would have been to use the<br />
rates calculated for the entire Nordic population.<br />
SIRs based on national rates <strong>and</strong> on Nordic incidence<br />
are dissimilar for <strong>cancer</strong>s with large variation<br />
in incidence levels between the countries. In testicular<br />
<strong>cancer</strong> the incidence rate in Denmark during<br />
the follow-up period of the present study was about<br />
twofold, in Finl<strong>and</strong> only one-half of the Nordic<br />
average (Figure 34). The SIR for testicular <strong>cancer</strong><br />
among Finnish seamen based on the national<br />
reference rate was 2.29 (95%CI 1.18 4.00, 12<br />
cases), but only 1.06 (0.55 1.86) if based on the<br />
combined Nordic rate (Table 83). In turn, the SIR<br />
for Danish farmers increases from 0.84 (0.71 0.98,<br />
155 cases) to 1.75 (1.49 2.04) if Nordic rates are<br />
used instead of Danish rates. In comparison to the<br />
Nordic reference rates, virtually all occupationspecific<br />
SIRs in Denmark are statistically significantly<br />
increased <strong>and</strong> most SIRs in Finl<strong>and</strong> are<br />
statistically significantly decreased.<br />
There are several factors affecting the general<br />
national incidence rates, including differences in<br />
the prevalence of aetiological factors, diagnostic<br />
procedures <strong>and</strong> even registration practices. These<br />
factors are hardly related to direct occupational<br />
hazards, <strong>and</strong> therefore we decided that in a study<br />
aiming at describing relative risks related to occupation,<br />
it is best justified to compare the incidence of<br />
<strong>cancer</strong> in a given occupation in a given country with<br />
the general population in the same country.<br />
There is also variation in the background <strong>cancer</strong><br />
incidence within countries (Figure 50, [167]). If a<br />
given occupation is concentrated in specific regions,<br />
then the national reference rate may not be fully<br />
appropriate. Previous studies (e.g., Pukkala et al.,<br />
1997 [168]), however indicate that the use of
Acta Oncol Downloaded from informahealthcare.com by 212.35.100.66 on 04/06/11<br />
For personal use only.<br />
772 E. Pukkala et al.<br />
Figure 50. Age adjusted (World) incidence rates of <strong>cancer</strong> (all sites) in the Nordic countries in 1998 2003, by gender, based on<br />
municipality specific observations [167].<br />
regional reference rates instead of whole-nation rates<br />
does not markedly affect the SIR estimates.<br />
General lifestyle factors<br />
Not all associations between occupations <strong>and</strong> specific<br />
<strong>cancer</strong> diseases found in the present study<br />
reflect risks caused by exposures at the work place.<br />
Besides work place exposures, the occupational<br />
categories also vary in their exposures to other risk<br />
factors. Such major risk factors include tobacco<br />
smoking, alcohol consumption, dietary habits <strong>and</strong><br />
reproductive patterns.<br />
<strong>Occupation</strong> <strong>and</strong> tobacco smoking. The prevalence of<br />
smoking in the Nordic countries has varied over<br />
decades <strong>and</strong> been different in men <strong>and</strong> women as<br />
described in the Introduction. Smoking has also<br />
been differentially distributed across socio-economic<br />
strata <strong>and</strong> occupations.<br />
Four stages of the so-called smoking epidemic<br />
have been described based on empirical data, also<br />
including the Nordic countries [169 171]:<br />
(1) The prevalence of smoking is low <strong>and</strong> mainly<br />
a habit of higher socio-economic groups;<br />
(2) Smoking becomes more common, rates<br />
among men are at their peak, <strong>and</strong> may be<br />
equal among the socio-economic groups or<br />
higher among higher socio-economic groups.<br />
Women follow the smoking patterns of men<br />
with a lag of 10 20 years, with the higher<br />
socio-economic groups taking up the smoking<br />
habit;<br />
(3) Prevalence rates among men decrease, as<br />
many quit smoking, especially those in the<br />
higher social strata. Among women, the<br />
smoking prevalence peaks before a decline<br />
sets in by the end of this stage;<br />
(4) Prevalence rates keep declining slowly for<br />
both men <strong>and</strong> women, <strong>and</strong> smoking becomes<br />
progressively more a habit of the lower socioeconomic<br />
groups.<br />
Although the actual smoking prevalence <strong>and</strong> the<br />
pace of passing through the different stages have<br />
differed between the countries, the Nordic countries<br />
presently can be considered to be in late-stage 3 or<br />
stage 4.<br />
Many of the occupational differences may be<br />
ascribed to socio-economic differences in smoking.<br />
Farmers have been consistently seen to have a lower<br />
smoking prevalence than those employed in manufacture.<br />
Some occupations have characteristics that<br />
influence the probability of being a smoker. For<br />
example, for a person working in the health care<br />
sector, or as a teacher, it was not possible to smoke<br />
during the active working hours, while in tobacco<br />
workers, the former tradition of quotas of free<br />
cigarettes increased the smoking probability.<br />
The smoking prevalence by occupation for Norwegian<br />
men <strong>and</strong> women has been estimated in a<br />
series of health surveys in 1965 1981 linked to<br />
the 1970 census (Table 84; [83]). Among men
Acta Oncol Downloaded from informahealthcare.com by 212.35.100.66 on 04/06/11<br />
For personal use only.<br />
Table 83. St<strong>and</strong>ardized incidence ratios for testis <strong>cancer</strong> based on country specific incidence rates (SIR c) <strong>and</strong> Nordic incidence rates<br />
(SIRn), by occupational category. Only occupations where sum of observed cases ]20 in Denmark <strong>and</strong> Finl<strong>and</strong> are included.<br />
over 16 years of age, the proportion of current<br />
smokers was highest among painters (69.1%) <strong>and</strong><br />
smelting workers (68.4%). Most of the groups<br />
consisting of manual workers had a smoking prevalence<br />
above 60%. The lowest proportion was<br />
seen among teachers (33.2%). Among women,<br />
mechanics, plumbers <strong>and</strong> welders had the highest<br />
prevalence of smokers (65.9%), while the prevalence<br />
rate among farmers <strong>and</strong> gardeners was only 12.4%.<br />
In Finl<strong>and</strong> in 1968, 46% of men working in<br />
agriculture smoked compared with 61% of men<br />
working in manufacture [32]. These percentages<br />
had decreased to 34% <strong>and</strong> 49%, respectively in 1978<br />
[172], <strong>and</strong> to 33% <strong>and</strong> 44% in 1990 [172].<br />
<strong>Occupation</strong>-specific rates of current smokers based<br />
on surveys of health habits of the Finnish adult<br />
population in 1978 1991 have been created as part<br />
of FINJEM [173]. The prevalence in males varies<br />
from 9% among architects, <strong>and</strong> 13% among primary<br />
school teachers <strong>and</strong> clergy to 56% among cooks <strong>and</strong><br />
building h<strong>and</strong>s, 58% among dockers, 59% among<br />
miners <strong>and</strong> 62% among service station attendants.<br />
In women, smoking was very rare among farmers<br />
<strong>Occupation</strong> <strong>and</strong> <strong>cancer</strong> in Nordic countries 773<br />
Denmark Finl<strong>and</strong> All Nordic countries<br />
No <strong>Occupation</strong>al category Obs SIRc SIRn Obs SIRc SIRn Obs SIRc 95% CI SIRn 95% CI<br />
1 Technical workers, etc. 128 1.01 2.05 79 1.14 0.54 680 1.06 0.99*1.15 1.02 0.95*1.10<br />
3 Physicians 16 1.72 3.52 4 1.00 0.47 67 1.48 1.15*1.88 1.56 1.21*1.98<br />
8 Teachers 68 1.15 2.37 32 1.35 0.62 277 1.06 0.94*1.19 1.12 0.99*1.26<br />
9 Religious workers etc. 17 0.92 1.85 26 1.42 0.70 228 1.30 1.15*1.49 1.29 1.13*1.47<br />
12 Administrators 121 1.04 2.09 46 1.39 0.65 407 1.18 1.07*1.30 1.31 1.19*1.45<br />
13 Clerical workers 81 1.37 2.74 25 1.24 0.58 314 1.14 1.02*1.27 1.19 1.06*1.32<br />
14 Sales agents 35 1.10 2.19 29 0.89 0.42 344 1.05 0.94*1.17 0.98 0.88*1.09<br />
15 Shop workers 134 1.19 2.36 11 0.66 0.31 246 1.07 0.95*1.22 1.31 1.15*1.48<br />
16 Farmers 155 0.84 1.75 81 1.10 0.50 521 0.97 0.89*1.06 0.99 0.91*1.08<br />
17 Gardeners 21 0.80 1.62 15 0.86 0.39 157 1.03 0.88*1.20 0.94 0.81*1.10<br />
19 Forestry workers 2 0.58 1.16 18 0.86 0.39 70 0.70 0.54*0.88 0.54 0.42*0.68<br />
21 Seamen 14 0.93 1.76 12 2.29 1.06 90 0.86 0.69*1.06 1.05 0.84*1.29<br />
22 Transport workers 22 0.92 1.83 16 1.30 0.59 120 1.07 0.89*1.28 1.03 0.86*1.23<br />
23 Drivers 85 0.93 1.80 42 0.81 0.37 379 0.94 0.85*1.04 0.92 0.83*1.02<br />
24 Postal workers 20 0.98 1.99 10 1.23 0.58 87 1.06 0.85*1.31 1.11 0.89*1.36<br />
25 Textile workers 16 1.25 2.45 7 1.83 0.83 60 1.17 0.89*1.50 1.17 0.89*1.50<br />
27 Smelting workers 31 0.80 1.55 2 0.30 0.14 90 0.81 0.65*1.00 0.89 0.72*1.10<br />
28 Mechanics 99 1.00 1.95 51 0.89 0.42 501 0.87 0.79*0.94 0.85 0.78*0.92<br />
31 Electrical workers 30 1.08 2.13 21 0.76 0.36 216 0.92 0.81*1.06 0.88 0.77*1.01<br />
32 Wood workers 65 1.03 2.05 33 0.80 0.37 364 1.02 0.92*1.13 1.00 0.91*1.11<br />
33 Painters 25 1.15 2.25 11 1.06 0.49 87 0.91 0.73*1.12 0.89 0.71*1.09<br />
34 ‘‘Other construction workers’’ 54 0.85 1.62 18 0.66 0.31 158 0.79 0.67*0.92 0.78 0.66*0.91<br />
35 Bricklayers 26 1.10 2.15 3 0.69 0.32 58 1.06 0.80*1.37 1.19 0.91*1.54<br />
36 Printers 23 1.31 2.58 7 1.03 0.49 90 1.25 1.01*1.54 1.28 1.03*1.58<br />
37 Chemical process workers 13 1.16 2.23 9 1.04 0.48 64 0.82 0.63*1.05 0.79 0.61*1.01<br />
38 Food workers 39 0.92 1.80 6 0.97 0.45 107 0.92 0.76*1.11 1.07 0.89*1.30<br />
41 Glass makers etc. 14 0.62 1.21 12 1.24 0.59 76 0.82 0.65*1.03 0.81 0.64*1.02<br />
42 Packers 12 0.67 1.25 15 0.89 0.42 144 0.96 0.82*1.13 0.92 0.78*1.08<br />
43 Engine operators 15 0.63 1.23 17 0.61 0.28 126 0.74 0.62*0.88 0.67 0.56*0.80<br />
44 Public safety workers 14 0.69 1.38 10 0.68 0.32 110 1.02 0.84*1.23 0.97 0.80*1.17<br />
48 Building caretakers 27 1.45 2.79 13 1.22 0.58 96 1.22 0.99*1.50 1.21 0.98*1.48<br />
52 Military personnel 14 0.94 1.89 12 1.83 0.85 81 1.16 0.92*1.44 1.20 0.95*1.49<br />
53 ‘‘Other workers’’ 63 0.94 1.75 10 0.75 0.36 211 0.89 0.78*1.02 1.00 0.87*1.14<br />
54 Economically inactive 44 1.12 1.84 78 1.33 0.70 409 1.12 1.02*1.24 1.04 0.94*1.15<br />
(2%), deacons (3%), primary school teachers (5%)<br />
<strong>and</strong> dentists (6%) while 46% of female marketing<br />
workers <strong>and</strong> 42% of waiters in restaurants were<br />
regular smokers.<br />
In Sweden, 19% of male farmers <strong>and</strong> 40% of<br />
male industrial workers were daily smokers in<br />
1982 1983 [31]. In Denmark, the prevalence of<br />
male smokers in 1990 varied from 29% of male<br />
higher educated salaried employees to 58% among<br />
unskilled workers [29].<br />
In Icel<strong>and</strong>, surveys from 1985 1988 showed a<br />
different pattern of smoking habits among those in<br />
various industries. Among men 18 69 years old,<br />
50% of those in the fishing <strong>and</strong> fishing industry were<br />
daily smokers versus 37% of those in sales <strong>and</strong><br />
service work, 39% of industrial workers, 34% of<br />
those in farming, 30% of those in civil service <strong>and</strong><br />
28% of those in the group ‘‘others’’. Among women<br />
of the same age 51% in the fishing <strong>and</strong> fishing<br />
industry were daily smokers versus 40% in sales<br />
<strong>and</strong> service work, 34% in industry, 27% in farming,<br />
29% in civil service <strong>and</strong> 30% of those in the group<br />
‘‘others’’ [174].
Acta Oncol Downloaded from informahealthcare.com by 212.35.100.66 on 04/06/11<br />
For personal use only.<br />
774 E. Pukkala et al.<br />
Table 84. Estimated proportion of current smokers in the Norwegian study populaton (1965 1981), by occupational category. Only<br />
groups 10 are included [83].<br />
Haldorsen <strong>and</strong> co-workers [83] used data on<br />
occupational smoking habits to control for confounding<br />
by smoking on the occupational lung<br />
<strong>cancer</strong> risk seen in the Norwegian part of the<br />
previous census-based follow-up study [1] (Table<br />
85; adapted from Haldorsen et al. 2004 [83]). The<br />
relationship between smoking habits <strong>and</strong> lung<br />
<strong>cancer</strong> risk was estimated for 12 groups considered<br />
not to be occupationally exposed to lung carcinogens,<br />
<strong>and</strong> this relationship was used to control<br />
for smoking in the remaining groups possibly<br />
exposed to lung carcinogens through their work.<br />
In most of the probably exposed groups (such<br />
as welders, plumbers, painters, bricklayers, smelters,<br />
glass workers, beverage workers, launderers,<br />
Men Women<br />
No <strong>Occupation</strong>al category Number % Number %<br />
1, 2 Technical workers, etc./Laboratory assistants 498 45.8 13 18.3<br />
3,4 Physicians/Dentists 81 46.0<br />
5, 6, 7 Nurses/Assistant nurses/‘‘Other health workers’’ 54 57.4 268 34.0<br />
8 Teachers 248 33.2 115 22.1<br />
9 Religious workers etc. 137 37.8 34 29.1<br />
10, 11 Artistic workers/Journalists 92 54.8 15 28.8<br />
12 Administrators 542 46.2 62 45.6<br />
13 Clerical workers 663 55.3 555 40.3<br />
14, 15 Sales agents/Shop workers 839 57.8 415 40.4<br />
16, 17 Farmers/Gardeners 1 685 42.6 83 12.4<br />
18 Fishermen 475 63.3<br />
19 Forestry workers 176 53.0<br />
20 Miners <strong>and</strong> quarry workers 92 58.6<br />
21 Seamen 531 64.7<br />
22 Transport workers 232 58.0<br />
23 Drivers 740 62.1<br />
24 Postal workers 121 53.1 70 35.2<br />
25, 26 Textile workers/Shoe <strong>and</strong> leather workers 191 57.0 94 37.8<br />
27 Smelting workers 143 68.4<br />
28, 29, 30 Mechanics/Plumbers/Welders 1 194 62.7 27 65.9<br />
31 Electrical workers 397 57.8 13 41.9<br />
32 Wood workers 1 028 55.2<br />
33 Painters 181 69.1<br />
34, 35 ‘‘Other construction workers’’/Bricklayers 394 62.7<br />
36 Printers 126 62.4 11 42.3<br />
37 Chemical process workers 154 67.0 13 59.1<br />
38, 39, 40 Food workers/Beverage workers/Tobacco workers 307 63.8 24 26.1<br />
41 Glass makers etc. 136 63.3 26 47.3<br />
42 Packers 275 60.4 72 51.1<br />
43 Engine operators 300 63.0<br />
44 Public safety workers 182 60.7<br />
45, 46, 47 Cooks <strong>and</strong> stewards/Domestic assistants/Waiters 138 63.9 328 35.7<br />
48, 49 Building caretakers/Chimney sweeps 125 56.3 382 39.6<br />
52 Military personnel 49 47.1<br />
50, 51, 53 Hairdressers/Launderers/‘‘Other workers’’ 664 57.5 67 38.7<br />
54 Economically inactive 1 480 48.3 5 237 23.2<br />
1 54 All categories 14 670 53.7 7 961 26.2<br />
<strong>and</strong> tobacco workers), initial SIRs were above 1.00,<br />
<strong>and</strong> adjustment led to further elevation of the risk<br />
estimate, indicating an effect of occupational exposure.<br />
On the other h<strong>and</strong>, the initially significantly<br />
elevated SIRs for waiters <strong>and</strong> cooks were lowered to<br />
unity after smoking adjustment, indicating smoking<br />
habits to be the main explanation for the elevated<br />
risk. For physicians <strong>and</strong> dentists, the smoking<br />
adjustment further decreased the already low<br />
SIRs, indicating a lower smoking prevalence as<br />
compared to other occupations. The risk estimate<br />
for gardeners changed from being significantly low<br />
to being significantly high, which might be an<br />
indication of exposure to lung carcinogens (or of<br />
imprecise smoking data). The results summarised
Acta Oncol Downloaded from informahealthcare.com by 212.35.100.66 on 04/06/11<br />
For personal use only.<br />
<strong>Occupation</strong> <strong>and</strong> <strong>cancer</strong> in Nordic countries 775<br />
Table 85. Original SIR <strong>and</strong> smoking adjusted lung <strong>cancer</strong> SIR by occupation among 893 264 Norwegian men followed-up<br />
1971 1991 [83].<br />
Unadjusted Adjusted<br />
No <strong>Occupation</strong>al category Obs SIR SIR 95% CI<br />
1<br />
Potentially exposed<br />
Technical workers, etc. 321 0.64 0.91 0.8*1.0<br />
2 Laboratory assistants 28 0.93 1.25 0.8*1.8<br />
3 Physicians 32 0.49 0.37 0.3*0.5<br />
4 Dentists 20 0.73 0.60 0.4*0.9<br />
5 Nurses 3 0.68 1.13 0.2*3.3<br />
6 Assistant nurses 10 0.76 1.22 0.6*2.2<br />
7 ‘‘Other health workers’’ 23 0.65 1.05 0.7*1.6<br />
18 Fishermen 436 1.16 1.21 1.1*1.3<br />
20 Miners <strong>and</strong> quarry workers 162 1.39 1.65 1.4*1.9<br />
21 Seamen 585 1.69 1.25 1.2*1.4<br />
22 Transport workers 275 0.90 1.21 1.1*1.4<br />
23 Drivers 940 1.38 1.58 1.5*1.7<br />
25 Textile workers 103 0.74 1.07 0.9*1.3<br />
26 Shoe <strong>and</strong> leather workers 36 0.89 1.27 0.9*1.8<br />
27 Smelting workers 326 1.39 1.63 1.5*1.8<br />
28 Mechanics 1 254 1.31 1.44 1.4*1.5<br />
29 Plumbers 153 1.34 1.49 1.3*1.8<br />
30 Welders 211 1.31 1.48 1.3*1.7<br />
31 Electrical workers 429 1.06 1.34 1.2*1.5<br />
32 Wood workers 1 118 0.83 1.25 1.2*1.3<br />
33 Painters 260 1.38 1.52 1.3*1.7<br />
34 ‘‘Other construction workers’’ 596 1.05 1.28 1.2*1.4<br />
35 Bricklayers 162 1.26 1.57 1.3*1.8<br />
36 Printers 122 1.18 1.44 1.2*1.7<br />
37 Chemical process workers 367 1.26 1.37 1.2*1.5<br />
38 Food workers 342 1.20 1.29 1.2*1.4<br />
39 Beverage workers 30 1.92 2.07 1.4*3.0<br />
40 Tobacco workers 8 2.12 2.28 1.0*4.5<br />
41 Glass makers etc. 286 1.30 1.73 1.5*1.9<br />
42 Packers 701 1.36 1.44 1.3*1.6<br />
43 Engine operators 369 1.29 1.34 1.2*1.5<br />
44 Public safety workers 200 1.02 1.10 1.0*1.3<br />
45 Cooks <strong>and</strong> stewards 92 1.48 1.00 0.8*1.2<br />
46 Domestic assistants 3 3.93 2.25 0.5*6.6<br />
47 Waiters 45 1.66 1.08 0.8*1.4<br />
48 Building caretakers 253 1.27 1.30 1.1*1.5<br />
49 Chimney sweeps 14 1.09 1.19 0.7*2.0<br />
50 Hairdressers 35 1.27 1.64 1.1*2.3<br />
51 Launderers 27 1.72 2.22 1.5*3.2<br />
52 Military personnel 130 0.99 1.14 1.0*1.4<br />
53 ‘‘Other workers’’ 194 1.34 1.74 1.5*2.0<br />
54 Economically inactive<br />
Potentially unexposed<br />
1 549 1.41 1.75 1.7*1.8<br />
8 Teachers 168 0.46 1.06 0.9*1.2<br />
9 Religious workers etc. 126 0.59 0.90 0.8*1.1<br />
10 Artistic workers 41 0.83 0.87 0.6*1.2<br />
11 Journalists 21 0.76 0.79 0.5*1.2<br />
12 Administrators 713 0.81 1.01 0.9*1.1<br />
13 Clerical workers 579 0.86 1.01 0.9*1.1<br />
14 Sales agents 605 0.95 1.01 0.9*1.1<br />
15 Shop workers 296 0.98 1.05 0.9*1.1<br />
16 Farmers 755 0.42 0.93 0.9*1.0<br />
17 Gardeners 127 0.69 1.54 1.3*1.8<br />
19 Forestry workers 88 0.47 0.94 0.8*1.2<br />
24 Postal workers 107 0.79 1.02 0.8*1.2
Acta Oncol Downloaded from informahealthcare.com by 212.35.100.66 on 04/06/11<br />
For personal use only.<br />
776 E. Pukkala et al.<br />
above are largely supportive of the interpretation<br />
that the varying smoking habits do not explain all<br />
the occupational variation in risk.<br />
<strong>Occupation</strong> <strong>and</strong> alcohol consumption. Alcohol consumption<br />
is, like tobacco smoking, unevenly distributed<br />
across the occupational categories. The<br />
sparse data indicate that the higher social classes<br />
<strong>and</strong> some categories within the lowest social classes<br />
have had the highest <strong>and</strong> farmers the lowest average<br />
alcohol consumption. Alcohol consumption was<br />
throughout the study period higher in Denmark<br />
than in the other Nordic countries (Figure 4). In<br />
Denmark, 23% of men in 1976 reported consumption<br />
of 11 alcoholic drinks or more per week. The<br />
proportion was 30% in university graduates <strong>and</strong><br />
office workers, but only 7% among farmers. Five<br />
percent of women reported consumption of at<br />
least 11 alcoholic drinks per week. Consumption of<br />
wine increased after Denmark joined the <strong>European</strong><br />
<strong>Union</strong> in 1972, <strong>and</strong> wine consumption in 1985<br />
showed a marked social class gradient from 41% in<br />
university graduate workers to 4% in blue-collar<br />
workers. Beer consumption showed the opposite<br />
trend with 38% in academic occupations <strong>and</strong> 75%<br />
in blue-collar workers [175].<br />
Beverage manufacture workers in Denmark<br />
[176], <strong>and</strong> male waiters <strong>and</strong> cooks in Norway<br />
[177] have reported higher consumption of alcoholic<br />
beverages than the general population. In Finl<strong>and</strong>,<br />
the highest indices for alcohol-related utilisation of<br />
health care resources in the early 1970s were<br />
obtained among labourers, painters, seamen, construction<br />
workers, forestry workers, artists <strong>and</strong><br />
journalists [178]. FINJEM includes estimates of<br />
average alcohol consumption in each occupation<br />
based on surveys of health habits of the Finnish<br />
adult population 1978 1991 [173]. In males, the<br />
consumption was lowest among clergymen (10 g<br />
of alcohol per week, agricultural workers (36 g)<br />
<strong>and</strong> bench carpenters (39 g). The consumption<br />
was highest among waiters in restaurants (219 g),<br />
dockers (197 g) <strong>and</strong> engineers in ships (197 g). In<br />
women the consumption was highest (78 98 g of<br />
alcohol per week) among journalists, commercial<br />
managers <strong>and</strong> musicians) <strong>and</strong> lowest (7 g) among<br />
farmers.<br />
In Sweden, a high consumption of alcohol is more<br />
common among men than among women, <strong>and</strong><br />
highest among men with a low level of education.<br />
Swedish women with a high level of education have<br />
had higher alcohol consumption than women in<br />
manual occupations [89].<br />
In the present study, it was seen that occupations<br />
with easy access to alcohol <strong>and</strong> with cultural tradi-<br />
tions of alcohol consumption also have a high risk<br />
of <strong>cancer</strong>s associated with alcohol consumption.<br />
Table 86 shows the mortality from alcohol related<br />
liver disease <strong>and</strong> the incidence of alcohol related<br />
<strong>cancer</strong> by occupation in the Nordic countries<br />
combined in the cohort of the present study.<br />
‘‘Alcohol related <strong>cancer</strong>’’ has been defined here as<br />
<strong>cancer</strong> of the mouth, tongue, pharynx, larynx,<br />
oesophagus, <strong>and</strong> liver. There are other <strong>cancer</strong> sites<br />
with an established association with alcohol, such as<br />
colorectal <strong>cancer</strong> <strong>and</strong> breast <strong>cancer</strong>, but these were<br />
not included due to the weaker associations with<br />
alcohol <strong>and</strong> presumed lower attributable fractions.<br />
In the group’alcohol related liver disease’, alcoholic<br />
liver cirrhosis, fatty liver, hepatitis, fibrosis, <strong>and</strong><br />
hepatic failure have been included (ICD-7 581.1,<br />
ICD-8 571.0, ICD-9 571.0-3, ICD-10 K70).<br />
High-risk groups are, to a large extent, the same<br />
for both diagnostic groups, supporting the interpretation<br />
that alcohol consumption is the main factor<br />
explaining the high risk of <strong>cancer</strong> of the upper<br />
aerodigestive tract <strong>and</strong> liver among, for instance,<br />
waiters <strong>and</strong> waitresses, male beverage workers,<br />
female journalists <strong>and</strong> seamen. Farmers <strong>and</strong> teachers<br />
are among the low risk groups for both genders. It<br />
should be noted, that all <strong>cancer</strong> sites included in the<br />
group’ alcohol related <strong>cancer</strong>’, except liver <strong>cancer</strong>,<br />
are also related to tobacco smoking. This may<br />
explain why some occupational categories, for instance<br />
male drivers, shoe <strong>and</strong> leather workers, <strong>and</strong><br />
engine operators, <strong>and</strong> female smelting workers <strong>and</strong><br />
launderers, have an elevated risk for the’ alcohol<br />
related <strong>cancer</strong>s’ but not for the’ alcohol related liver<br />
diseases’. In these groups, smoking may play a<br />
relatively stronger role than alcohol consumption in<br />
the elevating risk of upper aerodigestive tract <strong>cancer</strong>,<br />
but this finding may also point to possible carcinogenic<br />
occupational exposures.<br />
<strong>Occupation</strong> <strong>and</strong> dietary habits. Foods rich in fibre<br />
probably decrease the risk of colorectal <strong>cancer</strong>,<br />
while diets rich in fruits <strong>and</strong> vegetables probably<br />
decrease the risk of <strong>cancer</strong> in several sites such as<br />
mouth, pharynx, larynx, oesophagus, stomach, colorectum,<br />
lung, pancreas, <strong>and</strong> prostate. Red meat<br />
<strong>and</strong> processed meat have been convincingly shown<br />
to increase the risk of colorectal <strong>cancer</strong>, <strong>and</strong> diets<br />
rich in milk may also increase the risk. There is<br />
limited evidence for an association between the<br />
consumption of fat, in particular saturated fat, <strong>and</strong><br />
<strong>cancer</strong>s of the lung, breast <strong>and</strong> prostate [179].<br />
There is very little systematic information on<br />
dietary habits according to occupational category.<br />
More information is available on diet according to<br />
the socio-economic status or education. Several
Acta Oncol Downloaded from informahealthcare.com by 212.35.100.66 on 04/06/11<br />
For personal use only.<br />
<strong>Occupation</strong> <strong>and</strong> <strong>cancer</strong> in Nordic countries 777<br />
Table 86. Observed number (Obs) of incident cases of alcohol related <strong>cancer</strong> (alcohol <strong>cancer</strong>s) <strong>and</strong> number of deaths from alcohol related<br />
non-malignant liver disease (liver disease) <strong>and</strong> st<strong>and</strong>ardised incidence/mortality ratio (SIR/SMR) for the Nordic countries,<br />
1961 2005, by gender <strong>and</strong> occupational category.<br />
Men Women<br />
Alcohol <strong>cancer</strong>s Liver disease Alcohol <strong>cancer</strong>s Liver disease<br />
No <strong>Occupation</strong>al category Obs SIR Obs SMR Obs SIR Obs SMR<br />
1 Technical workers, etc. 4 375 0,79 1 167 0.58 97 0,78 30 0.62<br />
2 Laboratory assistants 78 0,92 22 0.54 48 0,80 29 1.08<br />
3 Physicians 246 0,71 75 0.60 27 0,83 18 1.34<br />
4 Dentists 116 0,84 33 0.80 34 1,09 4 0.45<br />
5 Nurses 8 0,51 8 0.80 37 0,76 70 0.45<br />
6 Assistant nurses 83 0,91 32 1.07 532 0,89 126 0.72<br />
7 ‘‘Other health workers’’ 219 0,81 64 0.67 284 0,86 75 0.68<br />
8 Teachers 1 229 0,61 338 0.45 721 0,79 147 0.53<br />
9 Religious workers etc. 977 0,81 288 0.63 223 0,82 75 0.61<br />
10 Artistic workers 547 1,47 231 1.72 90 1,42 32 1.55<br />
11 Journalists 268 1,53 80 1.25 35 1,29 30 3.02<br />
12 Administrators 3 736 1,04 1 093 0.96 196 1,00 77 1.35<br />
13 Clerical workers 2 618 0,98 800 1.00 2 888 1,06 1 091 1.25<br />
14 Sales agents 3 838 1,20 1 214 1.21 334 1,03 119 1.62<br />
15 Shop workers 2 495 1,11 864 1.18 1 772 0,97 521 1.23<br />
16 Farmers 4 848 0,52 694 0.31 665 0,74 22 0.12<br />
17 Gardeners 1 443 0,65 366 0.64 887 0,85 65 0.31<br />
18 Fishermen 774 0,96 93 0.55 7 1,23 0 0.00<br />
19 Forestry workers 1 122 0,72 294 0.63 6 0,63 2 0.85<br />
20 Miners <strong>and</strong> quarry workers 366 0,99 147 1.36 0 0,00 0 0.00<br />
21 Seamen 1 520 1,83 414 1.64 3 3,91 0 0.00<br />
22 Transport workers 1 265 0,93 342 0.85 31 1,01 4 0.54<br />
23 Drivers 4 628 1,21 1 344 0.96 67 1,31 14 0.94<br />
24 Postal workers 742 0,98 241 0.98 394 0,98 93 0.97<br />
25 Textile workers 701 0,96 181 1.02 939 0,99 124 0.67<br />
26 Shoe <strong>and</strong> leather workers 336 1,23 55 0.91 83 1,02 15 0.82<br />
27 Smelting workers 1 329 1,07 384 1.10 30 1,63 4 0.80<br />
28 Mechanics 5 591 1,04 1 765 0.99 180 1,22 45 1.17<br />
29 Plumbers 716 1,12 344 1.44 0 0,00 1 7.12<br />
30 Welders 617 1,02 237 0.93 9 1,57 5 2.06<br />
31 Electrical workers 1 938 1,02 759 1.07 127 1,14 43 1.22<br />
32 Wood workers 3 475 0,81 906 0.75 75 0,82 29 1.13<br />
33 Painters 1 295 1,19 481 1.48 14 1,17 6 1.66<br />
34 ‘‘Other construction workers’’ 2 964 1,17 1 124 1.45 40 1,46 11 1.87<br />
35 Bricklayers 770 1,18 219 1.18 0 0,00 0 0.00<br />
36 Printers 813 1,30 301 1.39 115 1,28 51 2.11<br />
37 Chemical process workers 937 1,01 227 0.86 75 0,99 25 1.46<br />
38 Food workers 1 416 1,13 392 1.13 400 1,12 96 1.23<br />
39 Beverage workers 235 2,63 90 3.40 31 1,45 10 2.18<br />
40 Tobacco workers 21 1,38 8 1.99 40 1,76 8 1.47<br />
41 Glass makers etc. 1 069 1,06 253 0.81 217 1,23 83 1.88<br />
42 Packers 2 353 1,32 682 1.37 314 1,17 91 1.44<br />
43 Engine operators 1 717 1,07 508 0.81 31 1,36 12 1.43<br />
44 Public safety workers 974 0,94 253 0.69 15 0,76 11 2.04<br />
45 Cooks <strong>and</strong> stewards 463 2,46 159 2.53 400 1,10 85 1.19<br />
46 Domestic assistants 13 1,48 5 1.55 805 0,88 186 0.93<br />
47 Waiters 521 4,23 166 3.48 561 1,53 213 2.50<br />
48 Building caretakers 939 1,11 312 1.16 1 949 1,16 416 1.09<br />
49 Chimney sweeps 89 1,66 27 1.44 0 0,00 0 0.00<br />
50 Hairdressers 259 1,44 84 1.99 180 1,18 48 1.15<br />
51 Launderers 111 0,99 20 0.75 255 1,21 32 0.93<br />
52 Military personnel 554 0,95 168 0.80 4 4,59 0 0.00<br />
53 ‘‘Other workers’’ 3 540 1,29 1 166 1.67 700 1,10 210 1.39<br />
54 Economically inactive 6 195 1,56 3 051 2.59 18 239 1,00 2 651 0.98<br />
1 54 All categories 79 492 1.00 24 571 1.00 35 539 1.00 7 155 1.00
Acta Oncol Downloaded from informahealthcare.com by 212.35.100.66 on 04/06/11<br />
For personal use only.<br />
778 E. Pukkala et al.<br />
studies indicate that persons with a high socioeconomic<br />
status practice more healthy behaviours<br />
than in low socio-economic status groups [180].<br />
The intake of potatoes was higher among men in<br />
the lowest social class in Denmark in 1985 than in<br />
the highest social class, but the intake of vegetables<br />
<strong>and</strong> fruit varied in the opposite direction [119].<br />
Consumption of milk <strong>and</strong> milk products among<br />
men was higher in the highest social class. The<br />
food consumption among women varied less by<br />
social class than among men but showed the<br />
same tendencies. Food consumption by educational<br />
groups among Swedish men in 1989 resembled<br />
that reported for Danish men: there was a higher<br />
consumption of potatoes among the low educated<br />
men compensated by a higher consumption of fruit<br />
<strong>and</strong> vegetables among high educated men [120].<br />
The same pattern was observed among Norwegian<br />
men in 1986 1988 [181].<br />
In Finl<strong>and</strong>, the intake of milk <strong>and</strong> butter in 1992<br />
was significantly higher in men with low education,<br />
whereas the intake of vitamin C <strong>and</strong> carotenoids<br />
was significantly lower than in the highest educational<br />
category [182]. FINJEM includes estimates<br />
of average consumption of food items in each<br />
occupation based on surveys on health habits of<br />
the Finnish adult population 1978 1991 [173].<br />
Regular use of butter is considered to be a proxy<br />
of a less healthy diet. In men, the proportion was<br />
low among university teachers (16%) <strong>and</strong> architects<br />
(17%) <strong>and</strong> highest among farmers (70%), miners<br />
(63%) <strong>and</strong> forestry workers (60%). In women, the<br />
variation was from 11 12% among university teachers<br />
<strong>and</strong> commercial managers to 52% among<br />
butchers <strong>and</strong> dairy workers <strong>and</strong> 67% among farmers<br />
<strong>and</strong> agricultural workers.<br />
In Icel<strong>and</strong>, male unskilled workers, lower service<br />
workers, employers, fishermen <strong>and</strong> farmers consumed<br />
more fat <strong>and</strong> less carbohydrates <strong>and</strong> fibres<br />
than men with higher education. Dietary habits<br />
among women varied less by occupation than among<br />
men but showed the same tendencies [183].<br />
We cannot rule out that some of the associations<br />
we found in our study may be at least partially<br />
explained by socio-economic <strong>and</strong> occupational<br />
differences in dietary habits. The strongest indication<br />
of the potential effect of dietary factors was<br />
in stomach <strong>cancer</strong>, where all low risk occupations<br />
represented high socio-economic status with a diet<br />
presumably rich in fruit <strong>and</strong> vegetable.<br />
<strong>Occupation</strong>, body fatness <strong>and</strong> physical activity. There is<br />
convincing evidence that body fatness is associated<br />
with an increased risk of oesophageal adenocarcinoma,<br />
colorectal <strong>cancer</strong>, pancreatic <strong>cancer</strong>,<br />
endometrial <strong>cancer</strong>, kidney <strong>cancer</strong>, <strong>and</strong> postmenopausal<br />
breast <strong>cancer</strong> [184]. Body fatness is probably<br />
associated with <strong>cancer</strong> of the gallbladder directly<br />
<strong>and</strong> indirectly, through the formation of gallstones.<br />
Abdominal fatness has linked with <strong>cancer</strong>s of the<br />
pancreas, breast, <strong>and</strong> endometrium but is specifically<br />
associated with an increased risk of colorectal <strong>cancer</strong>.<br />
There is limited evidence that body fatness may be<br />
associated with an increased risk for liver <strong>cancer</strong> <strong>and</strong><br />
that low body fatness is associated with lung <strong>cancer</strong><br />
risk [184]. The latter finding may be explained<br />
by residual confounding due to smoking. Highly<br />
educated persons in the Nordic countries tend to be<br />
leaner than persons with limited education.<br />
Physical activity at work, household, commuting<br />
<strong>and</strong> leisure probably reduces the risk of at least<br />
colon <strong>cancer</strong>, postmenopausal breast <strong>cancer</strong> <strong>and</strong><br />
endometrial <strong>cancer</strong> [185]. In the Nordic countries,<br />
as elsewhere, occupations with high physical actvity<br />
tend to be those with short education, such<br />
as miners, forestry workers, fishermen, farmers,<br />
construction workers, cleaning workers or assistant<br />
nurses. On the other h<strong>and</strong>, highly educated persons<br />
who work mainly in sedentary occupations, tend to<br />
do more leisure time exercise.<br />
FINJEM includes estimates of average body mass<br />
index (BMI) in each occupation based on surveys on<br />
the health habits of the Finnish adult population<br />
1978 1991 [173]. Men working as university teachers,<br />
physicians, computer operators or programmers<br />
were leanest (BMI 23.5 24.0), <strong>and</strong> the BMI<br />
was highest (27.7 27.8) in several occupations on<br />
ships. In women, the BMI was lowest among<br />
physiotherapists (22.1), university teachers (22.3)<br />
<strong>and</strong> highest among typographers (27.8) <strong>and</strong> farmers<br />
(26.5). Part of the variation may be attributable<br />
to age distribution (the youngest men tend to be<br />
leanest) <strong>and</strong> physical dem<strong>and</strong>s of the work (strong<br />
muscles increase the weight).<br />
In this first phase of the NOCCA study we did not<br />
yet have means to adjust risk estimates according to<br />
information on body size or physical activity. Thus,<br />
we cannot give numerical estimates on how much of<br />
the occupational variation in <strong>cancer</strong> risk is attributable<br />
to body fatness <strong>and</strong> physical activity. Such<br />
cofactor data will be available in the later phases of<br />
the NOCCA study. On the other h<strong>and</strong>, lack of<br />
physical activity at work can be considered as one<br />
of the most serious occupational health hazards<br />
in the modern work life, <strong>and</strong> thus it is also important<br />
to show risk estimates without adjustment for<br />
work-related physical activity.<br />
<strong>Occupation</strong> <strong>and</strong> reproductive pattern. Reproductive<br />
factors are associated with the risk of <strong>cancer</strong> of the
Acta Oncol Downloaded from informahealthcare.com by 212.35.100.66 on 04/06/11<br />
For personal use only.<br />
reproductive organs in women. The risk of breast<br />
<strong>cancer</strong> decreases with increasing parity, in particular<br />
if the first birth is below the age of 20 [186]. The risk<br />
of endometrial <strong>cancer</strong> decreases with increasing<br />
parity, in particular if the age of the last birth is<br />
above 35 years [100]. The risk of ovarian <strong>cancer</strong><br />
[187] is also decreased with increasing parity without<br />
connection to ages at deliveries [188].<br />
In general, women in higher socio-economic<br />
classes have lower fertility rates. In Norway, for<br />
example, the average age at first birth in occupations<br />
that require high education, such as dentists,<br />
physicians, <strong>and</strong> teachers, is about 5 years higher<br />
than in occupations with short education (Table 87).<br />
The average number of children was highest among<br />
farmers, gardeners, <strong>and</strong> fishermen, while otherwise<br />
the variation was not very large. The percentage<br />
of nulliparous women was highest among seamen<br />
<strong>and</strong> journalists <strong>and</strong> also the parous women in these<br />
categories had few children on average.<br />
There are similar data in Finl<strong>and</strong> from 1985,<br />
including women in ages 40 49 [6], showing similar<br />
fertility patterns as the Norwegians. For instance<br />
the proportion of nulliparous journalists in Finl<strong>and</strong><br />
was 23% (Norway 27%) <strong>and</strong> average number of<br />
children among the parous was 2.0 (Norway 1.5).<br />
For farmers, the proportion of nullipara was 7%,<br />
<strong>and</strong> the average number of children was 3.0 in both<br />
countries.<br />
In Icel<strong>and</strong>, record linkage was done between the<br />
Census <strong>and</strong> the population-based Cohort Study of<br />
the Cancer Detection Clinic, where information on<br />
reproductive factors has been collected since 1964<br />
[189]. This was done as a preparatory phase of the<br />
future analyses of the NOCCA project, where parity<br />
data are required as cofactors in multivariate analysis<br />
on occupational risk factors of hormone-related<br />
<strong>cancer</strong> sites. The average age at first birth among<br />
Icel<strong>and</strong>ic women born in 1935 1950 was 21.8 years,<br />
i.e., about two years younger than in Norway, but<br />
the differences between the occupations with the<br />
oldest age at first birth (physicians, 26.2 years) <strong>and</strong><br />
the youngest age at first birth (B21 years, e.g.,<br />
among shop workers, gardeners, fishermen, shoe<br />
<strong>and</strong> leather workers, printers, food workers <strong>and</strong><br />
launderers) was similar as in Norway. The average<br />
number of children was 2.5 among physicians, but<br />
between 3.1 <strong>and</strong> 3.7 for the other occupations<br />
mentioned above.<br />
In a sample of Danish married women aged 15 49<br />
years <strong>and</strong> interviewed in 1970, 23% of women with<br />
7 9 years of education reported birth of the first<br />
child before age 20, whereas this was the case for<br />
only 2% of women with 12 or more years of<br />
education [190]. The fertility differences were relatively<br />
small among Swedish women born in 1940<br />
<strong>Occupation</strong> <strong>and</strong> <strong>cancer</strong> in Nordic countries 779<br />
1949, with women with only basic education having<br />
on average 2.1 children <strong>and</strong> women with university<br />
education having on average 1.9 children [191].<br />
<strong>Occupation</strong>s with high age at first birth systematically<br />
had elevated SIRs for breast <strong>cancer</strong> in the<br />
current study. In occupations where women had a<br />
high number of children, the risk of breast <strong>cancer</strong> was<br />
low. For <strong>cancer</strong> of the corpus uteri <strong>and</strong> for ovarian<br />
<strong>cancer</strong>, the occupational variation in risk was small<br />
<strong>and</strong> not clearly associated with the fertility pattern.<br />
Socially discriminating <strong>cancer</strong>s<br />
The variation in relative risk across occupational<br />
categories varied considerably between <strong>cancer</strong><br />
types. The <strong>cancer</strong> sites thus formed a hierarchy<br />
from <strong>cancer</strong> sites with large variations to <strong>cancer</strong><br />
sites with small variations (Figure 51). For men,<br />
mesothelioma topped the list with a 20-fold risk<br />
variation between the lowest risk group of farmers<br />
with an SIR of 0.24 (95% CI 0.21 0.28) <strong>and</strong> the<br />
high risk group of plumbers with an SIR of 4.74<br />
(4.18 5.38). In contrast, only a 1.5-fold risk variation<br />
was found for multiple myeloma, where the<br />
SIR varied from 0.79 (0.46 1.26) for laboratory<br />
assistants to 1.31 (0.95 1.78) for launderers.<br />
The risk variation was large for <strong>cancer</strong> sites where<br />
work-related exposures play a marked role. This<br />
was the case for mesothelioma, where the asbestos<br />
exposed plumbers came out with the highest risk for;<br />
lip <strong>cancer</strong>; where the sunlight exposed fishermen had<br />
the highest risk; <strong>and</strong> for <strong>cancer</strong> of the nose, where<br />
the wood dust exposed woodworkers topped the list.<br />
In addition, large risk variations were found for<br />
alcohol <strong>and</strong> tobacco related <strong>cancer</strong>s. Risk variations<br />
were 5-15-fold for <strong>cancer</strong>s of the pharynx, oral<br />
cavity, liver, tongue, larynx, oesophagus <strong>and</strong> lung.<br />
Waiters topped the list on all of these seven <strong>cancer</strong><br />
sites, <strong>and</strong> farmers were at the bottom for six of them.<br />
The SIRs for these occupational categories differ for<br />
most <strong>cancer</strong> sites (Figure 52). Waiters had higher<br />
incidence in most <strong>cancer</strong> sites than farmers, suggesting<br />
that <strong>cancer</strong>-causing factors tend to cluster in<br />
same population categories. The only exception<br />
where farmers had a significantly higher incidence<br />
was lip <strong>cancer</strong> among men. The risk variation<br />
between the female waiters <strong>and</strong> farmers was smaller<br />
than between male ones.<br />
The <strong>cancer</strong> sites with less risk variation were<br />
primarily those less attributable to specific established<br />
aetiological factors related to occupational<br />
exposures or social status. The variation among<br />
men was about twofold for <strong>cancer</strong>s of the testis,<br />
pancreas, kidney, thyroid, colon <strong>and</strong> prostate <strong>and</strong><br />
non-Hodgkin lymphoma, <strong>and</strong> only about 1.5-fold<br />
for <strong>cancer</strong>s of the rectum, soft tissue, <strong>and</strong> brain, as
Acta Oncol Downloaded from informahealthcare.com by 212.35.100.66 on 04/06/11<br />
For personal use only.<br />
780 E. Pukkala et al.<br />
Table 87. Parity for the Norwegian women in the study. Only women born 1935 1950 are included.<br />
No <strong>Occupation</strong>al category Persons Nulliparous (%) Age at first birth Age at last birth Number of children<br />
1 Technical workers, etc. 1 984 18.2 26 30.3 1.7<br />
2 Laboratory assistants 1 754 16.2 25.5 29.6 1.8<br />
3 Physicians 741 16.6 28.1 33.2 2.1<br />
4 Dentists 417 11.5 27.3 31.9 2.0<br />
5 Nurses 14 150 14.4 26.1 31.2 2.1<br />
6 Assistant nurses 13 270 11.8 23.2 28.6 2.2<br />
7 ‘‘Other health workers’’ 11 388 12.4 24.3 29.3 2.1<br />
8 Teachers 25 621 12.9 26.3 31.3 2.1<br />
9 Religious workers etc. 6 294 20.8 26.1 30.8 1.8<br />
10 Artistic workers 1 473 20.8 26.6 30.7 1.6<br />
11 Journalists 533 26.6 26.6 30.4 1.5<br />
12 Administrators 5 322 21.6 25.1 29.2 1.6<br />
13 Clerical workers 57 594 14.8 24.2 28.6 1.9<br />
14 Sales agents 4 105 12.8 23.2 28.2 2.0<br />
15 Shop workers 29 468 9.9 22.3 27.5 2.2<br />
16 Farmers 9 153 6.5 23.3 30.5 3.0<br />
17 Gardeners 4 211 7.5 23.0 30.2 2.9<br />
18 Fishermen 218 14.2 21.3 28.8 2.7<br />
19 Forestry workers 138 8.7 22.0 28.0 2.5<br />
20 Miners <strong>and</strong> quarry workers 32 15.6 21.0 26.3 2.3<br />
21 Seamen 57 28.1 24.0 29.3 1.8<br />
22 Transport workers 362 24.0 24.1 28.5 1.7<br />
23 Drivers 1 092 9.2 21.9 28.1 2.5<br />
24 Postal workers 8 667 11.5 23.4 28.6 2.1<br />
25 Textile workers 5 083 17.2 22.6 27.8 2.1<br />
26 Shoe <strong>and</strong> leather workers 349 18.3 22.3 27.3 2.0<br />
27 Smelting workers 232 9.1 21.4 27.1 2.5<br />
28 Mechanics 1 020 14.3 21.5 26.7 2.2<br />
29 Plumbers 14 14.3 24.0 29.7 2.1<br />
30 Welders 221 12.2 21.5 26.5 2.2<br />
31 Electrical workers 1 276 18.1 22.4 27.2 1.9<br />
32 Wood workers 581 12.0 21.8 27.6 2.4<br />
33 Painters 90 6.7 21.8 27.5 2.5<br />
34 ‘‘Other construction workers’’ 56 12.5 22.4 27.8 2.5<br />
36 Printers 1 026 17.1 23.1 27.7 1.8<br />
37 Chemical process workers 710 12.7 21.5 26.5 2.1<br />
38 Food workers 3 055 11.8 21.7 27.9 2.5<br />
39 Beverage workers 56 16.1 21.8 25.8 2.0<br />
40 Tobacco workers 67 23.9 22.3 27.0 1.7<br />
41 Glass makers etc. 1 495 13.4 22.0 27.2 2.1<br />
42 Packers 3 101 13.4 21.8 27.2 2.2<br />
43 Engine operators 181 14.9 21.2 26.3 2.1<br />
44 Public safety workers 475 14.5 23.3 28.6 2.1<br />
45 Cooks <strong>and</strong> stewards 2 888 19.0 23.2 28.7 2.1<br />
46 Domestic assistants 9 526 9.4 22.5 28.5 2.4<br />
47 Waiters 5 737 14.3 22.1 27.7 2.2<br />
48 Building caretakers 25 537 6.2 21.9 28.3 2.6<br />
50 Hairdressers 2 179 12.8 23.7 28.2 1.8<br />
51 Launderers 1 086 12.9 22.0 27.4 2.3<br />
52 Military personnel 28 3.6 24.5 30.2 2.3<br />
53 ‘‘Other workers’’ 16 622 11.2 23.0 28.9 2.4<br />
54 Economically inactive 110 947 8.0 23.7 30.0 2.5<br />
1 54 All categories 391 685 11.2 23.7 29.3 2.3
Acta Oncol Downloaded from informahealthcare.com by 212.35.100.66 on 04/06/11<br />
For personal use only.<br />
Farmers<br />
Farmers<br />
Farmers<br />
Farmers<br />
Farmers<br />
Physicians<br />
Farmers<br />
Physicians<br />
Nurses<br />
Engine operators<br />
Military personnel<br />
Fishermen<br />
Dentists<br />
Forestry workers<br />
Physicians<br />
Farmers<br />
Waiters<br />
Farmers<br />
Forestry workers<br />
Farmers<br />
Chimney sweeps<br />
Nurses<br />
Glass makers<br />
Forestry workers<br />
Domestic assistants<br />
Domestic assistants<br />
Nurses<br />
Fishermen<br />
Chimney sweeps<br />
Laboratory assistants<br />
Nurses<br />
Farmers<br />
Physicians<br />
Dentists<br />
Administrators<br />
Dentists<br />
Chemical process workers<br />
Technical workers<br />
Forestry workers<br />
Launderers<br />
Forestry workers<br />
Journalists<br />
Forestry workers<br />
Gardeners<br />
Engine operators<br />
Beverage workers<br />
Beverage workers<br />
Wood workers<br />
Dentists<br />
Transport workers<br />
Technical workers<br />
Hairdressers<br />
Physicians<br />
Beverage workers<br />
Mechanics<br />
Fishermen<br />
Beverage workers<br />
Beverage workers<br />
Painters<br />
Forestry workers<br />
Welders<br />
Men<br />
Mesothelioma<br />
Pharynx<br />
Oral cavity<br />
Primary liver<br />
Tongue<br />
Lip<br />
Larynx<br />
Oesophagus<br />
Lung<br />
Breast<br />
Nose<br />
Melanoma<br />
Stomach<br />
Non−melanoma skin<br />
Other/unknown site<br />
Bladder<br />
Hodgkin<br />
Gall bladder<br />
Testis<br />
Pancreas<br />
Non−Hodgkin<br />
Kidney<br />
Thyroid<br />
Colon<br />
Prostate<br />
All sites<br />
Rectum<br />
Soft tissue<br />
Brain<br />
Myeloma<br />
0.3 0.5 0.7 1<br />
SIR<br />
1.5 2.5 4 6<br />
Women<br />
Larynx<br />
Lung<br />
Stomach<br />
Cervix uteri<br />
Nose<br />
Gall bladder<br />
Oral cavity<br />
Pharynx<br />
Pancreas<br />
Tongue<br />
Bladder<br />
Primary liver<br />
Melanoma<br />
Mesothelioma<br />
Myeloma<br />
Non−melanoma skin<br />
Rectum<br />
Hodgkin<br />
Kidney<br />
Oesophagus<br />
Soft tissue<br />
Thyroid<br />
Other/unknown site<br />
Non−Hodgkin<br />
Lip<br />
Breast<br />
Brain<br />
Corpus uteri<br />
Ovary<br />
All sites<br />
Colon<br />
0.3 0.5 0.7 1<br />
SIR<br />
1.5 2.5 4 6<br />
<strong>Occupation</strong> <strong>and</strong> <strong>cancer</strong> in Nordic countries 781<br />
Plumbers<br />
Waiters<br />
Waiters<br />
Waiters<br />
Waiters<br />
Fishermen<br />
Waiters<br />
Waiters<br />
Waiters<br />
Journalists<br />
Wood workers<br />
Dentists<br />
Fishermen<br />
Nurses<br />
Tobacco workers<br />
Waiters<br />
Bricklayers<br />
Launderers<br />
Physicians<br />
Beverage workers<br />
Tobacco workers<br />
Tobacco workers<br />
Beverage workers<br />
Chimney sweeps<br />
Dentists<br />
Waiters<br />
Waiters<br />
Building caretakers<br />
Physicians<br />
Launderers<br />
Mechanics<br />
Engine operators<br />
Fishermen<br />
Beverage workers<br />
Wood workers<br />
Tobacco workers<br />
Waiters<br />
Artistic workers<br />
Welders<br />
Artistic workers<br />
Tobacco workers<br />
Smelting workers<br />
Dentists<br />
Wood workers<br />
Journalists<br />
Physicians<br />
Tobacco workers<br />
Other health workers<br />
Other construction workers<br />
Drivers<br />
Public safety workers<br />
Welders<br />
Other construction workers<br />
Public safety workers<br />
Glass makers<br />
Dentists<br />
Welders<br />
Dentists<br />
Welders<br />
Tobacco workers<br />
Printers<br />
Figure 51. Risk of <strong>cancer</strong> in occupations with the highest <strong>and</strong> lowest st<strong>and</strong>ardised incidence ratios (SIR), by gender. Only occupations<br />
with]1 000 workers, ]5 observed cases <strong>and</strong> ]5 expected cases have been included.
Acta Oncol Downloaded from informahealthcare.com by 212.35.100.66 on 04/06/11<br />
For personal use only.<br />
782 E. Pukkala et al.<br />
Men<br />
Lip<br />
Tongue<br />
Oral cavity<br />
Pharynx<br />
Oesophagus<br />
Stomach<br />
Colon<br />
Rectum<br />
Primary liver<br />
Gallbladder<br />
Pancreas<br />
Larynx<br />
Lung<br />
Prostate<br />
Testis<br />
Kidney<br />
Bladder<br />
Melanoma<br />
Brain<br />
Thyroid<br />
All sites<br />
0.1 0.3 0.7 1 1.5 3 6<br />
SIR<br />
Farmers Waiters<br />
well as for multiple myeloma (Figure 51). Beverage<br />
workers, tobacco workers or waiters came out with<br />
the highest risk on <strong>cancer</strong> of the pancreas, non-<br />
Hodgkin lymphoma, kidney, thyroid <strong>and</strong> rectum.<br />
Tobacco smoking could be a risk factor behind the<br />
observed increase in <strong>cancer</strong>s of the pancreas <strong>and</strong><br />
kidney. Hence, even the high risks for less discriminating<br />
<strong>cancer</strong>s aggregated in certain occupations.<br />
The fact that a given occupational category can<br />
be at the highest risk for one <strong>cancer</strong> site <strong>and</strong> at the<br />
lowest risk for another reflects the differences in<br />
aetiology across <strong>cancer</strong> sites. Male dentists, for<br />
instance, had the highest risk for skin melanoma<br />
<strong>and</strong> the lowest risk for stomach <strong>cancer</strong>. Exactly<br />
the opposite pattern was found for fishermen, who<br />
had the lowest risk for melanoma <strong>and</strong> the highest<br />
risk for stomach <strong>cancer</strong>. Such differences were<br />
balanced out when all <strong>cancer</strong> sites were considered<br />
together, resulting in similar overall <strong>cancer</strong> incidence<br />
for dentists (SIR 0.97, 95% CI 0.94 1.01)<br />
<strong>and</strong> fishermen (1.02, 1.00 1.04).<br />
For women, less difference in the risk variations<br />
across <strong>cancer</strong> sites was found (Figure 50). A more<br />
than fivefold risk variation was found only for<br />
<strong>cancer</strong>s of the larynx <strong>and</strong> lung. A risk variation of<br />
less than two was found for <strong>cancer</strong> of the brain,<br />
corpus uteri, ovary <strong>and</strong> colon. Diverging aetiologies<br />
of <strong>cancer</strong>s were also shown in the data for women.<br />
Dentists, for instance, had the highest risk for <strong>cancer</strong><br />
Women<br />
Lip<br />
Tongue<br />
Oral cavity<br />
Pharynx<br />
Oesophagus<br />
Stomach<br />
Colon<br />
Rectum<br />
Primary liver<br />
Gallbladder<br />
Pancreas<br />
Larynx<br />
Lung<br />
Breast<br />
Cervix uteri<br />
Kidney<br />
Bladder<br />
Melanoma<br />
Brain<br />
Thyroid<br />
All sites<br />
0.1 0.3 0.7 1 1.5 3 6<br />
SIR<br />
Farmers Waiters<br />
Figure 52. St<strong>and</strong>ardised incidence ratios (SIR) <strong>and</strong> 95% confidence interval for selected <strong>cancer</strong>s among farmers <strong>and</strong> waiters, by gender.<br />
of the corpus uteri with an SIR of 1.24 (1.00 1.51)<br />
versus an SIR of 0.68 (0.47 0.96) for beverage<br />
workers. The pattern was exactly opposite for<br />
cervical <strong>cancer</strong>, with beverage workers having an<br />
SIR of 2.01 (1.51 2.61) <strong>and</strong> dentists having an SIR<br />
of 0.48 (0.30 0.74).<br />
There was a much more varied pattern for women<br />
than for men in the occupational categories coming<br />
up as either high or low risk groups. While either<br />
beverage workers, tobacco workers or waiters came<br />
out as the high risk group for 15 of 29 <strong>cancer</strong> sites for<br />
men, these occupational categories came out as the<br />
high risk group for only six of 30 <strong>cancer</strong> sites for<br />
women. This might be related to the lower occupational<br />
stability for women in these categories.<br />
Economic inactive persons<br />
The SIRs for the category of economic inactive<br />
persons were given for every <strong>cancer</strong> site but not<br />
commented upon in the Result chapter because<br />
this category was not considered as a real occupational<br />
category. The definition also varies over the<br />
Nordic countries. While the Danish, Icel<strong>and</strong>ic,<br />
Norwegian <strong>and</strong> Swedish definitions include jobs<br />
held for a relatively short period <strong>and</strong> part-time<br />
jobs with few working hours, the Finnish definition<br />
sets a threshold for inclusion as occupationally active<br />
of approximately 20 working hours a week at the
Acta Oncol Downloaded from informahealthcare.com by 212.35.100.66 on 04/06/11<br />
For personal use only.<br />
time of the census. These differences will probably<br />
not have affected the classification of men, but parttime<br />
working women could have been classified<br />
differently across the countries. There are differences<br />
across the countries in the way a distinction<br />
was made between economically inactive housewives<br />
<strong>and</strong> economically active housewives at the family<br />
farm or in the family shop.<br />
The proportion of economically inactive men of<br />
the total 30 64-year-old male population at the time<br />
of the first available population census of the current<br />
study was 7.3%, including a great proportion of men<br />
unable to work, for instance due to a disease. The<br />
large category of economically inactive women<br />
(42.4% of the total 30 64-year-old female population)<br />
included housewives <strong>and</strong> farmers’ spouses not<br />
taking part in farm work <strong>and</strong> was thus less selected in<br />
terms of health status than that of males.<br />
The total <strong>cancer</strong> incidence among economically<br />
inactive men was 6% (95% CI 5% 7%) larger<br />
than the incidence among economically active<br />
men, whereas there was a slightly decreased <strong>cancer</strong><br />
incidence among the economically inactive women<br />
(SIR 0.99, 95% CI 0.98 0.99). (http://astra.<strong>cancer</strong>.<br />
fi/NOCCA/Incidence/economically-inactive). The<br />
highest site-specific SIRs among economically<br />
inactive men were obtained for alcohol-related<br />
<strong>cancer</strong>s of the pharynx other than nasopharynx<br />
(2.08, 1.94 2.23), oral cavity (1.73, 1.60 1.87),<br />
tongue (1.59, 1.44 1.75), liver (1.54, 1.46 1.62),<br />
oesophagus (1.50, 1.43 1.58), <strong>and</strong> larynx (1.42,<br />
1.35 1.50). The SIR for lung <strong>cancer</strong> was 1.33<br />
(1.31 1.35), indicating that economically active<br />
men also smoked more than men on average.<br />
Besides the common <strong>cancer</strong> sites illustrated in<br />
Figure 53, penile <strong>cancer</strong> also showed a significant<br />
excess (SIR 1.40, 1.25 1.56) quite consistently<br />
across the Nordic countries (Table 49). There is<br />
no obvious explanation for this finding. The SIRs<br />
were lowest for skin melanoma (0.70, 0.67 0.74)<br />
<strong>and</strong> prostate <strong>cancer</strong> (0.80, 0.79 0.82), suggesting<br />
that economically inactive men do not get<br />
sunburns <strong>and</strong> do not go to PSA tests as frequently<br />
as other men.<br />
The elevated SIR of 1.34 (1.24 1.45) for <strong>cancer</strong> of<br />
the gallbladder among economically inactive men<br />
might be related to obesity, which is likely to be more<br />
common among economically inactive men than<br />
among economically active ones. Cancer of the<br />
gallbladder was the only <strong>cancer</strong> to show a significant<br />
more than 5% excess risk among economically<br />
inactive women, but the SIR was not higher than<br />
1.07 (1.05 1.09). The SIR was lowest in <strong>cancer</strong><br />
of the Fallopian tube (0.88, 0.82 0.94).<br />
Lip<br />
Tongue<br />
Oral cavity<br />
Pharynx<br />
Oesophagus<br />
Stomach<br />
Colon<br />
Rectum<br />
Primary liver<br />
Gallbladder<br />
Pancreas<br />
Larynx<br />
Lung<br />
Breast<br />
Cervix uteri<br />
Prostate<br />
Testis<br />
Kidney<br />
Bladder<br />
Melanoma<br />
Brain<br />
Thyroid<br />
All sites<br />
<strong>Occupation</strong> <strong>and</strong> <strong>cancer</strong> in Nordic countries 783<br />
0.5 0.7 1<br />
SIR<br />
1.5 2<br />
Men Women<br />
Figure 53. St<strong>and</strong>ardised incidence ratios (SIR) <strong>and</strong> 95% confidence<br />
intervals for selected <strong>cancer</strong>s among economically inactive<br />
men <strong>and</strong> women.<br />
Conclusions<br />
The surveillance system described in this publication<br />
systematically produced st<strong>and</strong>ardised incidence ratios<br />
(SIRs) among men <strong>and</strong> women in all five Nordic<br />
countries for all main <strong>cancer</strong> sites by occupation. It<br />
was based on the computerised record linkage of the<br />
nationwide population-based <strong>cancer</strong> Registries <strong>and</strong><br />
population census files including occupational data<br />
from a time-point 0 45 years prior to the <strong>cancer</strong><br />
diagnosis. Because of the high coverage, precision<br />
<strong>and</strong> validity of the linked files, the <strong>cancer</strong> risk<br />
estimates can be considered very reliable, <strong>and</strong> the<br />
large numbers of cases downplay the role of chance<br />
variation even in the case of relatively rare <strong>cancer</strong><br />
forms. For the many small occupational categories<br />
<strong>and</strong> <strong>cancer</strong> sites, the possibility to combine data<br />
from several countries made it possible to get<br />
meaningful risk evaluations, <strong>and</strong> the possibility<br />
for five independent country-specific observations<br />
to have a tool to estimate consistency of the findings.<br />
The occupation at one point in time may not<br />
always correspond to the lifelong occupational<br />
history of a person. However, comparison with
Acta Oncol Downloaded from informahealthcare.com by 212.35.100.66 on 04/06/11<br />
For personal use only.<br />
784 E. Pukkala et al.<br />
results of special occupational <strong>cancer</strong> studies indicates<br />
that the risk diluting effect of misclassification<br />
is small. The study was able to find well-known,<br />
confirmed occupational risks such as a high lip<br />
<strong>cancer</strong> incidence in farmers <strong>and</strong> fishermen. Comparisons<br />
made earlier have indicated that even the<br />
numerical relative risk estimates derived from register-based<br />
analyses like the present one have repeatedly<br />
been seen to be similar to those obtained in<br />
studies investigating more specific hypotheses<br />
[6,173]. Because the present survey was based on<br />
incident <strong>cancer</strong> cases <strong>and</strong> exact person-years, there<br />
was no bias caused by occupational variation in<br />
<strong>cancer</strong> survival <strong>and</strong> in mortality from competing<br />
causes of death that may be a serious problem in<br />
analyses based on <strong>cancer</strong> deaths <strong>and</strong> cross-sectional<br />
proportionate analyses.<br />
Known or suspected associations, such as a high<br />
risk of nasal adenocarcinoma among woodworkers,<br />
mesothelioma among asbestos exposed workers, <strong>and</strong><br />
lung <strong>cancer</strong> among asbestos <strong>and</strong> silica dust exposed<br />
workers, can be picked up from the numerous site<br />
<strong>and</strong> occupation-specific risk ratios. Sedentary workers<br />
tend to have an increased risk of breast <strong>cancer</strong>,<br />
while the association with colon <strong>cancer</strong> was not so<br />
evident. Skin melanoma was most common among<br />
indoor workers who are not used to sun radiation<br />
<strong>and</strong> thus easily burn due to intensive sunbathing<br />
during the holidays.<br />
Thous<strong>and</strong>s of new significant associations came<br />
up, <strong>and</strong> these should be confirmed in other studies<br />
before they can be believed to be true causal<br />
associations. For instance in ovarian <strong>cancer</strong>, especially<br />
borderline tumours, there was a cluster of<br />
chemical-exposed occupations with a high risk. Even<br />
in such a rare disease as male breast <strong>cancer</strong> there<br />
were enough cases (2 336) to reveal a hint of an<br />
increase in risk in occupations characterised by shift<br />
work. The rare occupational category of chimney<br />
sweeps, who are exposed to known carcinogens,<br />
showed a significant excess risk of <strong>cancer</strong>s of the<br />
pharynx, oesophagus, lung, colon, pancreas <strong>and</strong><br />
bladder.<br />
<strong>Occupation</strong>-related social factors seem to be more<br />
important determinants of some <strong>cancer</strong> risks than<br />
the real occupational ones. There were high risks of<br />
alcohol-related <strong>cancer</strong>s among workers having easy<br />
access to alcoholic beverages in their work. <strong>Occupation</strong>s<br />
can also create a protective environment<br />
against <strong>cancer</strong>: it is not suitable for a primary school<br />
teacher, dentist or priest to smoke at work (or<br />
elsewhere), which is reflected in a low incidence of<br />
smoking-related <strong>cancer</strong>s.<br />
Cancer is socially discriminating, more so for<br />
men than for women. The highly discriminating<br />
<strong>cancer</strong>s were found to be those aetiologically related<br />
to asbestos, sunlight, <strong>and</strong> tobacco <strong>and</strong>/or alcohol<br />
exposures. <strong>Occupation</strong>al categories of high risk for<br />
one <strong>cancer</strong> may be of low risk for another <strong>cancer</strong>,<br />
<strong>and</strong> this resulted in the present study in a 1.9-fold<br />
variation in the overall <strong>cancer</strong> risk for men <strong>and</strong> in a<br />
1.5-fold variation for women. It was estimated from<br />
a similar results pattern in Finl<strong>and</strong> from 1971 1985<br />
that some 5% of all <strong>cancer</strong>s both in males <strong>and</strong> in<br />
females would be related to work, <strong>and</strong> about 35%<br />
of <strong>cancer</strong> incidence in males <strong>and</strong> 16% in females<br />
would be attributable to socio-economic position<br />
[6]. The current risk estimates indicate that the<br />
population attributable fractions for the Nordic<br />
region would still be of similar magnitude.<br />
Acknowledgements<br />
This study was financially supported by the Nordic<br />
Cancer <strong>Union</strong> <strong>and</strong> Scientific Council in Sweden.<br />
Data for the study were prepared in collaboration<br />
with the national statistical offices, Statistics<br />
Denmark; Statistiska Centralbyra˚n, Sweden; Statistics<br />
Norway; Statistics Icel<strong>and</strong>, <strong>and</strong> Statistics<br />
Finl<strong>and</strong>. We are indebted to Aage Andersen, Lotti<br />
Barlow, Tor Haldorsen, <strong>and</strong> Lene Bjørk Clausen for<br />
assistance in early phases of this study. We thank<br />
Ms. Luanne Siliämaa for language corrections,<br />
<strong>and</strong> Margrethe Meo for help with the references<br />
<strong>and</strong> preparation of the manuscript.<br />
Declaration of interest: The authors report no<br />
conflicts of interest. The authors alone are responsible<br />
for the content <strong>and</strong> writing of the paper.<br />
References<br />
[1] Andersen A, Barlow L, Engel<strong>and</strong> A, Kjaerheim K, Lynge E,<br />
Pukkala E. Work-related <strong>cancer</strong> in the Nordic countries.<br />
Sc<strong>and</strong> J Work Environ Health 1999;/25(Suppl 2):/1 116.<br />
[2] Danmarks Statistik [Statistics Denmark]. Folke og boligtællingen<br />
1. januar 1981. L<strong>and</strong>stabelværket [Population<strong>and</strong><br />
housing census 1st January 1981. Tables for all<br />
Danmark]. Copenhagen (Denmark): Danmarks Statistik;<br />
1984. Danish.<br />
[3] National Board of Health <strong>and</strong> Welfare [Socialstyrelsen].<br />
The Swedish Cancer-Environment Registry 1961 1973.<br />
Stockholm (Sweden): National Board of Health <strong>and</strong> Welfare;<br />
1980.<br />
[4] Eklund G, Barlow L, Vaittinen P. Cancer-Milö-Registeret<br />
1960 70 [Cancer-environment registry 1960 70]. Epcreport<br />
No. 4. Stockholm (Sweden): Socialstyrelsen; 1994.<br />
Swedish.<br />
[5] Lynge E, Thygesen L. <strong>Occupation</strong>al <strong>cancer</strong> in Denmark.<br />
Cancer incidence in the 1970 census population. Sc<strong>and</strong> J<br />
Work Environ Health 1990;/16(Suppl 2):/3 35.<br />
[6] Pukkala E. Cancer risk by social class <strong>and</strong> occupation. A<br />
survey of 109,000 <strong>cancer</strong> cases among Finns of working<br />
age. In: Wahrendorf J, editor. Contributions to epidemiology<br />
<strong>and</strong> biostatistics. Vol 7. Basel (Switzerl<strong>and</strong>): Karger;<br />
1995.
Acta Oncol Downloaded from informahealthcare.com by 212.35.100.66 on 04/06/11<br />
For personal use only.<br />
[7] Andersen A, Bjelke E, Langmark F. Cancer in waiters. Br J<br />
Cancer 1989;/60:/112 5.<br />
[8] Tynes T, Andersen A, Langmark F. Incidence of <strong>cancer</strong> in<br />
Norwegian workers potentially exposed to electromagnetic<br />
fields. Am J Epidemiol 1992;/136:/81 8.<br />
[9] Nordic Statistical Secretariat [Nordisk Statistisk Sekretariat].<br />
<strong>Occupation</strong>al mortality in the Nordic countries 1971<br />
80. Statistical Reports of the Nordic Countries. Copenhagen<br />
(Denmark): Nordic Statistical Secretariat; 1988.<br />
[10] World Meteorological Organization (WMO). Climatological<br />
normals for the period 1961 1990. WMO/OMM 847.<br />
Geneva (Switzerl<strong>and</strong>): Secretariat for the World Meteorological<br />
Organization; 1996.<br />
[11] Moan J, Dahlback A, Henriksen T, Magnus K. Biological<br />
amplification factor for sunlight-induced nonmelanoma<br />
skin <strong>cancer</strong> at high latitudes. Cancer Res 1989;/49:/5207 12.<br />
[12] Nordic Council; Nordic Council of Ministers [Nordiska<br />
ra˚det; Nordiska ministerra˚det]. Nordic Statistical Yearbook<br />
2005. Vol 43. Copenhagen (Denmark): Nordic Council of<br />
ministerra˚det; 2005.<br />
[13] Nordic Council; Nordic Council of Ministers [Nordiska<br />
ra˚det; Nordiska ministerra˚det]. Nordic Statistical Yearbook<br />
2007. Agerskov U, editor. Vol 45. Copenhagen (Denmark):<br />
Nordic Council of ministerra˚det; 2007.<br />
[14] Organisation for Economic Co-operation <strong>and</strong> Development<br />
(OECD). Health at a glance 2007- OECD indicators.<br />
Paris (France): OECD; 2007.<br />
[15] Pedersen PJ, Røed M, Wadensjö E. The common Nordic<br />
labor market at 50. TemaNord 2008: 506. Copenhagen<br />
(Denmark): Noridic Council of Ministers; 2008.<br />
[16] Valkonen T. Adult mortality <strong>and</strong> level of education: a<br />
comparison between six countries. In: Fox J, editor. Health<br />
inequalities in <strong>European</strong> countries. Aldershot (UK):<br />
Gower; 1989. p. 142 60.<br />
[17] Jonsson G, Magnusson MS, editors. Hagskinna: Icel<strong>and</strong>ic<br />
historical statistics. Reykjavik (Icel<strong>and</strong>): Statistics Icel<strong>and</strong>;<br />
1997.<br />
[18] Schmidt EK. Research <strong>and</strong> higher education in the Nordic<br />
countries. A comparison of the Nordic systems. Working<br />
Paper 3. Aarhus (Denmark): Danish Center for Studies in<br />
Research <strong>and</strong> Research Policy, University of Aarhus; 2004.<br />
[19] Terlinden Y, editor. Tro och ma˚ngfald. Religionsmöten och<br />
religionsteologi i Norden [Faith <strong>and</strong> diversity. Religious<br />
meetings <strong>and</strong> religious theology in the Nordic countries].<br />
TemaNord 2005: 582. Copenhagen (Denmark): Nordiska<br />
ministerra˚det; 2005. Swedish.<br />
[20] US Department of Energy’s Carbon Dioxide Information<br />
Analysis Centre (CDIAC) [Homepage on the internet].<br />
Oak Ridge (US): Oak Ridge National Laboratory [cited<br />
2007 Nov 4]. Available from: http://cdiac.ornl.gov/<br />
[21] Organisation for Economic Cooperation <strong>and</strong> Development<br />
(OECD). National accounts: Main aggregates. [1: 1960<br />
95]. Paris (France): OECD; 1997.<br />
[22] Community survey on ITC usage in households <strong>and</strong> by<br />
individuals [Database on the Internet]. Brussels (Belgium):<br />
Statistical Office of the <strong>European</strong> Communities, Eurostat<br />
[cited 2007 Nov 5]. Available from: http://epp.eurostat.<br />
ec.europa.eu; http://epp.eurostat.ec.europa.eu/cache/ITY_<br />
OFFPUB/KS-NP-05-018/EN/KS-NP-05-018-EN.PDF<br />
[23] Trygg K. Food patterns in the Nordic countries. Ann Nutr<br />
Metab 1991;/35(Suppl 1):/3 11.<br />
[24] Nes M, Müller H, Pedersen PJ. Ernæringslære [Nutritional<br />
education]. Oslo (Norway): Gyldendal Norsk Forlag; 2006.<br />
Norwegian.<br />
[25] Becker W. Comparison of per capita statistics for foods in<br />
the Nordic countries. Report to the Nordic Working Group<br />
<strong>Occupation</strong> <strong>and</strong> <strong>cancer</strong> in Nordic countries 785<br />
for Diet <strong>and</strong> Nutrition. Uppsala (Sweden): Nordic Council<br />
of Ministers; 1992. Swedish.<br />
[26] Statens institutt for alkohol- og narkotika forskning (SIFA);<br />
Rusmiddeldirektoratet [National <strong>Institute</strong> for Alcohol <strong>and</strong><br />
Drug Research]. Rusmidler i Norge. Alcohol i de nordiske<br />
l<strong>and</strong> [Intoxicating substances. Alcohol in the Nordic<br />
countries]. Grytten L, editor. Oslo (Norway): SIFA &<br />
Rusmiddeldirektoratet; 1994. Norwegian.<br />
[27] Dreyer L, Winther JF, Andersen A, Pukkala E. Avoidable<br />
<strong>cancer</strong>s in the Nordic countries. Alcohol consumption.<br />
APMIS 1997;/76(Suppl):/48 67.<br />
[28] Mørck HI, Linde J, Agner E, Hein HO, Gyntelberg F,<br />
Nielsen PE. Tobaks-forbrug og rygevaner i Norden, 1920<br />
1980 [Tobacco consumption in the Nordic countries,<br />
1920 1980]. Nord Med 1982;/97:/134 46. Danish.<br />
[29] Nielsen PE, Zacho J, Olsen JA, Olsen CA. Aendringer i<br />
danskernes rygevaner 1970 1987 [Changes in the smoking<br />
habits of Danes in the period 1970 1987]. Ugeskr Laeger<br />
1988;/150(38):/2229 33. Danish.<br />
[30] Statens Tobakkskadera˚d [National Council on Smoking<br />
<strong>and</strong> Health]. Tobakksbruk og holdninger i Norge- utviklingen<br />
1973 95 [Tobacco consumption in Norway 1973<br />
95]. Oslo (Norway): Statens Tobakkskadera˚d; 1996.<br />
Norwegian.<br />
[31] Socialstyrelsen [National Board of Health <strong>and</strong> Welfare].<br />
Tobaksvanor i Sverige [Tobacco consumption in Sweden].<br />
Socialstyrelsen redovisar. Vol 9. Stockholm (Sweden):<br />
Socialstyrelsen; 1986. Swedish.<br />
[32] Rimpelä M. Aikuisväestön tupakointitavat Suomessa 1950<br />
1970-luvuilla [Adult use of tobacco in Finl<strong>and</strong> in the 1950s<br />
to 1970s]. Publications of Public Health M-series. Vol 40/<br />
78. Tampere (Finl<strong>and</strong>): Kansanterveystieteen laitos, Tampereen<br />
Yliopisto; 1978. Finnish.<br />
[33] Dreyer L, Winther JF, Pukkala E, Andersen A. Avoidable<br />
<strong>cancer</strong>s in the Nordic countries. Tobacco smoking. APMIS<br />
1997;/76(Suppl):/9 47.<br />
[34] <strong>European</strong> Commission. Health in Europe. Results from<br />
1997 2000 surveys. Luxemburg: Office for Official Publications<br />
of the <strong>European</strong> Communities; 2003. p. 87 90.<br />
Available from: http://ec.europa.eu/health/ph_information/<br />
reporting/statistical_en.print.htm<br />
[35] Statistiska Centralbyra˚n [Statistics Sweden]. Alcohol- och<br />
tobaksbruk. [Alcohol <strong>and</strong> tobacco use]. Report No. 114.<br />
Stockholm (Sweden): Statistiska Centralbyra˚n; 2007 [cited<br />
2007 Nov 11]. Available from: http://www.scb.se/statistik/<br />
_publikationer/LE0101_2004I05_BR_LE114SA0701.pdf<br />
[36] Statistics Norway [Statistisk sentralbyra˚]. Health Interview<br />
Survey 2005. Little change in total tobacco use. Oslo<br />
(Norway): Statistics Norway; 2006 [cited 2007 Nov 10].<br />
Available from: http://www.ssb.no/english/subjects/03/01/<br />
helseforhold_en/<br />
[37] Organisation for Economic Co-operation <strong>and</strong> Development<br />
(OECD). Society at a glance: OECD social indicators.<br />
Paris: OECD; 2006.<br />
[38] Nordic Statistical Secretariat [Nordisk Statistisk Sekretariat].<br />
Yearbook of Nordic Statistics 1973. Vol 12. Copenhagen<br />
(Denmark): Nordic Statistical Secretariat; 1974.<br />
[39] Nordic Statistical Secretariat [Nordisk Statistisk Sekretariat].<br />
Yearbook of Nordic Statistics 1981. Vol 20. Stockholm<br />
(Sweden): Nordic Statistical Secretariat; 1982.<br />
[40] .A˚ mark K. Women’s labour force participation in<br />
the Nordic countries during the twentieth century. In:<br />
Christiansen NF, Petersen K, Edling N, Haave P, editors.<br />
The Nordic model of welfare. A historical perspective.<br />
Copenhagen (Denmark): Museum Tusculanum Press,<br />
University of Copenhagen; 2006.
Acta Oncol Downloaded from informahealthcare.com by 212.35.100.66 on 04/06/11<br />
For personal use only.<br />
786 E. Pukkala et al.<br />
[41] Vassenden K. Folke- og boligtellingene 1960, 1970<br />
og 1980. Dokumentasjon av de sammenlignbare filene<br />
[Population <strong>and</strong> housing censuses 1960, 1970 & 1980.<br />
Documentation of the comparable files]. Vol 2.<br />
Oslo-Kongsvinger (Norway): Statistisk Sentralbyra˚; 1987.<br />
Norwegian.<br />
[42] Arbeidsdirektoratet [Department of Labour]. Nordisk<br />
yrkesklassifikasjon [Nordic classification of occupations].<br />
Oslo (Norway): Arbeidsdirektoratet; 1958. Norwegian.<br />
[43] International Labour Office (ILO). International st<strong>and</strong>ard<br />
classification of occupations, 1958. Geneva (Switzerl<strong>and</strong>):<br />
ILO; 1962.<br />
[44] International Labour Office (ILO). International st<strong>and</strong>ard<br />
classification of occupations [Revised]. Geneva (Switzerl<strong>and</strong>):<br />
ILO; 1968.<br />
[45] World Health Organization (WHO). International classification<br />
of diseases. 7th revision. Geneva (Switzerl<strong>and</strong>):<br />
WHO; 1957.<br />
[46] World Health Organization (WHO). ICD-O: International<br />
classification on diseases for oncology: Version 1. Geneva<br />
(Switzerl<strong>and</strong>): WHO; 1976.<br />
[47] American Cancer Society. Manual of tumor nomenclature<br />
<strong>and</strong> coding MOTNAC. Atlanta (US): American Cancer<br />
Society; 1951.<br />
[48] World Health Organization (WHO). Statistical codes for<br />
human tumours. [Document WHO/HS/CANC 24.1 <strong>and</strong><br />
24.2]. Geneva (Switzerl<strong>and</strong>): WHO; 1956.<br />
[49] NORDCAN: Cancer incidence <strong>and</strong> mortality in the Nordic<br />
countries, Version 3.0. [Database on the internet]. Association<br />
of the Nordic Cancer Registries; 2007. Available from:<br />
http://www.ancr.nu/default_old.asp<br />
[50] Mayne ST, Morse DE, Winn DM. Cancers of the oral<br />
cavity <strong>and</strong> pharynx. In: Schottenfeld D, Fraumeni JF Jr,<br />
editors. Cancer epidemiology <strong>and</strong> prevention. New York<br />
(US): Oxford University Press; 2006. p. 674 96.<br />
[51] Clemmesen J. Statistical studies in the aetiology of malignant<br />
neoplasms. Vol 1. Review <strong>and</strong> results. Acta Pathol<br />
Microbiol Sc<strong>and</strong> Suppl 1965;/174(Suppl):/1 543.<br />
[52] Spitzer WO, Hill GB, Chambers LW, Helliwell BE,<br />
Murphy HB. The occupation of fishing as a risk factor in<br />
<strong>cancer</strong> of the lip. N Engl J Med 1975;/293:/419 24.<br />
[53] Lindqvist C. Risk factors in lip <strong>cancer</strong>: A questionnaire<br />
survey. Am J Epidemiol 1979;/109:/521 30.<br />
[54] Mork J, Lie AK, Glattre E, Hallmans G, Jellum E, Koskela<br />
P, et al. Human papillomavirus infection as a risk factor for<br />
squamous-cell carcinoma of the head <strong>and</strong> neck. N Engl J<br />
Med 2001;/344:/1125 31.<br />
[55] Pukkala E, Soderholm AL, Lindqvist C. Cancers of the<br />
lip <strong>and</strong> oropharynx in different social <strong>and</strong> occupational<br />
groups in Finl<strong>and</strong>. Eur J Cancer (B. Oral Oncol) 1994;/30B:/<br />
209 15.<br />
[56] Yu MC, Yuan JM. Nasopharyngeal <strong>cancer</strong>. In: Schottenfeld<br />
D, Fraumeni JF Jr, editors. Cancer epidemiology <strong>and</strong><br />
prevention. New York (US): Oxford University Press;<br />
2006. p. 620 6.<br />
[57] Blot WJ, McLaughlin JK, Fraumeni JF, Jr. Esophageal<br />
<strong>cancer</strong>. In: Schottenfeld D, Fraumeni JF Jr, editors. Cancer<br />
epidemiology <strong>and</strong> prevention. New York (US): Oxford<br />
University Press; 2006. p. 697 706.<br />
[58] Gustavsson P, Evanoff B, Hogstedt C. Increased risk of<br />
esophageal <strong>cancer</strong> among workers exposed to combustion<br />
products. Arch Environ Health 1993;/48:/243 5.<br />
[59] Gustavsson P, Jakobsson R, Johansson H, Lewin F, Norell<br />
S, Rutkvist LE. <strong>Occupation</strong>al exposures <strong>and</strong> squamous cell<br />
carcinoma of the oral cavity, pharynx, larynx, <strong>and</strong> oesophagus:<br />
A case-control study in Sweden. Occup Environ<br />
Med 1998;/55:/393 400.<br />
[60] Weiderpass E, Pukkala E. Time trends in socioeconomic<br />
differences in incidence rates of <strong>cancer</strong>s of gastro-intestinal<br />
tract in Finl<strong>and</strong>. BMC Gastroenterol 2006;/6:/41.<br />
[61] Shibata A, Parsonnet J. Stomach <strong>cancer</strong>. In: Schottenfeld<br />
D, Fraumeni JF Jr, editors. Cancer epidemiology <strong>and</strong><br />
prevention. New York (US): Oxford University Press;<br />
2006. p. 707 20.<br />
[62] Gonzalez CA, Jakszyn P, Pera G, Agudo A, Bingham S,<br />
Palli D, et al. Meat intake <strong>and</strong> risk of stomach <strong>and</strong><br />
esophageal adenocarcinoma within the <strong>European</strong> Prospective<br />
Investigation Into Cancer <strong>and</strong> Nutrition (EPIC). J Natl<br />
Cancer Inst 2006;/98:/345 54.<br />
[63] Sjodahl K, Jansson C, Bergdahl IA, Adami J, Boffetta P,<br />
Lagergren J. Airborne exposures <strong>and</strong> risk of gastric <strong>cancer</strong>:<br />
A prospective cohort study. Int J Cancer 2007;/120:/2013 8.<br />
[64] Beebe-Dimmer JL, Schottenfeld D. Cancers of the small<br />
intestine. In: Schottenfeld D, Fraumeni JF Jr, editors.<br />
Cancer epidemiology <strong>and</strong> prevention. New York (US):<br />
Oxford University Press; 2006. p. 801 8.<br />
[65] Giovannucci E, Wu K. Cancers of the colon <strong>and</strong> rectum.<br />
In: Schottenfeld D, Fraumeni JF Jr, editors. Cancer<br />
epidemiology <strong>and</strong> prevention. New York (US): Oxford<br />
University Press; 2006. p. 809 29.<br />
[66] International Agency for Research on Cancer (IARC),<br />
World Health Organization (WHO). Weight control <strong>and</strong><br />
physical activity. Vainio H, Bianchini F, editors. IARC<br />
H<strong>and</strong>books of <strong>cancer</strong> prevention. Vol 6. Lyon (France):<br />
IARC Press; 2002.<br />
[67] Baan R, Straif K, Grosse Y, Secretan B, El Ghissassi F,<br />
Bouvard V, et al. Carcinogenicity of alcoholic beverages.<br />
Lancet Oncol 2007;/8:/292 3.<br />
[68] London WT, McGlynn KA. Liver <strong>cancer</strong>. In: Schottenfeld<br />
D, Fraumeni JF Jr, editors. Cancer epidemiology <strong>and</strong><br />
prevention. New York (US): Oxford University Press;<br />
2006. p. 763 86.<br />
[69] Hsing AW, Rashid A, Devesa SS, Fraumeni JF. Biliary tract<br />
<strong>cancer</strong>. In: Schottenfeld D, Fraumeni JF Jr, editors. Cancer<br />
epidemiology <strong>and</strong> prevention. New York (US): Oxford<br />
University Press; 2006. p. 787 800.<br />
[70] World Cancer Research Fund (WCRF); American <strong>Institute</strong><br />
for Cancer Research (AICR). Gallbladder. In: Food,<br />
nutrition, physical activity, <strong>and</strong> the prevention of <strong>cancer</strong>:<br />
A global perspective. Washington DC (US): AICR; 2007.<br />
p. 275 6.<br />
[71] International Agency for Research on Cancer (IARC).<br />
Tobacco smoke <strong>and</strong> involuntary smoking. IARC Monographs<br />
on the evaluation of carcinogenic risk to humans.<br />
Vol 83. Lyon (France): IARC Press; 2004.<br />
[72] Anderson KE, Mack TM, Silverman DT. Cancer of the<br />
pancreas. In: Schottenfeld D, Fraumeni JF Jr, editors.<br />
Cancer epidemiology <strong>and</strong> prevention. New York (US):<br />
Oxford University Press; 2006. p. 721 62.<br />
[73] Littman AJ, Vaughan TL. Cancers of the nasal cavity <strong>and</strong><br />
paranasal sinuses. In: Schottenfeld D, Fraumeni JF Jr,<br />
editors. Cancer epidemiology <strong>and</strong> prevention. New York<br />
(US): Oxford University Press; 2006. p. 603 19.<br />
[74] International Agency for Research on Cancer (IARC).<br />
Wood, leather <strong>and</strong> some associated industries. IARC<br />
Monographs on the evaluation of carcinogenic risks to<br />
humans. Vol 25. Lyon (France): IARC Press; 1981.<br />
[75] Hernberg S, Westerholm P, Schultz-Larsen K, Degerth R,<br />
Kuosma E, Englund A, et al. Nasal <strong>and</strong> sinonasal <strong>cancer</strong>.<br />
Connection with occupational exposures in Denmark,<br />
Finl<strong>and</strong> <strong>and</strong> Sweden. Sc<strong>and</strong> J Work Environ Health 1983;/<br />
9:/315 26.<br />
[76] International Agency for Research on Cancer (IARC).<br />
Wood dust <strong>and</strong> Formaldehyde. IARC Monographs on the
Acta Oncol Downloaded from informahealthcare.com by 212.35.100.66 on 04/06/11<br />
For personal use only.<br />
evaluation of carcinogenic risks to humans. Vol 62. Lyon<br />
(France): IARC Press; 1995.<br />
[77] Acheson ED, Cowdell RH, Hadfield E, Macbeth RG.<br />
Nasal <strong>cancer</strong> in woodworkers in the furniture industry. Br<br />
Med J 1968;/2(5605):/587 96.<br />
[78] Lynge E, Andersen A, Nilsson R, Barlow L, Pukkala E,<br />
Nordlinder R, et al. Risk of <strong>cancer</strong> <strong>and</strong> exposure to gasoline<br />
vapors. Am J Epidemiol 1997;145:449 58.<br />
[79] Report of the international committee on nickel carcinogenesis<br />
in man. Sc<strong>and</strong> J Work Environ Health 1990;16(1<br />
Spec No):1 82.<br />
[80] Andersen A, Berge SR, Engel<strong>and</strong> A, Norseth T. Exposure<br />
to nickel compounds <strong>and</strong> smoking in relation to incidence<br />
of lung <strong>and</strong> nasal <strong>cancer</strong> among nickel refinery workers.<br />
Occup Environ Med 1996;/53:/708 13.<br />
[81] Olshan AF. Cancer of the larynx. In: Schottenfeld D,<br />
Fraumeni JF Jr, editors. Cancer epidemiology <strong>and</strong> prevention.<br />
New York (US): Oxford University Press; 2006. p.<br />
627 37.<br />
[82] Dreyer L, Andersen A, Pukkala E. Avoidable <strong>cancer</strong>s in the<br />
Nordic countries. <strong>Occupation</strong>. APMIS 1997;/76(Suppl):/<br />
68 79.<br />
[83] Haldorsen T, Andersen A, Boffetta P. Smoking-adjusted<br />
incidence of lung <strong>cancer</strong> by occupation among Norwegian<br />
men. Cancer Causes Control 2004;/15:/139 47.<br />
[84] Vainio H, Boffetta P. Mechanisms of the combined effect of<br />
asbestos <strong>and</strong> smoking in the aetiology of lung <strong>cancer</strong>. Sc<strong>and</strong><br />
J Work Environ Health 1994;/20:/235 42.<br />
[85] Blot WJ, Fraumeni JF Jr. Cancers of the lung <strong>and</strong> pleura.<br />
In: Schottenfeld D, Fraumeni JF Jr, editors. Cancer<br />
epidemiology <strong>and</strong> prevention. Oxford: Oxford University<br />
Press; 1996. p. 637 65.<br />
[86] Alberg AJ, Ford JG, Samet JM. Epidemiology of lung<br />
<strong>cancer</strong>: ACCP evidence-based clinical practice guidelines.<br />
2nd ed. Chest 2007;/132(Suppl 3):/S29 55.<br />
[87] Weiderpass E, Boffetta P, Vainio H. <strong>Occupation</strong>al causes of<br />
<strong>cancer</strong>. In: Alison MR, editor. The <strong>cancer</strong> h<strong>and</strong>book.<br />
Chichester (UK): John Wiley & Sons Ltd; 2007. p. 443 52.<br />
[88] Statistics Norway [Statistisk sentralbyra˚]. The share of daily<br />
smokers is still decreasing. Oslo (Norway): Statistics<br />
Norway; 2007. Available from: http://www.ssb.no/english/<br />
subjects/03/01/royk_en/arkiv/<br />
[89] Statistiska Centralbyra˚n [Statistics Sweden]. Alkohol- och<br />
tobaksbruk [Alcohol <strong>and</strong> tobacco use]. Report No. 114.<br />
Stockholm (Sweden): Statistika Centralbyra˚n; 2007.<br />
Swedish. Available from: http://www.scb.se/statistik/_<br />
publikationer/LE0101_2004I05_BR_LE114SA0701.pdf<br />
[90] Ly´ðheilsustöð [Public Health <strong>Institute</strong> of Icel<strong>and</strong>]. Umfang<br />
reykinga [Tobacco use]. Reykjavik (Icel<strong>and</strong>): Ly´ðheilsustöð;<br />
2007. Icel<strong>and</strong>ic. Available from: http://www.lydheilsustod.<br />
is/media/tobaksvarnir/rannsoknir/umfang_reykinga.pdf<br />
[91] Baksaas I, Lund E, Skjerven JE, Langard S, Vellar OD,<br />
Aaro LE. [Cancer in merchant seamen. A group study;<br />
Norwegian]. Tidsskr Nor Laegeforen 1983;/103: /2317 20.<br />
[92] Rafnsson V, Gunnarsdottir H. Cancer incidence among<br />
seamen in Icel<strong>and</strong>. Am J Ind Med 1995;/27:/187 93.<br />
[93] Pukkala E, Saarni H. Cancer incidence among Finnish<br />
seafarers, 1967 92. Cancer Causes Control 1996;/7:/231 9.<br />
[94] Gunnarsdottir H, Rafnsson V. Cancer incidence among<br />
Icel<strong>and</strong>ic farmers 1977 1987. Sc<strong>and</strong> J Soc Med 1991;/19:/<br />
170 3.<br />
[95] Boffetta P, Stayner LT. Pleural <strong>and</strong> peritoneal neoplasms.<br />
In: Schottenfeld D, Fraumeni JF Jr, editors. Cancer<br />
epidemiology <strong>and</strong> prevention. New York (US): Oxford<br />
University Press; 2006. p. 659 73.<br />
<strong>Occupation</strong> <strong>and</strong> <strong>cancer</strong> in Nordic countries 787<br />
[96] Straif K, Baan R, Grosse Y, Secretan B, Ghissassi V,<br />
Bouvard V, et al. Carcinogenicity of shift-work, painting,<br />
<strong>and</strong> fire-fighting. Lancet Oncol 2007;/8:/1065 6.<br />
[97] Colditz GA, Baer HJ, Tamimi RM. Breast <strong>cancer</strong>. In:<br />
Schottenfeld D, Fraumeni JF Jr, editors. Cancer epidemiology<br />
<strong>and</strong> prevention. New York (US): Oxford University<br />
Press; 2006. p. 995 1012.<br />
[98] Schiffman MH, Hildesheim A. Cervical <strong>cancer</strong>. In: Schottenfeld<br />
D, Fraumeni JF Jr, editors. Cancer epidemiology<br />
<strong>and</strong> prevention. New York (US): Oxford University Press;<br />
2006. p. 1044 67.<br />
[99] Cook LS, Weiss NS, Doherty JA, Chen C. Endometrial<br />
<strong>cancer</strong>. In: Schottenfeld D, Fraumeni JF Jr, editors. Cancer<br />
epidemiology <strong>and</strong> prevention. New York (US): Oxford<br />
University Press; 2006. p. 1027 43.<br />
[100] DeVivo I, Persson I, Adami HO. Endometrial <strong>cancer</strong>. In:<br />
Adami HO, Hunter D, Trichopoulos D, editors. Textbook<br />
of <strong>cancer</strong> epidemiology. New York (US): Oxford University<br />
Press; 2008. p. 468 93.<br />
[101] Palmer JR, Feltmate CM. Choriocarcinoma. In: Schottenfeld<br />
D, Fraumeni JF Jr, editors. Cancer epidemiology <strong>and</strong><br />
<strong>cancer</strong>. New York (US): Oxford University Press; 2006. p.<br />
1075 86.<br />
[102] Hankinson SE, Danforth KN. Ovarian <strong>cancer</strong>. In:<br />
Schottenfeld D, Fraumeni JF Jr, editors. Cancer<br />
epidemiology <strong>and</strong> prevention. New York (US): Oxford<br />
University Press; 2006. p. 1013 26.<br />
[103] Boffetta P, Andersen A, Lynge E, Barlow L, Pukkala E.<br />
Employment as hairdresser <strong>and</strong> risk of ovarian <strong>cancer</strong> <strong>and</strong><br />
non- Hodgkin’s lymphomas among women. J Occup Med<br />
1994;/36:/61 5.<br />
[104] Riska A, Sund R, Pukkala E, Gissler M, Leminen A. Parity,<br />
tubal sterilization, hysterectomy <strong>and</strong> risk of primary fallopian<br />
tube carcinoma in Finl<strong>and</strong>, 1975 2004. Int J Cancer<br />
2007;/120:/1351 4.<br />
[105] Riska A, Leminen A, Pukkala E. Sociodemographic<br />
determinants of incidence of primary fallopian tube carcinoma,<br />
Finl<strong>and</strong> 1953 97. Int J Cancer 2003;/104:/643 5.<br />
[106] Madeleine MM, Daling JR. Cancers of the vulva <strong>and</strong><br />
vagina. In: Schottenfeld D, Fraumeni JF Jr, editors. Cancer<br />
epidemiology <strong>and</strong> prevention. New York (US): Oxford<br />
University Press; 2006. p. 1068 74.<br />
[107] Mucci L, Signorello LB, Adami HO. Prostate <strong>cancer</strong>. In:<br />
Adami HO, Hunter D, Trichopoulos D, editors. Textbook<br />
of <strong>cancer</strong> epidemiology. New York (US): Oxford University<br />
Press; 2008. p. 517 54.<br />
[108] Tretli S, Engel<strong>and</strong> A, Haldorsen T, Hakulinen T,<br />
Horte LG, Luostarinen T, et al. Prostate <strong>cancer</strong> look to<br />
Denmark? J Natl Cancer Inst 1996;/88:/128.<br />
[109] Kvale R, Auvinen A, Adami HO, Klint A, Hernes E, Moller<br />
B, et al. Interpreting trends in prostate <strong>cancer</strong> incidence<br />
<strong>and</strong> mortality in the five Nordic countries. J Natl Cancer<br />
Inst 2007;/99:/1881 7.<br />
[110] Platz EA, Giovannucci E. Prostate <strong>cancer</strong>. In: Schottenfeld<br />
D, Fraumeni JF Jr, editors. Cancer epidemiology <strong>and</strong><br />
prevention. New York (US): Oxford University Press;<br />
2006. p. 1128 50.<br />
[111] Pukkala E, Weiderpass E. Socio-economic differences in<br />
incidence rates of <strong>cancer</strong>s of the male genital organs in<br />
Finl<strong>and</strong>, 1971 95. Int J Cancer 2002;/102:/643 8.<br />
[112] Akre O. Etiological insights into the testicular <strong>cancer</strong><br />
epidemic. Stockholm (Sweden): Karolinska <strong>Institute</strong>t;<br />
1999.<br />
[113] Sarma AV, McLaughlin JC, Schottenfeld D. Testicular<br />
<strong>cancer</strong>. In: Schottenfeld D, Fraumeni JF Jr, editors. Cancer
Acta Oncol Downloaded from informahealthcare.com by 212.35.100.66 on 04/06/11<br />
For personal use only.<br />
788 E. Pukkala et al.<br />
epidemiology <strong>and</strong> prevention. New York (US): Oxford<br />
University Press; 2006. p. 1151 65.<br />
[114] Richiardi L, Tamimi R, Adami HO. Testicular <strong>cancer</strong>. In:<br />
Adami HO, Hunter D, Trichopoulos D, editors. Textbook<br />
of <strong>cancer</strong> epidemiology. New York (US): Oxford University<br />
Press; 2008. p. 555 72.<br />
[115] Wideroff L, Schottenfeld D. Penile <strong>cancer</strong>. In: Schottenfeld<br />
D, Fraumeni JF Jr, editors. Cancer epidemiology <strong>and</strong><br />
prevention. New York (US): Oxford University Press;<br />
2006. p. 1166 72.<br />
[116] Peters RK, Mack TM, Bernstein L. Parallels in the<br />
epidemiology of selected anogenital carcinomas. J Natl<br />
Cancer Inst 1984;/72:/609 15.<br />
[117] McLaughlin JK, Lipworth L, Tarone RE, Blot WJ. Renal<br />
<strong>cancer</strong>. In: Schottenfeld D, Fraumeni JF Jr, editors. Cancer<br />
epidemiology <strong>and</strong> prevention. New York (US): Oxford<br />
University Press; 2006. p. 1087 100.<br />
[118] Siemiatycki J, Richardson L, Boffetta P. <strong>Occupation</strong>. In:<br />
Schottenfeld D, Fraumeni JF, editors. Cancer epidemiology<br />
<strong>and</strong> prevention. New York (US): Oxford University<br />
Press; 2006. p. 322 54.<br />
[119] Kleemola P, Roos E, Pletinen P. [Dietary changes by the<br />
level of education; Finnish]. Sos Laaketiet Aikak 1996;/<br />
33(1):/9 16.<br />
[120] Socialstyrelsen [National Board of Health <strong>and</strong> Welfare].<br />
Folkhälsrapport 1994 [Public health report 1994]. Reports<br />
of the National Board of Health <strong>and</strong> Welfare. Vol 9.<br />
Stockholm (Sweden): Socialstyrelsen; 1994. Swedish.<br />
[121] Silverman DT, Devesa SS, Moore LE, Rothman N.<br />
Bladder <strong>cancer</strong>. In: Schottenfeld D, Fraumeni JF Jr,<br />
editors. Cancer epidemiology <strong>and</strong> prevention. New York<br />
(US): Oxford University Press; 2006. p. 1101 27.<br />
[122] International Agency for Research on Cancer (IARC).<br />
Overall evaluation of carcinogenecity: an updating of<br />
IARC Monographs, volumes 1 42. IARC monographs on<br />
the evaluation of carcinogenic risk to humans. Suppl 7.<br />
Lyon (France): IARC; 1987.<br />
[123] International Agency for Research on Cancer (IARC).<br />
Polynuclear aromatic compounds, part I: chemical, environmental<br />
<strong>and</strong> experimental data. IARC Monographs on<br />
the evaluation of carcinogenic risk to humans. Vol 32.<br />
Lyon (France): IARC; 1983.<br />
[124] Gruber SB, Armstrong BK. Cutaneous <strong>and</strong> ocular melanoma.<br />
In: Schottenfeld D, Fraumeni JF Jr, editors. Cancer<br />
epidemiology <strong>and</strong> prevention. New York (US): Oxford<br />
University Press; 2006. p. 1196 229.<br />
[125] Fritschi L, Siemiatycki J. Melanoma <strong>and</strong> occupation:<br />
Results of a case-control study. Occup Environ Med<br />
1996;/53:/168 73.<br />
[126] Vagero D, Swerdlow AJ, Beral V. <strong>Occupation</strong> <strong>and</strong> malignant<br />
melanoma: A study based on <strong>cancer</strong> registration data<br />
in Engl<strong>and</strong> <strong>and</strong> Wales <strong>and</strong> in Sweden. Br J Ind Med 1990;/<br />
47:/317 24.<br />
[127] Perez-Gomez B, Pollan M, Gustavsson P, Plato N,<br />
Aragones N, Lopez-Abente G. Cutaneous melanoma:<br />
Hints from occupational risks by anatomic site in Swedish<br />
men. Occup Environ Med 2004;/61:/117 26.<br />
[128] Bruzell EM, Johnsen B, Aalerud TN, Christensen T.<br />
Evaluation of eye protection filters for use with dental<br />
curing <strong>and</strong> bleaching lamps. J Occup Environ Hyg 2007;/4:/<br />
432 9.<br />
[129] Pukkala E, Aspholm R, Auvinen A, Eliasch H, Gundestrup<br />
M, Haldorsen T, et al. Incidence of <strong>cancer</strong> among Nordic<br />
airline pilots over five decades: <strong>Occupation</strong>al cohort study.<br />
BMJ 2002;/325(7364):/567.<br />
[130] Karagas MR, Weinstock MA, Nelson HH. Keratinocyte<br />
carcinomas (Basal <strong>and</strong> squamous cell carcinomas of the<br />
skin). In: Schottenfeld D, Fraumeni JF Jr, editors. Cancer<br />
epidemiology <strong>and</strong> prevention. New York (US): Oxford<br />
University Press; 2006. p. 1230 50.<br />
[131] Savitz D, Trichopoulos D. Brain <strong>cancer</strong>. In: Adami HO,<br />
Hunter D, Trichopoulos D, editors. Textbook of <strong>cancer</strong><br />
epidemiology. New York (US): Oxford University Press;<br />
2008. p. 617 35.<br />
[132] Ron E, Schneider AB. Thyroid <strong>cancer</strong>. In: Schottenfeld D,<br />
Fraumeni JF Jr, editors. Cancer epidemiology <strong>and</strong> prevention.<br />
New York (US): Oxford University Press; 2006. p.<br />
975 94.<br />
[133] Miller RW, Boice JD, Curtis RE. Bone <strong>cancer</strong>. In:<br />
Schottenfeld D, Fraumeni JF Jr, editors. Cancer epidemiology<br />
<strong>and</strong> prevention. New York (US): Oxford University<br />
Press; 2006. p. 946 58.<br />
[134] Berwick M. Soft tissue sarcoma. In: Schottenfeld D,<br />
Fraumeni JF Jr, editors. Cancer epidemiology <strong>and</strong> prevention.<br />
New York (US): Oxford University Press; 2006. p.<br />
959 74.<br />
[135] S<strong>and</strong>in S, Hjalgrim H, Glimelius B, Rostgaard K, Pukkala<br />
E, Askling J. Incidence of non-Hodgkin’s lymphoma in<br />
Sweden, Denmark, <strong>and</strong> Finl<strong>and</strong> from 1960 through 2003:<br />
An epidemic that was. Cancer Epidemiol Biomarkers Prev<br />
2006;/15:/1295 300.<br />
[136] Hartge P, Wang SS, Bracci PM, Devesa SS, Holly EA.<br />
Non-Hodgkin lymphoma. In: Schottenfeld D, Fraumeni JF<br />
Jr, editors. Cancer epidemiology <strong>and</strong> prevention. New York<br />
(US): Oxford University Press; 2006. p. 898 918.<br />
[137] Melbye M, Smedby KE, Trichopoulos D. Non-Hodgkin’s<br />
lymphomas. In: Adami HO, Hunter D, Trichopoulos D,<br />
editors. Textbook of <strong>cancer</strong> epidemiology. New York (US):<br />
Oxford University Press; 2008. p. 669 93.<br />
[138] Mueller NE, Grufferman S. Hodgkin lymphoma. In:<br />
Schottenfeld D, Fraumeni JF Jr, editors. Cancer epidemiology<br />
<strong>and</strong> prevention. New York (US): Oxford University<br />
Press; 2006. p. 872 97.<br />
[139] Melbye M, Hjalgrim H, Adami HO. Hodgkin’s lymphoma.<br />
In: Adami HO, Hunter D, Trichopoulos D, editors. Textbook<br />
of <strong>cancer</strong> epidemiology. New York (US): Oxford<br />
University Press; 2008. p. 653 66.<br />
[140] Zheng T, Blair A, Zhang Y, Weisenburger DD, Zahm SH.<br />
<strong>Occupation</strong> <strong>and</strong> risk of non-Hodgkin’s lymphoma <strong>and</strong><br />
chronic lymphocytic leukemia. J Occup Environ Med<br />
2002;/44:/469 74.<br />
[141] Amadori D, Nanni O, Falcini F, Saragoni A, Tison V,<br />
Callea A, et al. Chronic lymphocytic leukaemias <strong>and</strong> non-<br />
Hodgkin’s lymphomas by histological type in farminganimal<br />
breeding workers: A population case-control study<br />
based on job titles. Occup Environ Med 1995;/52:/374 9.<br />
[142] Speer SA, Semenza JC, Kurosaki T, Anton-Culver H. Risk<br />
factors for acute myeloid leukemia <strong>and</strong> multiple myeloma:<br />
A combination of GIS <strong>and</strong> case-control studies. J Environ<br />
Health 2002;/64:/9 16.<br />
[143] Linet MS, Devesa SS, Morgan GJ. The leukemias. In:<br />
Schottenfeld D, Fraumeni JF Jr, editors. Cancer epidemiology<br />
<strong>and</strong> prevention. New York (US): Oxford University<br />
Press; 2006. p. 841 71.<br />
[144] Bethwaite P, Cook A, Kennedy J, Pearce N. Acute<br />
leukemia in electrical workers: A New Zeal<strong>and</strong> case-control<br />
study. Cancer Causes Control 2001;/12:/683 9.<br />
[145] Guo J, Kauppinen T, Kyyronen P, Heikkila P, Lindbohm<br />
ML, Pukkala E. Risk of esophageal, ovarian, testicular,<br />
kidney <strong>and</strong> bladder <strong>cancer</strong>s <strong>and</strong> leukemia among Finnish<br />
workers exposed to diesel or gasoline engine exhaust. Int J<br />
Cancer 2004;/111:/286 92.<br />
[146] Morales-Suarez-Varela MM, Olsen J, Johansen P, Kaerlev<br />
L, Guenel P, Arveux P, et al. <strong>Occupation</strong>al risk factors for
Acta Oncol Downloaded from informahealthcare.com by 212.35.100.66 on 04/06/11<br />
For personal use only.<br />
mycosis fungoides: A <strong>European</strong> multicenter case-control<br />
study. J Occup Environ Med 2004;/46:/205 11.<br />
[147] Linet MS, McLaughlin JK, Malker HS, Chow WH, Weiner<br />
JA, Stone BJ, et al. <strong>Occupation</strong> <strong>and</strong> hematopoietic <strong>and</strong><br />
lymphoproliferative malignancies among women: A linked<br />
registry study. J Occup Med 1994;/36:/1187 98.<br />
[148] Finnish Cancer Registry [Suomen Syöpärekisteri]. Cancer<br />
in Finl<strong>and</strong> 2004 <strong>and</strong> 2005. Cancer Statistics of the<br />
National Research <strong>and</strong> Development Centre for Welfare<br />
<strong>and</strong> Health. No. 72. Helsinki (Finl<strong>and</strong>): Finnish Cancer<br />
Registry; 2007.<br />
[149] National Board of Health <strong>and</strong> Welfare [Socialstyrelsen],<br />
Centre for Epidemiology. Cancer incidence in Sweden<br />
2006. Statistics- Health <strong>and</strong> Diseases. Vol 16. Stockholm<br />
(Sweden): National Board of Health <strong>and</strong> Welfare; 2007<br />
[cited 2007 Dec 19]. Available from: http://www.socialstyr<br />
elsen.se/Publicerat/2007/9850/2007-42-16.htm<br />
[150] Curado MP , Edwards B, Shin HR, Storm H, Ferlay J,<br />
Heanue M, et al. Cancer incidence in five continents. Vol<br />
IX. Curado MP, Edwards B, Shin HR, Storm H, Ferlay J,<br />
Heanue M, et al., editors. IARC Scientific Publications No.<br />
160. Lyon (France): IARC; 2007.<br />
[151] Statistisk Sentralbyra˚ [Statistics Norway]. Folke- og<br />
boligtelling 1970. Kontrollundersøkelse [Population <strong>and</strong><br />
housing census 1970. Evaluation survey]. Vol 6. Oslo<br />
(Norway): Statistisk Sentralbyra˚; 1970. Norwegian.<br />
[152] Statistiska Centralbyra˚n [Statistics Sweden]. [Population<br />
<strong>and</strong> housing census 1970: Results from the evaluation<br />
studies concerning economic activity <strong>and</strong> education].<br />
Statistiska meddel<strong>and</strong>en Be. Vol 3. Stockholm (Sweden):<br />
Statistiska Centralbyra˚n; 1974. Swedish.<br />
[153] Kolari R. <strong>Occupation</strong>al mortality in Finl<strong>and</strong> 1975/1980/<br />
1985. Helsinki (Finl<strong>and</strong>): Statisics Finl<strong>and</strong>; 1989.<br />
[154] Lynge E, Carstensen B, Andersen O. Primary liver <strong>cancer</strong><br />
<strong>and</strong> renal cell carcinoma in laundry <strong>and</strong> dry-cleaning<br />
workers in Denmark. Sc<strong>and</strong> J Work Environ Health 1995;/<br />
21:/293 5.<br />
[155] Meurman LO, Pukkala E, Hakama M. Incidence of <strong>cancer</strong><br />
among anthophyllite asbestos miners in Finl<strong>and</strong>. Occup<br />
Environ Med 1994;/51:/421 5.<br />
[156] Lynge E. Dødelighet og erhverv 1970 75. Statistiske<br />
undersøgelser [Mortality <strong>and</strong> occupation 1970-75. Statistical<br />
investigations]. Vol 37. Copenhagen (Denmark):<br />
Danmarks Statistik; 1979. Danish.<br />
[157] Notkola V, Pajunen A, Leino-Arjas P. <strong>Occupation</strong>al mortality<br />
by cause in Finl<strong>and</strong> 1971 1991 <strong>and</strong> occupational<br />
mobility. SVT health. Vol 1. Helsinki (Finl<strong>and</strong>): Statisics<br />
Finl<strong>and</strong>; 1997.<br />
[158] Pukkala E. Biobanks <strong>and</strong> registers in epidemiological<br />
research on <strong>cancer</strong>. In: Dillner J, editor. Methods in<br />
biobanking. Methods in melocular biology. Totowa (US):<br />
Humana Press; 2009.<br />
[159] Osterlind A, Jensen OM. [Evaluation of <strong>cancer</strong> registration<br />
in Denmark in 1977. Preliminary evaluation of <strong>cancer</strong><br />
registration by the Cancer Register <strong>and</strong> the National<br />
Patient Register; Danish]. Ugeskr Laeger 1985;/147(31):/<br />
2483 8.<br />
[160] Tulinius H, Storm HH, Pukkala E, Andersen A, Ericsson J.<br />
Cancer in the Nordic countries, 1981 86. A joint publication<br />
of the five Nordic Cancer Registries. APMIS 1992;/<br />
31(Suppl):/S1 S194.<br />
[161] Larsen IK, Sma˚stuen M, Parkin DM, Bray F. Data quality<br />
at the Cancer Registry of Norway. Cancer in Norway<br />
2006 - Cancer incidence, mortality, survival <strong>and</strong> prevalence<br />
in Norway. Oslo (Norway): Cancer Registry of Norway;<br />
2007.<br />
<strong>Occupation</strong> <strong>and</strong> <strong>cancer</strong> in Nordic countries 789<br />
[162] Teppo L, Pukkala E, Lehtonen M. Data quality <strong>and</strong> quality<br />
control of a population-based <strong>cancer</strong> registry. Experience in<br />
Finl<strong>and</strong>. Acta Oncol 1994;/33:/365 9.<br />
[163] Storm HH, M<strong>and</strong>ers T, Spørgel P, Bang S, Jensen<br />
OM. Cancer incidence in Denmark 1987. Copenhagen<br />
(Denmark): Danish Cancer Society [Kræftens Bekæmpelse];<br />
1990.<br />
[164] Vidarsdottir H, Stefansdottir S, Jonsdottir A, Jonasson JG,<br />
Trggvadottir L. [Completeness <strong>and</strong> accuracy of <strong>cancer</strong><br />
registration in Icel<strong>and</strong>. Internal report of Icel<strong>and</strong>ic Cancer<br />
Registry]. Reykjavik (Icel<strong>and</strong>): Krabbameinsskrá Ísl<strong>and</strong>s;<br />
2008. Icel<strong>and</strong>ic.<br />
[165] Mattson B. Cancer registration in Sweden. Stockholm<br />
(Sweden): Karolinska <strong>Institute</strong>t; 1984.<br />
[166] Barlow L, Westergren K, Holmberg L, Talback M. The<br />
completeness of the Swedish Cancer Register: a sample<br />
survey for year 1998. Acta Oncol 2009; 48(1):27 33.<br />
[167] Pukkala E, Patama T, Engholm G, Ólafsdóttir GH, Bray F,<br />
Talbäck M, et al. Small-area based map animations of<br />
<strong>cancer</strong> incidence in the Nordic countries, 1971 2003.<br />
Nordic Cancer <strong>Union</strong>; 2007. Available from: http://astra.<br />
<strong>cancer</strong>.fi/<strong>cancer</strong>maps/Nordic/<br />
[168] Pukkala E, Notkola V. Cancer incidence among Finnish<br />
farmers, 1979 93. Cancer Causes Control 1997;/8:/25 33.<br />
[169] Peto R, Lopez AD, Boreham J, Thun M, Heath C.<br />
Mortality from smoking in developed countries 1950<br />
2000: Indirect estimates from national vital statistics.<br />
Oxford (UK): Oxford University Press; 1994.<br />
[170] Graham H. Smoking prevalence among women in the<br />
<strong>European</strong> community 1950 1990. Soc Sci Med 1996;/43:/<br />
243 54.<br />
[171] Cavelaars AE, Kunst AE, Geurts JJ, Crialesi R, Grotvedt L,<br />
Helmert U, et al. Educational differences in smoking:<br />
International comparison. BMJ 2000;/320(7242):/1102 7.<br />
[172] Helakorpi S, Uutela A, Prättälä R, Berg M-A, Puska P.<br />
Suomalaisen aikuisväestön terveyskäyttäytyminen, kevät<br />
1997 [Health behaviour among Finnish adult population,<br />
Spring 1997. Publications of the National Public Health<br />
<strong>Institute</strong> B]. No. 10. Helsinki (Finl<strong>and</strong>): Kansantervcyslaitos;<br />
1997. Finnish.<br />
[173] Pukkala E, Guo J, Kyyronen P, Lindbohm ML, Sallmen M,<br />
Kauppinen T. National job-exposure matrix in analyses of<br />
census-based estimates of occupational <strong>cancer</strong> risk. Sc<strong>and</strong> J<br />
Work Environ Health 2005;/31:/97 107.<br />
[174] Ragnarsson J, Blöndal T. Reykingavenjur 1985 1988<br />
[Smoking habits 1985 1988]. Reykjavik (Icel<strong>and</strong>): Tóbaksvarnarnefnd<br />
og L<strong>and</strong>læknisembættið; 1989. Icel<strong>and</strong>ic.<br />
[175] Hansen EJ, Andersen D. Alkoholforbrug og alkoholpolitik<br />
[Alcohol consumption <strong>and</strong> alcohol politics]. Vol 145.<br />
Copenhagen (Denmark): Socialforskningsinstituttet; 1985.<br />
Danish.<br />
[176] Jensen OM. Cancer morbidity <strong>and</strong> causes of death among<br />
Danish brewery workers. Int J Cancer 1979;/23:/454 63.<br />
[177] Kjaerheim K, Andersen A. Incidence of <strong>cancer</strong> among male<br />
waiters <strong>and</strong> cooks: Two Norwegian cohorts. Cancer Causes<br />
Control 1993;/4:/419 26.<br />
[178] Martelin T. Tupakointitapojen kehitys Suomessa haastatteluja<br />
kyselyttutkimusten valossa [The development of<br />
smoking habits according to survey data in Finl<strong>and</strong>].<br />
Health education: original report series. Vol 1. Helsinki<br />
(Finl<strong>and</strong>): Lääkintöhallitus; 1984. Finnish.<br />
[179] World Cancer Research Fund (WCRF); American <strong>Institute</strong><br />
for Cancer Research (AICR). Fats <strong>and</strong> oils. In: Food,<br />
Nutrition, Physical Activity, <strong>and</strong> the Prevention of Cancer:<br />
a Global Perspective. Washington DC (US): AICR; 2007.<br />
p. 135 140.
Acta Oncol Downloaded from informahealthcare.com by 212.35.100.66 on 04/06/11<br />
For personal use only.<br />
790 E. Pukkala et al.<br />
[180] Johansson L, Thelle DS, Solvoll K, Bjorneboe GE, Drevon<br />
CA. Healthy dietary habits in relation to social determinants<br />
<strong>and</strong> lifestyle factors. Br J Nutr 1999;/81:/211 20.<br />
[181] Lund-Larsen K. Kostholdsdata fra forbrukerundersøkelsen<br />
1986 88 [Dietary data from the consumer survey 1986<br />
88]. AKF Tablereport No. 8. Oslo (Norway): Institutt for<br />
ernæringsforskning, Universitetet i Oslo; 1991. Norwegian.<br />
[182] Roos E, Prattala R, Lahelma E, Kleemola P, Pietinen P.<br />
Modern <strong>and</strong> healthy?: Socioeconomic differences in the<br />
quality of diet. Eur J Clin Nutr 1996;/50:/753 60.<br />
[183] Steingrímsdóttir L, þorgeirsdóttir H, Ægisdóttir S. Mataræði<br />
og mannlif [Food consumption <strong>and</strong> people’s life].<br />
Könnun á mataræði Íslendinga [Survey on food consumption<br />
in Icel<strong>and</strong>]. No. 2. Reykjavik (Icel<strong>and</strong>): Manneldisráð<br />
Ísl<strong>and</strong>s; 1992. Icel<strong>and</strong>ic.<br />
[184] World Cancer Research Fund (WCRF); American <strong>Institute</strong><br />
for Cancer Research (AICR). Body fatness. In: Food,<br />
Nutrition, Physical Activity, <strong>and</strong> the Prevention of Cancer:<br />
A global perspective. Washington DC (US): AICR; 2007.<br />
p. 211 28.<br />
[185] World Cancer Research Fund (WCRF); American <strong>Institute</strong><br />
for Cancer Research (AICR). Physical activity. In: Food,<br />
Nutrition, Physical Activity, <strong>and</strong> the Prevention of Cancer:<br />
a Global Perspective. Washington DC (US): AICR; 2007.<br />
p. 198 209.<br />
[186] Tamimi R, Hankinson SE, Hunter D. Breast <strong>cancer</strong>. In:<br />
Adami HO, Hunter D, Trichopoulos D, editors. Textbook<br />
of <strong>cancer</strong> epidemiology. New York (US): Oxford University<br />
Press; 2008. p. 403 45.<br />
[187] Webb P, Gertig D, Hunter D. Ovarian <strong>cancer</strong>. In: Adami<br />
HO, Hunter D, Trichopoulos D, editors. Textbook of<br />
<strong>cancer</strong> epidemiology. New York (US): Oxford University<br />
Press; 2008. p. 494 516.<br />
[188] Hinkula M, Pukkala E, Kyyronen P, Kauppila A. Incidence<br />
of ovarian <strong>cancer</strong> of gr<strong>and</strong> multiparous women a population-based<br />
study in Finl<strong>and</strong>. Gynecol Oncol 2006;/103:/<br />
207 11.<br />
[189] Tryggvadottir L, Tulinius H, Eyfjord JE, Sigurvinsson T.<br />
Breast <strong>cancer</strong> risk factors <strong>and</strong> age at diagnosis: An Icel<strong>and</strong>ic<br />
cohort study. Int J Cancer 2002;/98:/604 8.<br />
[190] Mørkeberg H. Fødslers placering i familiens livsforløb<br />
[Child-spacing in the family life cycle]. Socialforskningsinstituttet<br />
rapport No. 68. Copenhagen (Denmark): Socialforskningsinstituttet;<br />
1976. Danish.<br />
[191] Hoem B. Lärare föder fler barn [Teachers have more<br />
children]. Välfärdsbulletinen No. 3. Stockholm (Sweden):<br />
Statistiska centralbyra˚n; 1994. p. 17 9. Swedish.<br />
[192] Lund E. The <strong>cancer</strong> registry of Norway: pilot study for the<br />
evaluation of completeness of reporting to the Cancer<br />
Registry. Oslo (Norway): Cancer Registry of Norway;<br />
1981.
Acta Oncol Downloaded from informahealthcare.com by 212.35.100.66 on 04/06/11<br />
For personal use only.<br />
Appendix 1. Abbreviations of the occupational categories defined by NYK-codes <strong>and</strong> ISCO-1958 codes.<br />
No <strong>Occupation</strong>al category Abbreviation NYK ISCO<br />
1 Technical, chemical, physical <strong>and</strong> biological<br />
workers<br />
Technical workers, etc. 00, 01, 02(except 013) 00, 01, 02, 0X1<br />
2 Laboratory assistants Laboratory assistants 013 0X9<br />
3 Physicians Physicians 030, 031 031<br />
4 Dentists Dentists 032 032<br />
5 Nurses Nurses 040, 041, 042 041, 042<br />
6 Assistant nurses Assistant nurses 045 04920<br />
7 Other health <strong>and</strong> medical workers ‘‘Other health workers’’ 043, 046, 047, 049, 05 04990, 05<br />
8 Teachers Teachers 06 06<br />
9 Religious, juridical <strong>and</strong> other social science<br />
related workers<br />
Religious workers etc. 07, 08, 0x 07, 08, 0Y<br />
10 Artistic workers Artistic workers 09 (except 095) 091, 093<br />
11 Journalists Journalists 095 092<br />
12 Administrators <strong>and</strong> managers Administrators 10, 11 10, 11<br />
13 Clerical workers Clerical workers 20, 21, 29 20, 21, 29<br />
14 Sale <strong>and</strong> agents Sales agents 30, 31, 32, 33 (except 332, 333) 30, 31, 32., 332, 339<br />
15 Shop managers <strong>and</strong> assistants Shop workers 332, 333 331<br />
16 Farmers Farmers 401, 404, 411 40110 40166, 40190, 41110 41150,<br />
41175 41190<br />
17 Gardeners <strong>and</strong> related workers Gardeners 40, 41, 42 (except 401, 404, 411) 40169 40184, 41155 41170, 42<br />
18 Fishermen, whalers <strong>and</strong> sealers Fishermen 43 43<br />
19 Forestry workers Forestry workers 44 44<br />
20 Miners <strong>and</strong> quarriers Miners <strong>and</strong> quarry workers 50, 51, 52, 59 50, 51, 52, 59<br />
21 Seamen Seamen 60, 61 60, 61<br />
22 Transport workers Transport workers 62, 63, 65, 66, 69 62, 63, 65, 66, 69<br />
23 Drivers Drivers 64 64<br />
24 Postal <strong>and</strong> communication workers Postal workers 67, 68 67, 68<br />
25 Textile workers Textile workers 70, 71 70, 71<br />
26 Shoe <strong>and</strong> leather workers Shoe <strong>and</strong> leather workers 72 72<br />
27 Smelters <strong>and</strong> metal foundry workers Smelting workers 73 73<br />
28 Mechanics, iron <strong>and</strong> metalware workers Mechanics 75 (except 755, 756) 75010 75490, 75705 75990<br />
29 Plumbers Plumbers 755 755<br />
30 Welders Welders 756 756<br />
31 Electrical workers Electrical workers 76 76<br />
32 Wood workers Wood workers 77 77<br />
33 Painter <strong>and</strong> wall paperhangers Painters 78 78<br />
34 Other construction workers ‘‘Other construction workers’’ 79 (except 791) 79210 79990<br />
35 Bricklayers Bricklayers 791 791<br />
36 Printers <strong>and</strong> related workers Printers 80 80<br />
37 Chemical process workers Chemical process workers 83 83<br />
38 Food manufacture workers Food workers 82 (except 824) 82120 82390, 82510 82990<br />
39 Beverage manufacture workers Beverage workers 824 824<br />
40 Tobacco manufacture workers Tobacco workers 84 84<br />
41 Glass, ceramic <strong>and</strong> tile workers <strong>and</strong> others Glass makers etc. 81, 85 81, 85<br />
42 Packers, loaders <strong>and</strong> warehouse workers Packers 86, 88 86, 88<br />
43 Engine <strong>and</strong> motor operator workers Engine operators 87 87<br />
44 Public safety <strong>and</strong> protection workers Public safety workers 90 90<br />
45 Cooks <strong>and</strong> stewards Cooks <strong>and</strong> stewards 911, 912 911, 912<br />
46 Domestic assistants Domestic assistants 914, 915 91920, 91930, 91940<br />
47 Waiters Waiters 92 92<br />
48 Building caretakers <strong>and</strong> cleaners Building caretakers 93 (except 933) 93120, 93230, 93290<br />
49 Chimney sweeps Chimney sweeps 933 93240<br />
50 Hairdressers Hairdressers 941 94140, 94150, 941, 90<br />
51 Launderers <strong>and</strong> dry-cleaners Launderers 95 95<br />
52 Military personnel Military personnel X1 Armed forces<br />
53 Other economically active persons ‘‘Other workers’’ 74, 89, 96, 97, 99, 913, 916, 917,<br />
919, 942, 98, X2<br />
Remaining codes<br />
54 Economically inactive persons Economically inactive
Acta Oncol Downloaded from informahealthcare.com by 212.35.100.66 on 04/06/11<br />
For personal use only.<br />
Appendix 2. Description of the occupational categories.<br />
No <strong>Occupation</strong>al category Description<br />
1 Technical, chemical, physical <strong>and</strong> biological Includes engineers, physicists, architects, chemists, geologists, biologists, meteorologists <strong>and</strong> related<br />
workers<br />
professionals. Their main tasks require a high level of professional knowledge <strong>and</strong> experience.<br />
2 Laboratory assistants Includes life science technicians, pharmaceutical assistants, laboratory technicians, <strong>and</strong> other health<br />
professional assistants. Their main tasks involve preparing materials <strong>and</strong> equipment for experiments, tests<br />
<strong>and</strong> analyses. They collect <strong>and</strong> prepare specimens such as plant, animal, or human cells <strong>and</strong> tissues. They<br />
assist with <strong>and</strong> perform experiments <strong>and</strong> analyses. The pharmaceutical assistants h<strong>and</strong>le medicaments.<br />
3 Physicians Includes medical doctors.<br />
4 Dentists Includes all types of specialists <strong>and</strong> researchers in the field of odontology.<br />
5 Nurses Includes nurses in somatic <strong>and</strong> psychiatric hospitals, <strong>and</strong> in the field of health prevention. They give first aid<br />
treatment <strong>and</strong> dispense medications to patients.<br />
6 Assistant nurses Includes workers assisting physicians, nurses <strong>and</strong> midwives in their practical application of preventive <strong>and</strong><br />
curative measures. They provide caring services for the sick <strong>and</strong> injured.<br />
7 Other health <strong>and</strong> medical workers Includes veterinarians, pharmacists, physiotherapists, <strong>and</strong> other types of health<br />
professionals not included in the occupational categories 05 or 06. Some of them perform technical tasks<br />
related to research <strong>and</strong> practical application <strong>and</strong> operational methods in the field of medicine, veterinary<br />
medicine, dentistry, pharmacy, sanitation. Pharmacists prepare <strong>and</strong> h<strong>and</strong>le medicaments.<br />
8 Teachers Includes teachers at pre-school, primary <strong>and</strong> secondary schools, college, university, <strong>and</strong> special education<br />
professionals. The majority works at primary schools.<br />
9 Religious, juridical <strong>and</strong> other social science<br />
related workers<br />
Includes religious <strong>and</strong> legal professionals, archivists, librarians, economists, sociologists, psychologists <strong>and</strong><br />
social work professionals. The tasks of religious professionals include ritual services, various administrative<br />
<strong>and</strong> social duties. Legal professionals advise clients on legal problems <strong>and</strong> plead cases or conduct<br />
prosecutions in courts of justice. Social science <strong>and</strong> related professionals conduct research, or apply<br />
knowledge relating to philosophy, politics <strong>and</strong> economics.<br />
10 Artistic workers Includes authors (excluding journalists, cf. occupational category 11), sculptors, painters <strong>and</strong> related<br />
artists, painting restorers, composers, singers, musicians, dancers <strong>and</strong> other types of artists.<br />
11 Journalists Includes all types of journalistic work. The tasks include collecting, reporting <strong>and</strong> commenting on news <strong>and</strong><br />
current affairs for publication in newspapers <strong>and</strong> periodicals, or for broadcasting by radio or television.<br />
12 Administrators <strong>and</strong> managers Includes senior officials, managers <strong>and</strong> legislators working on behalf of governments, regional or local<br />
administrators, political parties, trade unions, <strong>and</strong> other organisations <strong>and</strong> enterprises.<br />
13 Clerical workers Includes secretaries <strong>and</strong> clerical workers in banks <strong>and</strong> insurance companies, accounting <strong>and</strong> bookkeeping<br />
clerks, keyboard-operating clerks, <strong>and</strong> other types of office workers.<br />
14 Sale <strong>and</strong> agents Includes finance <strong>and</strong> sales associate professionals <strong>and</strong> business service agents <strong>and</strong> trade brokers. They sell<br />
insurances, real estate, travel services <strong>and</strong> other business services, <strong>and</strong> they act as wholesale representatives.<br />
15 Shop managers <strong>and</strong> assistants Includes shop managers <strong>and</strong> shop sale persons, who sell goods in retail establishments <strong>and</strong> explain<br />
functions of these goods.<br />
16 Farmers Includes field crop <strong>and</strong> vegetable growers, market oriented animal producers <strong>and</strong> related workers. Tasks<br />
performed include purchasing seeds, fertiliser <strong>and</strong> other supplies; buildings <strong>and</strong> machinery; performing<br />
farm operation, sowing, cultivating <strong>and</strong> harvesting crops; breeding, raising <strong>and</strong> tending animals;<br />
maintaining farm buildings, machinery <strong>and</strong> equipment.<br />
17 Gardeners <strong>and</strong> related workers Includes gardeners, horticultural <strong>and</strong> nursery growers. They plan <strong>and</strong> carry out the necessary operations to<br />
grow vegetables, cultivate trees, shrubs, flowers <strong>and</strong> other plants, <strong>and</strong> they produce saplings, bulbs <strong>and</strong><br />
seeds for sale.<br />
18 Fishermen, whalers <strong>and</strong> sealers Includes fishermen, whale <strong>and</strong> seal hunters. They catch fish <strong>and</strong> gather other forms of aquatic life for sale or<br />
delivery to wholesale buyers or at markets. Whale <strong>and</strong> seal hunters are present only in Icel<strong>and</strong> <strong>and</strong> in<br />
Norway. They catch animals for meat, skin <strong>and</strong> other products for sale.<br />
19 Forestry workers Includes forestry workers <strong>and</strong> loggers. Forestry workers cultivate, conserve <strong>and</strong> exploit forest for delivery of<br />
forestry products to wholesale buyers.<br />
20 Miners <strong>and</strong> quarriers Includes miners <strong>and</strong> quarry workers who extract coal <strong>and</strong> solid minerals from underground or surface<br />
mines <strong>and</strong> granite, limestone <strong>and</strong> other kinds of rocks from quarries. They set up <strong>and</strong> operate machines<br />
which cut channels or drill blasting holes into the open face of mines <strong>and</strong> quarries.<br />
21 Seamen Includes all types of seamen, both sailors working on deck <strong>and</strong> in engine rooms. Ship deck crews <strong>and</strong> related<br />
workers carry out deck duties on board ships. The ship deck officers comm<strong>and</strong> <strong>and</strong> navigate ships. Ship<br />
engineers control <strong>and</strong> participate in the operation, maintenance <strong>and</strong> repair of the mechanical <strong>and</strong> electrical<br />
machinery on board.<br />
22 Transport workers Includes railway staff, buss <strong>and</strong> train staff, except drivers, <strong>and</strong> aircraft pilots, traffic supervisors <strong>and</strong> other<br />
transport <strong>and</strong> communication workers.<br />
23 Drivers Includes car, taxi, van, bus, motor-cycle, tram, heavy truck <strong>and</strong> lorry drivers. Their tasks include driving<br />
<strong>and</strong> tending their vehicles in order to transport materials, goods, <strong>and</strong> passengers.<br />
24 Post <strong>and</strong> communication workers Includes postal workers such as mail carriers, sorting clerks <strong>and</strong> telephone switchboard operators.<br />
Communication workers include telegraph operators <strong>and</strong> other types of communication workers.<br />
25 Textile workers Includes textile work such as operators of fibre preparing, spinning, winding, weaving, knitting, sewing,<br />
bleaching, dyeing, <strong>and</strong> fur preparing machines.<br />
26 Shoe <strong>and</strong> leather workers Includes shoe <strong>and</strong> leather workers who produce <strong>and</strong> repair footwear, h<strong>and</strong>bags, etc. Leather workers treat<br />
hides <strong>and</strong> skins in solutions <strong>and</strong> apply finishing product to convert them into leather.<br />
27 Smelters <strong>and</strong> metal foundry workers Includes ore <strong>and</strong> metal furnace operators, metal smelters, casters <strong>and</strong> rolling mill operators, metal heat<br />
treating plant operators <strong>and</strong> metal drawers <strong>and</strong> extruders. Their tasks include operating <strong>and</strong> monitoring<br />
furnaces for ore smelting, refining, converting or reheating metal.<br />
28 Mechanics, iron <strong>and</strong> metal ware workers Includes workers who make products of metal, <strong>and</strong> assemble <strong>and</strong> repair machines <strong>and</strong> motors. The Danish<br />
data also include welders in this category, cf occupational category 30.
Acta Oncol Downloaded from informahealthcare.com by 212.35.100.66 on 04/06/11<br />
For personal use only.<br />
Appendix 2 (Continued)<br />
No <strong>Occupation</strong>al category Description<br />
29 Plumbers Workers in this category assemble, fit, install <strong>and</strong> repair pipes <strong>and</strong> pipeline systems for drainage, heating,<br />
water supply, <strong>and</strong> sanitary systems.<br />
30 Welders Workers in this category join <strong>and</strong> cut metal parts using flame, electric arc <strong>and</strong> other sources of heat to melt<br />
<strong>and</strong> cut or fuse metal. The Danish welders are included in the mechanic workers (occupational category<br />
28).<br />
31 Electrical workers Workers in this category fit, assemble, install, maintain <strong>and</strong> repair electrical <strong>and</strong> electronic equipment such<br />
as electrical motors, generators, instruments, signal transmitters <strong>and</strong> receivers, domestic appliances,<br />
switchgear, <strong>and</strong> control apparatus. They install <strong>and</strong> service electrical wiring systems in homes, industrial<br />
plants, ships, motor vehicles, <strong>and</strong> aircrafts, <strong>and</strong> install <strong>and</strong> service electrical power transmission cables,<br />
telephone <strong>and</strong> telegraph lines <strong>and</strong> related equipment.<br />
32 Wood workers Workers in this category prepare <strong>and</strong> treat wood, <strong>and</strong> make, assemble <strong>and</strong> repair constructions <strong>and</strong><br />
products of wood.<br />
33 Painters <strong>and</strong> wall paperhangers Painters prepare structural surfaces for painting <strong>and</strong> apply decorative <strong>and</strong> protective coatings to buildings,<br />
ships, motor vehicles <strong>and</strong> articles of wood, metal, textile <strong>and</strong> other materials. Wall paperhangers cover<br />
interior walls <strong>and</strong> ceilings.<br />
34 Other construction workers Includes workers in the building <strong>and</strong> construction industry who do not constitute separate occupational<br />
categories in this study. Included here are reinforced concreters, cement finishers, terrazzo workers,<br />
insulators, glaziers, underwater workers, <strong>and</strong> other unspecified building <strong>and</strong> construction workers.<br />
35 Bricklayers Workers in this category erect <strong>and</strong> repair foundations, walls <strong>and</strong> complete structures of brick, stone <strong>and</strong><br />
similar materials <strong>and</strong> cover <strong>and</strong> decorate walls, ceilings <strong>and</strong> floors of buildings with tiles <strong>and</strong> mosaic panels.<br />
36 Printers <strong>and</strong> related workers Workers in this category compose type, cast <strong>and</strong> engrave printing plates <strong>and</strong> operate printing presses to<br />
print text <strong>and</strong> illustrations. Includes type setters, printers (not textile printers) <strong>and</strong> book binders.<br />
37 Chemical process workers Workers in this category distil, refine, cook, roast <strong>and</strong> grind chemicals, prepare pulp for paper production,<br />
<strong>and</strong> make paper.<br />
38 Food manufacture workers Workers in this category prepare food products of all kind for human <strong>and</strong> animal consumption. Includes<br />
occupations such as grain millers, butchers <strong>and</strong> meat preparers, food preservers, dairy product processors,<br />
fish plant workers, bakers, pastry cooks <strong>and</strong> confectionery makers.<br />
39 Beverage manufacture workers Workers in this category produce liquor, wine, beer, soft drinks <strong>and</strong> mineral water.<br />
40 Tobacco manufacture workers Workers in this category prepare <strong>and</strong> treat tobacco leaves <strong>and</strong> make cigarettes, cigars, <strong>and</strong> other tobacco<br />
products.<br />
41 Glass, ceramic, <strong>and</strong> tile workers <strong>and</strong> others Includes glass formers <strong>and</strong> cutters, potters, glass <strong>and</strong> ceramics kiln men, glass engravers <strong>and</strong> etchers, glass<br />
painters <strong>and</strong> decorators, rubber <strong>and</strong> plastic product makers, tanners, fellmongers <strong>and</strong> pelt dressers, musical<br />
instrument makers <strong>and</strong> tuners, stonecutters <strong>and</strong> carvers, paper <strong>and</strong> paperboard products makers, <strong>and</strong> other<br />
small categories.<br />
42 Packers, loaders <strong>and</strong> warehouse workers Workers in this category perform freight h<strong>and</strong>ling tasks, such as loading <strong>and</strong> unloading ship, aircraft <strong>and</strong><br />
train cargoes <strong>and</strong> other freight, wrapping objects, packing liquids, materials <strong>and</strong> objects in containers,<br />
affixing labels on containers, rigging cables, wires <strong>and</strong> ropes for lifting, hauling <strong>and</strong> other purposes, <strong>and</strong><br />
operating specialised vehicles to lift, move, dump <strong>and</strong> stack materials in warehouses.<br />
43 Engine <strong>and</strong> motor operator workers Includes stationary engine operators, crane <strong>and</strong> hoist operators, earth moving <strong>and</strong> related operators, truck<br />
drivers <strong>and</strong> motor vehicle operators.<br />
44 Public safety <strong>and</strong> protection workers Workers in this category protect individuals <strong>and</strong> property against hazards <strong>and</strong> enforce law <strong>and</strong> order.<br />
Fire-fighters, policemen <strong>and</strong> detectives, customs officers, guards, <strong>and</strong> watchmen are included.<br />
45 Cooks <strong>and</strong> stewards Workers in this category prepare <strong>and</strong> cook in hotels, restaurants, other public eating places, aboard ships,<br />
aeroplanes <strong>and</strong> on railway trains.<br />
46 Domestic assistants Domestic assistants clean rooms, wash dishes, do laundry <strong>and</strong> ironing, <strong>and</strong> perform additional domestic<br />
duties in private homes. They may also prepare food <strong>and</strong> serve meals.<br />
47 Waiters Includes waiters, bartenders <strong>and</strong> related workers who serve food <strong>and</strong> beverages in dining <strong>and</strong> drinking<br />
places, clubs, institutions <strong>and</strong> canteens, on board on ships <strong>and</strong> on railway trains.<br />
48 Building caretakers <strong>and</strong> cleaners Workers in this category take care of apartment houses, office buildings <strong>and</strong> other buildings <strong>and</strong> maintain<br />
them in an orderly <strong>and</strong> clean condition. Tasks may include operating furnaces or boilers to provide heat <strong>and</strong><br />
hot water for tenants.<br />
49 Chimney sweeps Chimney sweeps remove soot from flues, chimneys <strong>and</strong> connecting pipes, <strong>and</strong> may also clean furnaces <strong>and</strong><br />
boilers.<br />
50 Hairdressers Includes hairdressers, barbers, beauticians <strong>and</strong> others. Workers holding these<br />
occupations typically shampoo, cut <strong>and</strong> style hair <strong>and</strong> apply hair colorants, waving <strong>and</strong> straightening<br />
preparations <strong>and</strong> conditioners, or they give various beauty treatments to customers, apply make up to actors<br />
<strong>and</strong> other performers, <strong>and</strong> make wigs.<br />
51 Launders <strong>and</strong> dry-cleaners Workers in this category launder, dry clean <strong>and</strong> press clothing, textile fabrics <strong>and</strong> similar products.<br />
52 Military personnel Includes professional military personnel who lead, plan, organise <strong>and</strong> execute military work.<br />
53 Other economically active persons This category consists of all occupational titles not included in previous occupational categories (1 52)<br />
such as precision mechanic workers, athletes <strong>and</strong> sportsmen, photographers, bath attendants, <strong>and</strong> several<br />
subcategories of service workers.<br />
54 Economically inactive persons Includes housewives, early pensioners, students <strong>and</strong> persons on social support <strong>and</strong> was defined somewhat<br />
differently in the respective countries.
Acta Oncol Downloaded from informahealthcare.com by 212.35.100.66 on 04/06/11<br />
For personal use only.<br />
Appendix 3. Number of persons under follow-up by gender, country <strong>and</strong> occupational category.<br />
Men Women<br />
No <strong>Occupation</strong>al category Denmark Finl<strong>and</strong> Icel<strong>and</strong> Norway Sweden Total Denmark Finl<strong>and</strong> Icel<strong>and</strong> Norway Sweden Total<br />
1 Technical workers, etc 63 923 125 200 1 602 58 282 323 859 572 866 3 252 17 865 320 2 743 24 778 48 958<br />
2 Laboratory assistants 1 277 3 330 337 2 562 3 146 10 652 2 632 7 930 381 2 923 12 182 26 048<br />
3 Physicians 5 019 7 250 515 7 037 19 428 39 249 1 084 4 770 64 1 177 7 281 14 376<br />
4 Dentists 1 579 1 500 136 2 931 7 393 13 539 913 2 950 20 832 3 987 8 702<br />
5 Nurses 84 925 17 673 3 558 5 257 18 066 40 280 1 464 22 894 66 368 149 072<br />
6 Assistant nurses 1 564 990 203 1 101 9 527 13 385 13 965 32 880 2 351 22 749 131 030 202 975<br />
7 Other health workers 4 501 6 915 157 2 948 14 700 29 221 10 150 30 715 511 21 069 46 887 109 332<br />
8 Teachers 27 323 42 280 2 139 42 318 91 959 206 019 23 891 63 650 2 822 41 909 151 696 283 968<br />
9 Religious workers etc. 10 804 33 060 1 377 20 742 93 148 159 131 3 115 50 105 408 10 572 70 633 134 833<br />
10 Artistic workers 3 863 9 620 376 5 627 21 830 41 316 1 583 6 630 297 2 910 11 072 22 492<br />
11 Journalists 1 809 4 550 232 2 719 10 817 20 127 401 3 730 87 878 5 333 10 429<br />
12 Administrators 68 398 63 430 2 299 66 253 106 335 306 715 9 150 14 280 171 9 883 24 798 58 282<br />
13 Clerical workers 32 234 39 780 3 314 47 957 120 972 244 257 96 861 223 550 8 526 119 471 331 834 780 242<br />
14 Sales agents 17 294 62 545 1 499 55 942 191 288 328 568 819 28 075 656 14 171 43 817 87 538<br />
15 Shop workers 69 840 30 040 1 467 24 155 56 321 181 823 60 582 86 295 4 602 86 880 138 259 376 618<br />
16 Farmers 110 708 183 300 3 977 118 336 206 119 622 440 39 960 47 405 2 544 50 983 17 623 158 515<br />
17 Gardeners 16 927 34 885 153 30 359 87 080 169 404 5 214 110 620 104 29 805 32 178 177 921<br />
18 Fishermen 7 053 2 970 4 907 42 711 9 285 66 926 212 370 129 528 144 1 383<br />
19 Forestry workers 2 411 43 125 37 21 758 65 171 132 502 57 630 21 595 943 2 246<br />
20 Miners <strong>and</strong> quarry workers 866 7 560 75 7 761 18 830 35 092 5 220 2 50 265 542<br />
21 Seamen 8 936 10 230 1 001 42 936 18 637 81 740 175 2 117 93 387<br />
22 Transport workers 14 669 25 480 1 318 18 669 51 230 111 366 60 3 565 94 636 3 962 8 317<br />
23 Drivers 54 493 98 520 2 561 62 662 158 482 376 718 1 637 2 685 62 2 156 9 415 15 955<br />
24 Postal workers 9 871 15 835 287 11 671 36 898 74 562 3 159 25 840 1 277 21 634 46 214 98 124<br />
25 Textile workers 8 679 7 840 462 9 893 28 828 55 702 21 262 53 985 1 969 28 049 67 243 172 508<br />
26 Shoe <strong>and</strong> leather workers 2 177 3 435 94 4 365 10 822 20 893 1 617 6 590 112 2 018 5 182 15 519<br />
27 Smelting workers 22 510 13 370 738 15 974 51 794 104 386 413 1 505 7 372 2 603 4 900<br />
28 Mechanics 57 488 108 325 3 227 85 784 286 407 541 231 4 193 8 285 25 2 956 25 246 40 705<br />
29 Plumbers 5 379 17 990 446 10 624 31 593 66 032 26 30 27 77 160<br />
30 Welders 21 045 216 12 289 41 307 74 857 815 4 322 1 465 2 606<br />
31 Electrical workers 14 402 50 815 2 082 38 002 106 533 211 834 6 027 7 585 28 3 299 14 589 31 528<br />
32 Wood workers 36 525 88 585 1 485 81 152 161 084 368 831 1 819 12 435 53 1 208 4 747 20 262<br />
33 Painters 12 840 21 020 576 14 940 49 367 98 743 74 1 700 16 244 1 181 3 215<br />
34 Other construction workers 45 564 60 260 3 529 19 883 89 224 218 460 60 4 375 13 113 253 4 814<br />
35 Bricklayers 13 939 9 560 8 344 19 242 51 085 10 160 7 12 189<br />
36 Printers 9 422 12 065 528 10 551 30 730 63 296 2 129 8 395 246 2 921 9 513 23 204<br />
37 Chemical process workers 7 912 16 580 240 19 353 40 457 84 542 3 315 3 435 81 2 437 6 510 15 778<br />
38 Food workers 26 395 11 830 2 389 22 426 39 349 102 389 15 544 17 060 5 514 14 427 16 357 68 902<br />
39 Beverage workers 3 685 690 39 483 2 369 7 266 1 645 890 12 146 981 3 674<br />
40 Tobacco workers 515 125 1 349 219 1 209 2 228 490 527 681 3 926<br />
41 Glass makers etc 15 129 18 575 449 12 109 47 264 93 526 4 088 13 225 157 5 191 17 866 40 527<br />
42 Packers 13 702 34 510 1 312 34 542 82 644 166 710 1 104 22 555 447 12 056 25 559 61 721<br />
43 Engine operators 13 794 51 680 2 054 24 073 77 091 168 692 55 4 080 11 264 2 776 7 186<br />
44 Public safety workers 11 840 28 390 1 153 14 890 49 131 105 404 116 1 290 100 1 571 5 301 8 378<br />
45 Cooks <strong>and</strong> stewards 1 402 3 255 762 8 251 12 995 26 665 47 29 580 1 612 15 572 32 944 79 755<br />
46 Domestic assistants 21 105 3 101 2 817 3 047 23 058 39 600 410 43 499 141 608 248 175<br />
47 Waiters 3 109 3 385 105 3 382 6 153 16 134 4 685 26 355 252 18 911 31 635 81 838<br />
48 Building caretakers 13 531 22 215 357 8 656 41 670 86 429 68 253 90 070 3 151 82 850 107 640 351 964<br />
49 Chimney sweeps 402 1 635 798 2 663 5 498 3 40 9 7 59<br />
50 Hairdressers 3 756 575 89 2 236 7 070 13 726 4 422 10 950 359 5 202 18 946 39 879<br />
51 Launderers 1 765 525 35 1 275 5 144 8 744 7 434 5 910 416 6 254 14 738 34 752<br />
52 Military personnel 7 114 11 330 12 164 25 295 55 903 37 160 39 204 440<br />
53 Other workers 48 633 28 740 4 519 62 534 95 970 240 396 20 467 32 380 4 140 44 568 51 691 153 246<br />
54 Economically inactive 58 500 169 040 4 563 48 728 262 390 543 221 526 871 524 840 13 506 513 789 1 578 776 3 157 782<br />
1 54 All categories 995 576 1 670 815 61 439 1 286 261 3 433 635 7 447 726 1 017 770 1 733 985 59 556 1 276 413 3 367 123 7 454 847
Acta Oncol Downloaded from informahealthcare.com by 212.35.100.66 on 04/06/11<br />
For personal use only.<br />
Appendix 4. Number of persons-years under follow-up by gender, country <strong>and</strong> occupational category.<br />
Men Women<br />
No <strong>Occupation</strong>al category Denmark Finl<strong>and</strong> Icel<strong>and</strong> Norway Sweden Total Denmark Finl<strong>and</strong> Icel<strong>and</strong> Norway Sweden Total<br />
1 Technical workers, etc 1 663 926 2 799 854 33 438 1 649 937 8 623 953 14 771 108 89 989 372 034 6 098 70 847 587 599 1 126 567<br />
2 Laboratory assistants 32 649 75 314 6 577 72 724 76 088 263 352 75 277 183 900 7 660 76 156 253 033 596 026<br />
3 Physicians 126 160 162 581 10 153 190 548 451 235 940 677 29 220 96 460 1 079 32 107 156 523 315 389<br />
4 Dentists 41 424 32 745 2 928 82 288 191 711 351 096 25 359 69 478 408 24 513 95 588 215 346<br />
5 Nurses 2 227 17 426 273 16 266 65 233 101 425 506 142 939 978 30 031 586 421 1 634 590 3 697 162<br />
6 Assistant nurses 41 585 17 680 3 143 30 017 198 190 290 615 394 624 825 747 44 403 556 157 3 141 692 4 962 623<br />
7 Other health workers 112 266 146 714 3 152 76 412 358 743 697 287 284 500 711 985 10 140 546 370 1 104 254 2 657 249<br />
8 Teachers 736 534 1 032 453 42 626 1 159 719 2 431 830 5 403 162 688 370 1 527 302 57 138 1 127 220 3 768 901 7 168 931<br />
9 Religious workers etc. 268 220 701 707 27 933 554 313 2 147 538 3 699 711 87 720 1 022 158 8 154 273 265 1 523 172 2 914 469<br />
10 Artistic workers 89 878 213 900 7 323 154 342 548 749 1 014 192 41 705 143 247 6 113 78 007 255 811 524 883<br />
11 Journalists 43 909 100 836 4 509 73 435 265 940 488 629 10 654 85 487 1 688 22 801 123 512 244 142<br />
12 Administrators 1 684 513 1 468 028 46 847 1 783 590 2 796 834 7 779 812 246 049 300 554 3 602 250 639 566 971 1 367 815<br />
13 Clerical workers 806 624 910 310 64 602 1 364 682 3 249 702 6 395 920 2 735 026 5 253 298 168 140 3 249 608 8 795 690 20 201 762<br />
14 Sales agents 433 719 1 419 569 29 721 1 506 381 4 915 784 8 305 174 22 319 649 464 13 535 374 164 1 081 182 2 140 664<br />
15 Shop workers 1 682 959 693 310 27 707 675 880 1 561 773 4 641 629 1 672 882 2 303 414 91 977 2 321 296 4 178 833 10 568 402<br />
16 Farmers 2 803 855 4 285 694 80 628 3 248 218 5 670 523 16 088 918 1 150 794 1 081 805 53 644 1 335 746 428 524 4 050 513<br />
17 Gardeners 411 413 839 790 2 944 887 573 2 425 675 4 567 395 147 391 3 161 766 2 006 797 358 1 016 036 5 124 557<br />
18 Fishermen 170 809 65 437 94 090 1 170 043 251 330 1 751 709 6 098 8 852 2 675 12 397 3 824 33 846<br />
19 Forestry workers 58 022 1 012 022 702 616 252 1 782 062 3 469 060 1 585 16 970 368 15 793 26 233 60 949<br />
20 Miners <strong>and</strong> quarry workers 19 595 171 230 1 396 212 147 496 253 900 621 132 5 862 38 1 190 7 130 14 352<br />
21 Seamen 209 956 237 934 19 024 1 182 959 470 783 2 120 656 3 422 33 3 066 1 574 8 095<br />
22 Transport workers 364 831 600 801 25 921 542 046 1 470 917 3 004 516 1 706 95 132 1 998 16 582 90 447 205 865<br />
23 Drivers 1 331 245 2 325 417 50 595 1 718 031 4 223 821 9 649 109 45 120 63 297 1 304 52 862 234 619 397 202<br />
24 Postal workers 265 932 350 794 5 305 307 643 916 029 1 845 703 86 381 664 664 26 132 594 429 1 330 388 2 701 994<br />
25 Textile workers 203 247 187 807 8 917 282 178 773 107 1 455 256 581 940 1 429 164 40 352 803 882 2 078 758 4 934 096<br />
26 Shoe <strong>and</strong> leather workers 47 764 79 813 1 758 114 419 276 043 519 797 44 162 177 196 2 351 59 168 163 332 446 209<br />
27 Smelting workers 546 418 311 992 14 220 433 504 1 352 019 2 658 153 11 068 40 505 116 8 772 65 722 126 183<br />
28 Mechanics 1 408 520 2 443 311 61 463 2 377 508 7 532 862 13 823 664 115 394 209 040 534 80 511 634 412 1 039 891<br />
29 Plumbers 133 998 413 640 8 761 291 864 853 787 1 702 050 681 650 634 1 547 3 512<br />
30 Welders 473 825 4 140 347 752 1 088 629 1 914 346 19 619 88 7 819 32 238 59 764<br />
31 Electrical workers 365 336 1 128 116 40 601 1 065 532 2 817 110 5 416 695 164 107 173 099 476 90 967 366 090 794 739<br />
32 Wood workers 903 946 1 998 181 28 168 2 302 125 4 204 345 9 436 765 50 474 339 752 960 29 688 115 278 536 152<br />
33 Painters 314 621 475 904 10 998 399 519 1 283 477 2 484 519 2 072 44 522 297 6 448 28 685 82 024<br />
34 Other construction workers 1 055 827 1 333 336 68 419 526 046 2 309 207 5 292 835 1 523 119 258 221 2 602 5 285 128 889<br />
35 Bricklayers 339 984 210 204 232 123 525 089 1 307 400 272 4 700 142 205 5 319<br />
36 Printers 236 307 275 698 10 495 282 002 805 745 1 610 247 57 703 204 060 4 800 78 730 248 536 593 829<br />
37 Chemical process workers 183 233 386 649 4 494 512 664 1 024 040 2 111 080 88 202 91 651 1 609 67 536 179 345 428 343<br />
38 Food workers 633 652 276 424 42 914 605 654 1 052 983 2 611 627 427 167 462 184 108 187 387 797 469 086 1 854 421<br />
39 Beverage workers 80 452 16 084 706 12 075 57 477 166 794 41 554 24 171 215 3 753 27 918 97 611<br />
40 Tobacco workers 10 785 3 107 23 8 614 5 521 28 050 58 263 13 738 14 698 21 078 107 777<br />
41 Glass makers etc 355 624 418 341 8 142 328 662 1 205 626 2 316 395 112 144 347 919 3 071 145 652 487 998 1 096 784<br />
42 Packers 307 393 774 051 23 791 907 527 2 062 599 4 075 361 30 286 604 822 8 871 327 070 700 503 1 671 552<br />
43 Engine operators 343 842 1 207 674 39 870 649 479 2 026 586 4 267 451 1 413 104 999 203 6 352 67 174 180 141<br />
44 Public safety workers 297 658 643 632 22 362 402 482 1 265 497 2 631 631 2 917 28 690 1 923 36 407 106 389 176 326<br />
45 Cooks <strong>and</strong> stewards 30 469 62 241 14 623 215 813 281 309 604 455 1 149 715 813 32 181 416 345 894 354 2 059 842<br />
46 Domestic assistants 383 2 126 45 2 248 48 690 53 492 637 574 886 118 8 104 1 123 678 3 304 447 5 959 921<br />
47 Waiters 62 189 63 542 1 955 86 340 140 283 354 309 121 783 659 908 4 722 506 116 941 957 2 234 486<br />
48 Building caretakers 307 602 487 667 6 483 214 505 913 865 1 930 122 1 846 118 2 262 749 65 238 2 083 749 2 806 552 9 064 406<br />
49 Chimney sweeps 9 641 36 454 21 370 70 121 137 586 96 1 133 243 165 1 637<br />
50 Hairdressers 87 135 11 692 1 804 59 221 192 801 352 653 125 197 261 140 6 989 148 581 517 679 1 059 586<br />
51 Launderers 41 028 11 835 576 33 953 139 678 227 070 202 008 159 350 8 608 169 320 443 427 982 713<br />
52 Military personnel 187 460 266 456 377 966 706 458 1 538 340 987 3 860 858 4 088 9 793<br />
53 Other workers 1 066 918 604 369 85 766 1 611 030 2 437 681 5 805 764 543 215 780 566 80 720 1 146 544 1 322 516 3 873 561<br />
54 Economically inactive 897 264 2 741 222 80 084 959 903 4 881 084 9 559 557 13 430 302 12 964 766 266 457 14 276 412 47 657 779 88 595 716<br />
1 54 All categories 23 860 947 37 026 939 1 183 115 34 939 524 87 924 415 184 934 940 27 048 814 42 721 418 1 185 657 34 449 468 94 098 669 199 504 026
Acta Oncol Downloaded from informahealthcare.com by 212.35.100.66 on 04/06/11<br />
For personal use only.<br />
Appendix 5. Number of new <strong>cancer</strong> cases during the follow-up period, by country. Men.<br />
ICD-7 Site Denmark Finl<strong>and</strong> Icel<strong>and</strong> Norway Sweden Total<br />
140 Lip 2 645 3 231 45 2 996 5 560 14 477<br />
141 Tongue 873 1 001 23 1 201 2 329 5 427<br />
142 Salivary gl<strong>and</strong>s 542 597 18 553 1 642 3 352<br />
143 144 Oral cavity 1 740 1 011 31 1 712 3 395 7 889<br />
145 148 Pharynx 2 073 1 281 35 1 993 4 999 10 381<br />
145 -oropharynx 1 148 506 10 760 1 956 4 380<br />
146 -nasopharynx 312 263 10 358 1 037 1 980<br />
150 Oesophagus 4 283 3 121 141 3 388 8 644 19 577<br />
-adenocarcinoma 1<br />
1 705 705 54 691 2 309 5 464<br />
151 Stomach 9 637 14 687 424 19 346 35 291 79 385<br />
151.1 -cardia 2 872 2 505 79 3 246 4 319 13 021<br />
152 Small intestine 744 888 45 976 3 570 6 223<br />
153 Colon 21 627 12 158 590 25 584 48 497 108 456<br />
154 Rectum, rectosigma 15 156 10 067 216 15 629 33 586 74 654<br />
155 Primary liver 3 206 3 613 68 1 951 8 892 17 730<br />
-hemangiosarcoma 1<br />
15 3 41 59<br />
155.1 Gall bladder 1 753 1 935 35 1 441 3 397 8 561<br />
157 Pancreas 7 993 8 962 219 9 672 20 099 46 945<br />
160 Nose 747 520 21 770 1 465 3 523<br />
-adenocarcinoma 1<br />
35 2 103 246 386<br />
161 Larynx 4 787 3 462 85 3 529 6 625 18 488<br />
162,163 Lung 53 401 52 189 996 37 334 64 377 208 297<br />
-adenocarcinoma 1<br />
10 390 6 855 283 6 933 12 168 36 629<br />
-small cell 1<br />
8 050 198 6 246 5 705 20 199<br />
-squamous cell 1<br />
18 324 16 355 238 11 603 23 634 70 154<br />
-other 1<br />
20 929 254 8 792 22 870 52 845<br />
158, 162.2 Mesothelioma 1<br />
1 365 1 046 23 1 062 2 521 6 017<br />
170 Breast 486 294 27 402 1 127 2 336<br />
177 Prostate 34 794 57 652 2 050 64 778 180 699 339 973<br />
178 Testis 1 618 814 81 1 851 3 155 7 519<br />
-seminoma 1<br />
672 560 59 1 289 2 255 4 835<br />
-non-seminoma 1<br />
953 242 22 410 900 2 527<br />
179 Penis 966 432 28 990 2 252 4 668<br />
180 Kidney 6 375 9 716 373 9 491 24 389 50 344<br />
-renal pelvis 1<br />
2 491 608 21 1 089 2 526 6 735<br />
181 Bladder 27 063 13 716 565 22 272 47 885 111 501<br />
190 Melanoma 5 516 6 585 157 9 471 19 529 41 258<br />
190.6 -upper limbs 658 839 23 862 2 872 5 254<br />
192 Eye 678 658 16 792 1 858 4 002<br />
-melanoma 1<br />
595 593 13 697 1 509 3 407<br />
193 Brain 6 434 6 511 229 6 891 17 706 37 771<br />
-glioma 1<br />
685 2 965 136 3 524 8 923 16 233<br />
-meningeoma 1<br />
817 1 344 56 1 117 3 775 7 109<br />
194 Thyroid 577 1 512 130 1 295 2 973 6 487<br />
-follicular 1<br />
262 20 153 142 577<br />
-papillary 1<br />
902 95 670 403 2 070<br />
195 Other endocrine organs 244 377 48 248 528 1 445<br />
195 -gl<strong>and</strong>ula suprarenalis 147 280 6 159 327 919<br />
195.1 -parathyreioeda 8 4 1 5 23 41<br />
195.2 -thymus 69 74 4 68 139 354<br />
195.3 -hypophysis 20 6 37 13 39 115<br />
195.4 -corpus pineale 13 3 16<br />
196 Bone 242 421 19 388 981 2 051<br />
-chondrosarcoma 1<br />
214 17 105 433 769<br />
197 Connective tissue 867 1 512 43 1 168 4 607 8 197<br />
-fibrosarcoma 1<br />
526 111 691 1 328<br />
-liposarcoma 1<br />
328 14 190 794 1 326<br />
200,202 Non-Hodgkin lymphoma 6 129 8 558 253 6 391 20 330 41 661<br />
201 Hodgkin’s lymphoma 977 1 288 31 1 240 3 291 6 827<br />
203 Multiple myeloma 3 543 3 139 108 5 010 10 306 22 106<br />
204 Leukaemia 7 537 5 689 188 7 033 15 735 36 182<br />
-chronic lymphatic 1<br />
2 466 64 2 563 7 224 12 317<br />
-acute myeloid 1<br />
2 150 1 567 61 2 516 3 403 9 697<br />
191 or 205 Mycosis fungoides 1<br />
210 221 10 189 1 486 2 116<br />
199 Other/Unknown 3 237 5 007 148 10 624 20 317 39 333<br />
191 Non melanoma skin 7 122 223 12 547 30 398 50 290<br />
191.6 -upper limbs 546 20 1 092 3 250 4 908<br />
1 Based on both primary site <strong>and</strong> codes for histology/morphology <strong>and</strong>/or behavioural code.
Acta Oncol Downloaded from informahealthcare.com by 212.35.100.66 on 04/06/11<br />
For personal use only.<br />
Appendix 6. Number of new <strong>cancer</strong> cases during the follow-up period, by country. Women.<br />
ICD-7 Site Denmark Finl<strong>and</strong> Icel<strong>and</strong> Norway Sweden Total<br />
93 140 Lip 394 868 7 454 1 285 3 008<br />
141 Tongue 530 839 17 668 1 539 3 593<br />
142 Salivary gl<strong>and</strong>s 442 596 11 465 1 571 3 085<br />
143 144 Oral cavity 1 230 863 38 1 098 2 330 5 559<br />
145 148 Pharynx 841 548 15 675 1 934 4 013<br />
145 -oropharynx 485 194 7 277 812 1 775<br />
146 -nasopharynx 137 147 8 139 487 918<br />
150 Oesophagus 1 703 2 355 49 1 245 3 369 8 721<br />
-adenocarcinoma 1<br />
418 199 14 198 552 1 381<br />
151 Stomach 5 391 11 160 209 11 851 21 201 49 812<br />
151.1 -cardia 861 1 056 18 1 364 1 337 4 636<br />
152 Small intestine 666 800 28 980 2 933 5 407<br />
153 Colon 24 822 15 390 460 29 285 52 355 122 312<br />
154 Rectum, rectosigma 10 969 9 229 179 12 487 26 721 59 585<br />
155 Primary liver 1 921 2 486 33 1 200 5 335 10 975<br />
-hemangiosarcoma 1<br />
16 2 4 35 57<br />
155.1 Gall bladder 2 967 4 471 44 2 336 9 219 19037<br />
157 Pancreas 7 943 9 498 170 8 855 18 902 45 368<br />
160 Nose 469 396 19 483 909 2 276<br />
-adenocarcinoma 1<br />
25 47 69 141<br />
161 Larynx 1 022 337 16 429 874 2 678<br />
162,163 Lung 26 248 11 299 867 14 017 29 412 81 843<br />
-adenocarcinoma 1<br />
8 056 2 987 306 4 197 9 807 25 353<br />
-small cell 1<br />
1 826 141 2 747 3 662 8 376<br />
-squamous cell 1<br />
4 961 1 802 138 2 202 5 564 14 667<br />
-other 1<br />
4 684 280 3 861 10 379 19 204<br />
158, 162.2 Mesothelioma 1<br />
393 425 2 180 548 1 548<br />
170 Breast 62 191 73 754 2 162 62 999 172 255 373 361<br />
-ductual 1<br />
52 353 1 688 40 518 40 346 134 905<br />
-lobular 1<br />
8 515 181 3 611 9 189 21 496<br />
171 Cervix uteri 11 008 4 816 202 10 712 21 510 48 248<br />
172 Corpus uteri 15 623 16 741 387 14 533 40 333 87 617<br />
173 Choriocarcinoma 10 28 1 25 63 127<br />
175 Ovary 13 159 11 538 314 14 814 39 839 79 664<br />
175.1 Fallopian tubes 384 571 9 358 884 2 206<br />
176 Vulva 1 324 1 570 31 2 453 4 375 9 753<br />
176.1 Vagina 547 411 9 463 1 295 2 725<br />
180 Kidney 4 820 7 474 216 6 151 16 957 35 618<br />
-renal pelvis 1<br />
1 743 387 19 654 1 703 4 506<br />
181 Bladder 8 605 4 282 183 7 532 16 622 37 224<br />
190 Melanoma 6 758 6 464 199 9 916 19 303 42 640<br />
190.6 -upper limbs 1 226 1 140 32 1 655 3 794 7 847<br />
192 Eye 594 700 9 737 1 691 3 731<br />
-melanoma 1<br />
536 648 7 642 1 369 3 202<br />
193 Brain 7 269 9 328 271 7 451 20 214 44 533<br />
-glioma 1<br />
590 2 478 99 2 513 6 789 12 469<br />
-meningeoma 1<br />
1 737 3 942 140 2 604 8 484 16 907<br />
194 Thyroid 1 194 5 082 232 3 189 7 064 16 761<br />
-follicular 1<br />
726 28 447 294 1 495<br />
-papillary 1<br />
3 618 188 1 746 1 087 6 639<br />
Other endocrine organs 222 361 31 213 595 1 422<br />
195 -gl<strong>and</strong>ula suprarenalis 135 234 5 134 337 845<br />
195.1 -parathyreioeda 11 7 15 85 118<br />
195.2 -thymus 61 88 44 133 326<br />
195.3 -hypophysis 15 8 26 12 40 101<br />
195.4 -corpus pineale 24 8 32<br />
196 Bone 192 319 16 287 804 1 618<br />
-chondrosarcoma 1<br />
144 10 83 348 585<br />
197 Connective tissue 739 1 573 29 1 014 4 125 7 480<br />
-fibrosarcoma 1<br />
483 2 82 607 1 174<br />
-liposarcoma 1<br />
327 7 129 613 1 076<br />
200,202 Non-Hodgkin lymphoma 5 779 8 868 174 5 905 17 033 37 759<br />
201 Hodgkin’s lymphoma 598 893 19 795 2 230 4 535<br />
203 Multiple myeloma 2 955 3 552 90 4 359 8 552 19 508<br />
204 Leukaemia 5 671 4 982 147 5 420 11 596 27 816<br />
-chronic lymphatic 1<br />
1 798 48 1 771 4 528 8 145<br />
-acute myeloid 1<br />
1 903 1 665 59 2 130 3 357 9 114<br />
191 or 205 Mycosis fungoides 1<br />
116 127 4 102 1 169 1 518<br />
199 Other/ Unknown 4 051 6 617 188 11 384 24 704 46 944<br />
Ovary, borderline 1<br />
2 121 117 1 860 4 987 9 085<br />
191 Non-melanoma skin 7 359 189 9 266 20 515 37 329<br />
191.6 -upper limbs 547 24 938 2 375 3 884<br />
1 Based on both primary site <strong>and</strong> codes for histology/morphology <strong>and</strong>/or behavioural code.
Acta Oncol Downloaded from informahealthcare.com by 212.35.100.66 on 04/06/11<br />
For personal use only.<br />
Table of contents: <strong>Occupation</strong> <strong>and</strong> <strong>cancer</strong> follow-up of 15<br />
million people in five Nordic countries<br />
Section Page<br />
Abstract 646<br />
Introduction 647<br />
The Nordic countries 648<br />
Climate 649<br />
Population 649<br />
Culture 650<br />
Industry 650<br />
Living conditions 651<br />
Food consumption 651<br />
Alcohol consumption 652<br />
Tobacco use 652<br />
Health <strong>and</strong> health care 653<br />
<strong>Occupation</strong>al history of the study population 654<br />
Materials <strong>and</strong> methods 656<br />
Study population 656<br />
Economic activity 656<br />
<strong>Occupation</strong> 656<br />
Follow-up for <strong>cancer</strong> incidence 657<br />
Combined <strong>cancer</strong> incidence 657<br />
St<strong>and</strong>ardised incidence ratio 658<br />
Method of presentation 658<br />
RESULTS: <strong>cancer</strong> incidence by <strong>cancer</strong> site 658<br />
Lip <strong>cancer</strong> 658<br />
Tongue <strong>cancer</strong> 659<br />
Cancer of the salivary gl<strong>and</strong>s 662<br />
Cancer of the oral cavity 662<br />
Pharyngeal <strong>cancer</strong> 667<br />
Oesophageal <strong>cancer</strong> 672<br />
Stomach <strong>cancer</strong> 672<br />
Small intestine 673<br />
Colon <strong>cancer</strong> 678<br />
Rectal <strong>cancer</strong> 678<br />
Liver <strong>cancer</strong> 681<br />
Cancer of the gallbladder <strong>and</strong> biliary tract 686<br />
Cancer of the pancreas 691<br />
Cancer of the nose <strong>and</strong> nasal sinuses 691<br />
Laryngeal <strong>cancer</strong> 694<br />
Lung <strong>cancer</strong> 699<br />
Mesothelioma in pleura/peritoneum 703<br />
Breast Cancer 703<br />
Cervical <strong>cancer</strong> 706<br />
Corpus uteri-endometrial <strong>cancer</strong> 708<br />
Choriocarcinoma 708<br />
Ovarian <strong>cancer</strong> 712<br />
Fallopian tube <strong>cancer</strong>s 712<br />
Table of contents: (Continued)<br />
Section Page<br />
Cancer of the vulva 715<br />
Vaginal <strong>cancer</strong> 715<br />
Prostate <strong>cancer</strong> 715<br />
Testicular <strong>cancer</strong> 718<br />
Penile <strong>cancer</strong> 721<br />
Cancer of kidney <strong>and</strong> renal pelvis 721<br />
Bladder <strong>cancer</strong> 723<br />
Skin melanoma 728<br />
Non-melanoma skin <strong>cancer</strong> 729<br />
Eye <strong>cancer</strong> 734<br />
Brain <strong>cancer</strong> 735<br />
Thyroid <strong>cancer</strong> 740<br />
Cancers of other endocrine gl<strong>and</strong>s 743<br />
Gl<strong>and</strong>ula suprarenalis 743<br />
Gl<strong>and</strong>ula parathyrioeda 743<br />
Thymus 743<br />
Hypophysis 743<br />
Corpus pineale 743<br />
Bone <strong>cancer</strong> 743<br />
Soft tissue <strong>cancer</strong> 744<br />
Non-Hodgkin lymphoma 749<br />
Hodgkin lymphoma 752<br />
Multiple myeloma 752<br />
Leukaemia 757<br />
Mycosis fungoides 760<br />
Other <strong>and</strong> unknown <strong>cancer</strong> sites 760<br />
All <strong>cancer</strong> sites combined 760<br />
Discussion 765<br />
Validity of census occupation 765<br />
<strong>Occupation</strong>al mobility 768<br />
Validity of <strong>cancer</strong> incidence data 770<br />
Accuracy of linkage <strong>and</strong> person-year calculation 771<br />
Statistical significance 771<br />
Selection of reference rates 771<br />
General life style factors 772<br />
<strong>Occupation</strong> <strong>and</strong> tobacco smoking 772<br />
<strong>Occupation</strong> <strong>and</strong> alcohol consumption 776<br />
<strong>Occupation</strong> <strong>and</strong> dietary habits 776<br />
<strong>Occupation</strong>, body fatness <strong>and</strong> physical activity 778<br />
<strong>Occupation</strong> <strong>and</strong> reproductive pattern 778<br />
Socially discriminating <strong>cancer</strong>s 779<br />
Economic inactive persons 782<br />
Conclusions 783<br />
References 784<br />
Appendix tables 791