Occupation and cancer - European Trade Union Institute (ETUI)
Occupation and cancer - European Trade Union Institute (ETUI)
Occupation and cancer - European Trade Union Institute (ETUI)

You also want an ePaper? Increase the reach of your titles
YUMPU automatically turns print PDFs into web optimized ePapers that Google loves.
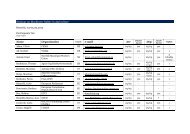
Acta Oncol Downloaded from informahealthcare.com by 212.35.100.66 on 04/06/11<br />
For personal use only.<br />
Tons<br />
20<br />
15<br />
10<br />
5<br />
0<br />
Denmark Finl<strong>and</strong> Icel<strong>and</strong><br />
Norway Sweden<br />
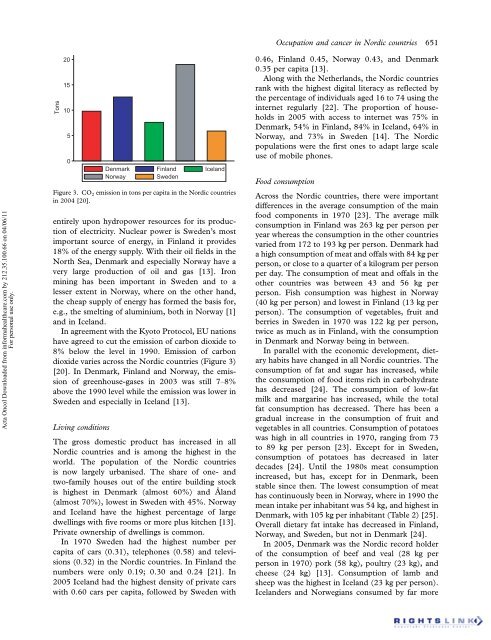
Figure 3. CO 2 emission in tons per capita in the Nordic countries<br />
in 2004 [20].<br />
entirely upon hydropower resources for its production<br />
of electricity. Nuclear power is Sweden’s most<br />
important source of energy, in Finl<strong>and</strong> it provides<br />
18% of the energy supply. With their oil fields in the<br />
North Sea, Denmark <strong>and</strong> especially Norway have a<br />
very large production of oil <strong>and</strong> gas [13]. Iron<br />
mining has been important in Sweden <strong>and</strong> to a<br />
lesser extent in Norway, where on the other h<strong>and</strong>,<br />
the cheap supply of energy has formed the basis for,<br />
e.g., the smelting of aluminium, both in Norway [1]<br />
<strong>and</strong> in Icel<strong>and</strong>.<br />
In agreement with the Kyoto Protocol, EU nations<br />
have agreed to cut the emission of carbon dioxide to<br />
8% below the level in 1990. Emission of carbon<br />
dioxide varies across the Nordic countries (Figure 3)<br />
[20]. In Denmark, Finl<strong>and</strong> <strong>and</strong> Norway, the emission<br />
of greenhouse-gases in 2003 was still 7 8%<br />
above the 1990 level while the emission was lower in<br />
Sweden <strong>and</strong> especially in Icel<strong>and</strong> [13].<br />
Living conditions<br />
The gross domestic product has increased in all<br />
Nordic countries <strong>and</strong> is among the highest in the<br />
world. The population of the Nordic countries<br />
is now largely urbanised. The share of one- <strong>and</strong><br />
two-family houses out of the entire building stock<br />
is highest in Denmark (almost 60%) <strong>and</strong> A˚ l<strong>and</strong><br />
(almost 70%), lowest in Sweden with 45%. Norway<br />
<strong>and</strong> Icel<strong>and</strong> have the highest percentage of large<br />
dwellings with five rooms or more plus kitchen [13].<br />
Private ownership of dwellings is common.<br />
In 1970 Sweden had the highest number per<br />
capita of cars (0.31), telephones (0.58) <strong>and</strong> televisions<br />
(0.32) in the Nordic countries. In Finl<strong>and</strong> the<br />
numbers were only 0.19; 0.30 <strong>and</strong> 0.24 [21]. In<br />
2005 Icel<strong>and</strong> had the highest density of private cars<br />
with 0.60 cars per capita, followed by Sweden with<br />
<strong>Occupation</strong> <strong>and</strong> <strong>cancer</strong> in Nordic countries 651<br />
0.46, Finl<strong>and</strong> 0.45, Norway 0.43, <strong>and</strong> Denmark<br />
0.35 per capita [13].<br />
Along with the Netherl<strong>and</strong>s, the Nordic countries<br />
rank with the highest digital literacy as reflected by<br />
the percentage of individuals aged 16 to 74 using the<br />
internet regularly [22]. The proportion of households<br />
in 2005 with access to internet was 75% in<br />
Denmark, 54% in Finl<strong>and</strong>, 84% in Icel<strong>and</strong>, 64% in<br />
Norway, <strong>and</strong> 73% in Sweden [14]. The Nordic<br />
populations were the first ones to adapt large scale<br />
use of mobile phones.<br />
Food consumption<br />
Across the Nordic countries, there were important<br />
differences in the average consumption of the main<br />
food components in 1970 [23]. The average milk<br />
consumption in Finl<strong>and</strong> was 263 kg per person per<br />
year whereas the consumption in the other countries<br />
varied from 172 to 193 kg per person. Denmark had<br />
a high consumption of meat <strong>and</strong> offals with 84 kg per<br />
person, or close to a quarter of a kilogram per person<br />
per day. The consumption of meat <strong>and</strong> offals in the<br />
other countries was between 43 <strong>and</strong> 56 kg per<br />
person. Fish consumption was highest in Norway<br />
(40 kg per person) <strong>and</strong> lowest in Finl<strong>and</strong> (13 kg per<br />
person). The consumption of vegetables, fruit <strong>and</strong><br />
berries in Sweden in 1970 was 122 kg per person,<br />
twice as much as in Finl<strong>and</strong>, with the consumption<br />
in Denmark <strong>and</strong> Norway being in between.<br />
In parallel with the economic development, dietary<br />
habits have changed in all Nordic countries. The<br />
consumption of fat <strong>and</strong> sugar has increased, while<br />
the consumption of food items rich in carbohydrate<br />
has decreased [24]. The consumption of low-fat<br />
milk <strong>and</strong> margarine has increased, while the total<br />
fat consumption has decreased. There has been a<br />
gradual increase in the consumption of fruit <strong>and</strong><br />
vegetables in all countries. Consumption of potatoes<br />
was high in all countries in 1970, ranging from 73<br />
to 89 kg per person [23]. Except for in Sweden,<br />
consumption of potatoes has decreased in later<br />
decades [24]. Until the 1980s meat consumption<br />
increased, but has, except for in Denmark, been<br />
stable since then. The lowest consumption of meat<br />
has continuously been in Norway, where in 1990 the<br />
mean intake per inhabitant was 54 kg, <strong>and</strong> highest in<br />
Denmark, with 105 kg per inhabitant (Table 2) [25].<br />
Overall dietary fat intake has decreased in Finl<strong>and</strong>,<br />
Norway, <strong>and</strong> Sweden, but not in Denmark [24].<br />
In 2005, Denmark was the Nordic record holder<br />
of the consumption of beef <strong>and</strong> veal (28 kg per<br />
person in 1970) pork (58 kg), poultry (23 kg), <strong>and</strong><br />
cheese (24 kg) [13]. Consumption of lamb <strong>and</strong><br />
sheep was the highest in Icel<strong>and</strong> (23 kg per person).<br />
Icel<strong>and</strong>ers <strong>and</strong> Norwegians consumed by far more