Occupation and cancer - European Trade Union Institute (ETUI)
Occupation and cancer - European Trade Union Institute (ETUI)
Occupation and cancer - European Trade Union Institute (ETUI)

You also want an ePaper? Increase the reach of your titles
YUMPU automatically turns print PDFs into web optimized ePapers that Google loves.
Acta Oncol Downloaded from informahealthcare.com by 212.35.100.66 on 04/06/11<br />
For personal use only.<br />
774 E. Pukkala et al.<br />
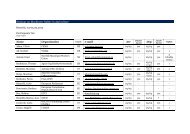
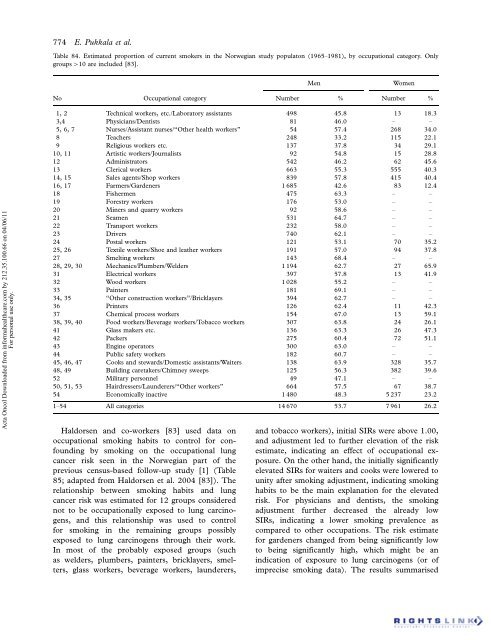
Table 84. Estimated proportion of current smokers in the Norwegian study populaton (1965 1981), by occupational category. Only<br />
groups 10 are included [83].<br />
Haldorsen <strong>and</strong> co-workers [83] used data on<br />
occupational smoking habits to control for confounding<br />
by smoking on the occupational lung<br />
<strong>cancer</strong> risk seen in the Norwegian part of the<br />
previous census-based follow-up study [1] (Table<br />
85; adapted from Haldorsen et al. 2004 [83]). The<br />
relationship between smoking habits <strong>and</strong> lung<br />
<strong>cancer</strong> risk was estimated for 12 groups considered<br />
not to be occupationally exposed to lung carcinogens,<br />
<strong>and</strong> this relationship was used to control<br />
for smoking in the remaining groups possibly<br />
exposed to lung carcinogens through their work.<br />
In most of the probably exposed groups (such<br />
as welders, plumbers, painters, bricklayers, smelters,<br />
glass workers, beverage workers, launderers,<br />
Men Women<br />
No <strong>Occupation</strong>al category Number % Number %<br />
1, 2 Technical workers, etc./Laboratory assistants 498 45.8 13 18.3<br />
3,4 Physicians/Dentists 81 46.0<br />
5, 6, 7 Nurses/Assistant nurses/‘‘Other health workers’’ 54 57.4 268 34.0<br />
8 Teachers 248 33.2 115 22.1<br />
9 Religious workers etc. 137 37.8 34 29.1<br />
10, 11 Artistic workers/Journalists 92 54.8 15 28.8<br />
12 Administrators 542 46.2 62 45.6<br />
13 Clerical workers 663 55.3 555 40.3<br />
14, 15 Sales agents/Shop workers 839 57.8 415 40.4<br />
16, 17 Farmers/Gardeners 1 685 42.6 83 12.4<br />
18 Fishermen 475 63.3<br />
19 Forestry workers 176 53.0<br />
20 Miners <strong>and</strong> quarry workers 92 58.6<br />
21 Seamen 531 64.7<br />
22 Transport workers 232 58.0<br />
23 Drivers 740 62.1<br />
24 Postal workers 121 53.1 70 35.2<br />
25, 26 Textile workers/Shoe <strong>and</strong> leather workers 191 57.0 94 37.8<br />
27 Smelting workers 143 68.4<br />
28, 29, 30 Mechanics/Plumbers/Welders 1 194 62.7 27 65.9<br />
31 Electrical workers 397 57.8 13 41.9<br />
32 Wood workers 1 028 55.2<br />
33 Painters 181 69.1<br />
34, 35 ‘‘Other construction workers’’/Bricklayers 394 62.7<br />
36 Printers 126 62.4 11 42.3<br />
37 Chemical process workers 154 67.0 13 59.1<br />
38, 39, 40 Food workers/Beverage workers/Tobacco workers 307 63.8 24 26.1<br />
41 Glass makers etc. 136 63.3 26 47.3<br />
42 Packers 275 60.4 72 51.1<br />
43 Engine operators 300 63.0<br />
44 Public safety workers 182 60.7<br />
45, 46, 47 Cooks <strong>and</strong> stewards/Domestic assistants/Waiters 138 63.9 328 35.7<br />
48, 49 Building caretakers/Chimney sweeps 125 56.3 382 39.6<br />
52 Military personnel 49 47.1<br />
50, 51, 53 Hairdressers/Launderers/‘‘Other workers’’ 664 57.5 67 38.7<br />
54 Economically inactive 1 480 48.3 5 237 23.2<br />
1 54 All categories 14 670 53.7 7 961 26.2<br />
<strong>and</strong> tobacco workers), initial SIRs were above 1.00,<br />
<strong>and</strong> adjustment led to further elevation of the risk<br />
estimate, indicating an effect of occupational exposure.<br />
On the other h<strong>and</strong>, the initially significantly<br />
elevated SIRs for waiters <strong>and</strong> cooks were lowered to<br />
unity after smoking adjustment, indicating smoking<br />
habits to be the main explanation for the elevated<br />
risk. For physicians <strong>and</strong> dentists, the smoking<br />
adjustment further decreased the already low<br />
SIRs, indicating a lower smoking prevalence as<br />
compared to other occupations. The risk estimate<br />
for gardeners changed from being significantly low<br />
to being significantly high, which might be an<br />
indication of exposure to lung carcinogens (or of<br />
imprecise smoking data). The results summarised