Occupation and cancer - European Trade Union Institute (ETUI)
Occupation and cancer - European Trade Union Institute (ETUI)
Occupation and cancer - European Trade Union Institute (ETUI)

Create successful ePaper yourself
Turn your PDF publications into a flip-book with our unique Google optimized e-Paper software.
Acta Oncol Downloaded from informahealthcare.com by 212.35.100.66 on 04/06/11<br />
For personal use only.<br />
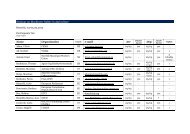
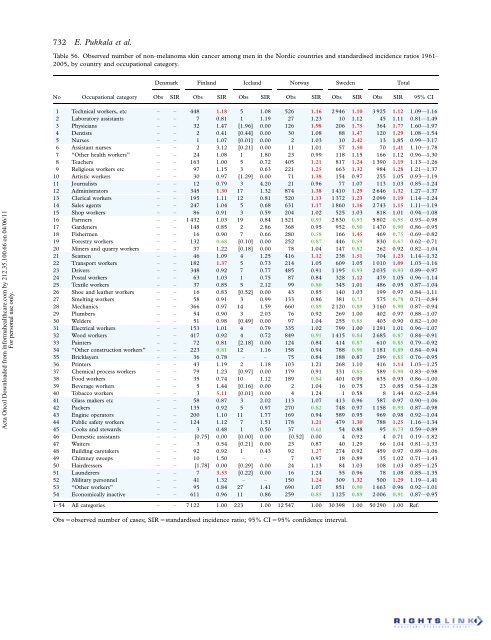
732 E. Pukkala et al.<br />
Table 56. Observed number of non melanoma skin <strong>cancer</strong> among men in the Nordic countries <strong>and</strong> st<strong>and</strong>ardised incidence ratios 1961<br />
2005, by country <strong>and</strong> occupational category.<br />
Denmark Finl<strong>and</strong> Icel<strong>and</strong> Norway Sweden Total<br />
No <strong>Occupation</strong>al category Obs SIR Obs SIR Obs SIR Obs SIR Obs SIR Obs SIR 95% CI<br />
1 Technical workers, etc 448 1.18 5 1.08 526 1.16 2946 1.10 3925 1.12 1.09*1.16<br />
2 Laboratory assistants 7 0.81 1 1.19 27 1.23 10 1.12 45 1.11 0.81*1.49<br />
3 Physicians 32 1.47 [1.96] 0.00 126 1.98 206 1.75 364 1.77 1.60*1.97<br />
4 Dentists 2 0.41 [0.44] 0.00 30 1.08 88 1.47 120 1.29 1.08*1.54<br />
5 Nurses 1 1.07 [0.01] 0.00 2 1.03 10 2.42 13 1.85 0.99*3.17<br />
6 Assistant nurses 2 3.12 [0.21] 0.00 11 1.01 57 1.50 70 1.41 1.10*1.78<br />
7 ‘‘Other health workers’’ 24 1.08 1 1.80 23 0.99 118 1.15 166 1.12 0.96*1.30<br />
8 Teachers 163 1.00 5 0.72 405 1.21 817 1.24 1390 1.19 1.13*1.26<br />
9 Religious workers etc 97 1.15 3 0.63 221 1.25 663 1.32 984 1.28 1.21*1.37<br />
10 Artistic workers 30 0.97 [1.29] 0.00 71 1.38 154 0.97 255 1.05 0.93*1.19<br />
11 Journalists 12 0.79 3 4.20 21 0.96 77 1.07 113 1.03 0.85*1.24<br />
12 Administrators 345 1.30 17 1.32 874 1.38 1410 1.29 2646 1.32 1.27*1.37<br />
13 Clerical workers 195 1.11 12 0.81 520 1.13 1372 1.23 2099 1.19 1.14*1.24<br />
14 Sales agents 247 1.04 5 0.68 631 1.17 1860 1.16 2743 1.15 1.11*1.19<br />
15 Shop workers 86 0.91 3 0.59 204 1.02 525 1.03 818 1.01 0.94*1.08<br />
16 Farmers 1 432 1.03 19 0.84 1 521 0.93 2830 0.93 5802 0.95 0.93*0.98<br />
17 Gardeners 148 0.85 2 2.86 368 0.95 952 0.90 1470 0.90 0.86*0.95<br />
18 Fishermen 16 0.90 7 0.66 280 0.58 166 1.45 469 0.75 0.69*0.82<br />
19 Forestry workers 132 0.68 [0.10] 0.00 252 0.87 446 0.59 830 0.67 0.62*0.71<br />
20 Miners <strong>and</strong> quarry workers 37 1.22 [0.18] 0.00 78 1.04 147 0.82 262 0.92 0.82*1.04<br />
21 Seamen 46 1.09 4 1.25 416 1.12 238 1.51 704 1.23 1.14*1.32<br />
22 Transport workers 182 1.37 5 0.73 214 1.05 609 1.05 1 010 1.09 1.03*1.16<br />
23 Drivers 348 0.92 7 0.77 485 0.91 1 195 0.93 2035 0.93 0.89*0.97<br />
24 Postal workers 63 1.03 1 0.75 87 0.84 328 1.12 479 1.05 0.96*1.14<br />
25 Textile workers 37 0.85 5 2.12 99 0.80 345 1.01 486 0.95 0.87*1.04<br />
26 Shoe <strong>and</strong> leather workers 16 0.83 [0.52] 0.00 43 0.85 140 1.03 199 0.97 0.84*1.11<br />
27 Smelting workers 58 0.91 3 0.99 133 0.86 381 0.73 575 0.78 0.71*0.84<br />
28 Mechanics 366 0.97 14 1.59 660 0.89 2120 0.89 3160 0.90 0.87*0.94<br />
29 Plumbers 54 0.90 3 2.03 76 0.92 269 1.00 402 0.97 0.88*1.07<br />
30 Welders 51 0.98 [0.49] 0.00 97 1.04 255 0.85 403 0.90 0.82*1.00<br />
31 Electrical workers 153 1.01 4 0.79 335 1.02 799 1.00 1 291 1.01 0.96*1.07<br />
32 Wood workers 417 0.92 4 0.72 849 0.91 1415 0.84 2685 0.87 0.84*0.91<br />
33 Painters 72 0.81 [2.18] 0.00 124 0.84 414 0.87 610 0.85 0.79*0.92<br />
34 ‘‘Other construction workers’’ 223 0.81 12 1.16 158 0.94 788 0.90 1181 0.89 0.84*0.94<br />
35 Bricklayers 36 0.78 75 0.84 188 0.87 299 0.85 0.76*0.95<br />
36 Printers 43 1.19 2 1.18 103 1.21 268 1.10 416 1.14 1.03*1.25<br />
37 Chemical process workers 79 1.23 [0.97] 0.00 179 0.91 331 0.85 589 0.90 0.83*0.98<br />
38 Food workers 35 0.74 10 1.12 189 0.84 401 0.99 635 0.93 0.86*1.00<br />
39 Beverage workers 5 1.44 [0.16] 0.00 2 1.04 16 0.75 23 0.85 0.54*1.28<br />
40 Tobacco workers 3 5.11 [0.01] 0.00 4 1.24 1 0.58 8 1.44 0.62*2.84<br />
41 Glass makers etc 58 0.87 3 2.02 113 1.07 413 0.96 587 0.97 0.90*1.06<br />
42 Packers 135 0.92 5 0.97 270 0.82 748 0.97 1 158 0.93 0.87*0.98<br />
43 Engine operators 200 1.10 11 1.77 169 0.94 589 0.95 969 0.98 0.92*1.04<br />
44 Public safety workers 124 1.12 7 1.51 178 1.21 479 1.30 788 1.25 1.16*1.34<br />
45 Cooks <strong>and</strong> stewards 3 0.48 1 0.50 37 0.61 54 0.88 95 0.73 0.59*0.89<br />
46 Domestic assistants [0.75] 0.00 [0.00] 0.00 [0.52] 0.00 4 0.92 4 0.71 0.19*1.82<br />
47 Waiters 3 0.54 [0.21] 0.00 23 0.87 40 1.29 66 1.04 0.81*1.33<br />
48 Building caretakers 92 0.92 1 0.43 92 1.27 274 0.92 459 0.97 0.89*1.06<br />
49 Chimney sweeps 10 1.50 7 0.97 18 0.89 35 1.02 0.71*1.43<br />
50 Hairdressers [1.78] 0.00 [0.29] 0.00 24 1.13 84 1.03 108 1.03 0.85*1.25<br />
51 Launderers 7 3.53 [0.22] 0.00 16 1.24 55 0.96 78 1.08 0.85*1.35<br />
52 Military personnel 41 1.32 150 1.24 309 1.32 500 1.29 1.19*1.41<br />
53 ‘‘Other workers’’ 95 0.84 27 1.41 690 1.07 851 0.90 1 663 0.96 0.92*1.01<br />
54 Economically inactive 611 0.96 11 0.86 259 0.85 1125 0.89 2006 0.91 0.87*0.95<br />
1 54 All categories 7 122 1.00 223 1.00 12 547 1.00 30 398 1.00 50 290 1.00 Ref.<br />
Obs observed number of cases; SIR st<strong>and</strong>ardised incidence ratio; 95% CI 95% confidence interval.