Occupation and cancer - European Trade Union Institute (ETUI)
Occupation and cancer - European Trade Union Institute (ETUI)
Occupation and cancer - European Trade Union Institute (ETUI)

You also want an ePaper? Increase the reach of your titles
YUMPU automatically turns print PDFs into web optimized ePapers that Google loves.
Acta Oncol Downloaded from informahealthcare.com by 212.35.100.66 on 04/06/11<br />
For personal use only.<br />
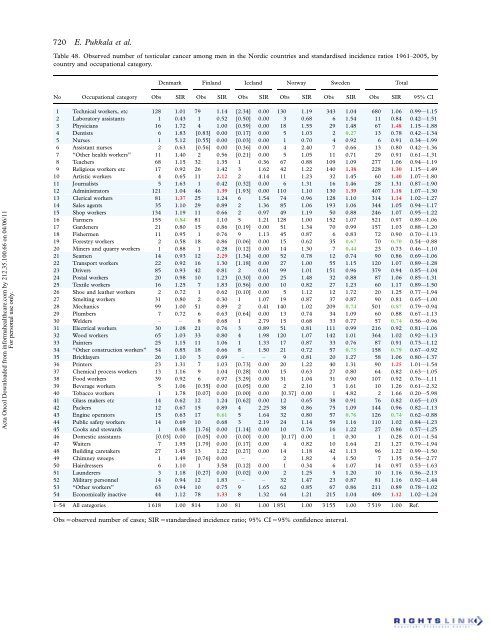
720 E. Pukkala et al.<br />
Table 48. Observed number of testicular <strong>cancer</strong> among men in the Nordic countries <strong>and</strong> st<strong>and</strong>ardised incidence ratios 1961 2005, by<br />
country <strong>and</strong> occupational category.<br />
Denmark Finl<strong>and</strong> Icel<strong>and</strong> Norway Sweden Total<br />
No <strong>Occupation</strong>al category Obs SIR Obs SIR Obs SIR Obs SIR Obs SIR Obs SIR 95% CI<br />
1 Technical workers, etc 128 1.01 79 1.14 [2.34] 0.00 130 1.19 343 1.04 680 1.06 0.99*1.15<br />
2 Laboratory assistants 1 0.43 1 0.52 [0.50] 0.00 3 0.68 6 1.54 11 0.84 0.42*1.51<br />
3 Physicians 16 1.72 4 1.00 [0.59] 0.00 18 1.55 29 1.48 67 1.48 1.15*1.88<br />
4 Dentists 6 1.83 [0.83] 0.00 [0.17] 0.00 5 1.03 2 0.27 13 0.78 0.42*1.34<br />
5 Nurses 1 5.12 [0.55] 0.00 [0.03] 0.00 1 0.70 4 0.92 6 0.91 0.34*1.99<br />
6 Assistant nurses 2 0.63 [0.56] 0.00 [0.36] 0.00 4 2.40 7 0.66 13 0.80 0.42*1.36<br />
7 ‘‘Other health workers’’ 11 1.40 2 0.56 [0.21] 0.00 5 1.05 11 0.71 29 0.91 0.61*1.31<br />
8 Teachers 68 1.15 32 1.35 1 0.36 67 0.88 109 1.09 277 1.06 0.94*1.19<br />
9 Religious workers etc 17 0.92 26 1.42 3 1.62 42 1.22 140 1.38 228 1.30 1.15*1.49<br />
10 Artistic workers 4 0.65 11 2.12 2 4.14 11 1.23 32 1.45 60 1.40 1.07*1.80<br />
11 Journalists 5 1.63 1 0.42 [0.32] 0.00 6 1.31 16 1.46 28 1.31 0.87*1.90<br />
12 Administrators 121 1.04 46 1.39 [1.93] 0.00 110 1.10 130 1.39 407 1.18 1.07*1.30<br />
13 Clerical workers 81 1.37 25 1.24 6 1.54 74 0.96 128 1.10 314 1.14 1.02*1.27<br />
14 Sales agents 35 1.10 29 0.89 2 1.36 85 1.06 193 1.06 344 1.05 0.94*1.17<br />
15 Shop workers 134 1.19 11 0.66 2 0.97 49 1.19 50 0.88 246 1.07 0.95*1.22<br />
16 Farmers 155 0.84 81 1.10 5 1.21 128 1.00 152 1.07 521 0.97 0.89*1.06<br />
17 Gardeners 21 0.80 15 0.86 [0.19] 0.00 51 1.34 70 0.99 157 1.03 0.88*1.20<br />
18 Fishermen 11 0.95 1 0.76 9 1.13 45 0.87 6 0.83 72 0.90 0.70*1.13<br />
19 Forestry workers 2 0.58 18 0.86 [0.06] 0.00 15 0.62 35 0.67 70 0.70 0.54*0.88<br />
20 Miners <strong>and</strong> quarry workers 1 0.88 1 0.28 [0.12] 0.00 14 1.30 7 0.44 23 0.73 0.46*1.10<br />
21 Seamen 14 0.93 12 2.29 [1.34] 0.00 52 0.78 12 0.74 90 0.86 0.69*1.06<br />
22 Transport workers 22 0.92 16 1.30 [1.18] 0.00 27 1.00 55 1.15 120 1.07 0.89*1.28<br />
23 Drivers 85 0.93 42 0.81 2 0.61 99 1.01 151 0.96 379 0.94 0.85*1.04<br />
24 Postal workers 20 0.98 10 1.23 [0.30] 0.00 25 1.48 32 0.88 87 1.06 0.85*1.31<br />
25 Textile workers 16 1.25 7 1.83 [0.56] 0.00 10 0.82 27 1.23 60 1.17 0.89*1.50<br />
26 Shoe <strong>and</strong> leather workers 2 0.72 1 0.62 [0.10] 0.00 5 1.12 12 1.72 20 1.25 0.77*1.94<br />
27 Smelting workers 31 0.80 2 0.30 1 1.07 19 0.87 37 0.87 90 0.81 0.65*1.00<br />
28 Mechanics 99 1.00 51 0.89 2 0.41 140 1.02 209 0.74 501 0.87 0.79*0.94<br />
29 Plumbers 7 0.72 6 0.63 [0.64] 0.00 13 0.74 34 1.09 60 0.88 0.67*1.13<br />
30 Welders 8 0.68 1 2.79 15 0.68 33 0.77 57 0.74 0.56*0.96<br />
31 Electrical workers 30 1.08 21 0.76 3 0.89 51 0.81 111 0.99 216 0.92 0.81*1.06<br />
32 Wood workers 65 1.03 33 0.80 4 1.98 120 1.07 142 1.01 364 1.02 0.92*1.13<br />
33 Painters 25 1.15 11 1.06 1 1.33 17 0.87 33 0.76 87 0.91 0.73*1.12<br />
34 ‘‘Other construction workers’’ 54 0.85 18 0.66 8 1.50 21 0.72 57 0.75 158 0.79 0.67*0.92<br />
35 Bricklayers 26 1.10 3 0.69 9 0.81 20 1.27 58 1.06 0.80*1.37<br />
36 Printers 23 1.31 7 1.03 [0.73] 0.00 20 1.22 40 1.31 90 1.25 1.01*1.54<br />
37 Chemical process workers 13 1.16 9 1.04 [0.28] 0.00 15 0.63 27 0.80 64 0.82 0.63*1.05<br />
38 Food workers 39 0.92 6 0.97 [3.29] 0.00 31 1.04 31 0.90 107 0.92 0.76*1.11<br />
39 Beverage workers 5 1.06 [0.35] 0.00 [0.05] 0.00 2 2.10 3 1.61 10 1.26 0.61*2.32<br />
40 Tobacco workers 1 1.78 [0.07] 0.00 [0.00] 0.00 [0.37] 0.00 1 4.82 2 1.66 0.20*5.98<br />
41 Glass makers etc 14 0.62 12 1.24 [0.62] 0.00 12 0.65 38 0.91 76 0.82 0.65*1.03<br />
42 Packers 12 0.67 15 0.89 4 2.25 38 0.86 75 1.09 144 0.96 0.82*1.13<br />
43 Engine operators 15 0.63 17 0.61 5 1.64 32 0.80 57 0.76 126 0.74 0.62*0.88<br />
44 Public safety workers 14 0.69 10 0.68 3 2.19 24 1.14 59 1.16 110 1.02 0.84*1.23<br />
45 Cooks <strong>and</strong> stewards 1 0.48 [1.76] 0.00 [1.14] 0.00 10 0.76 16 1.22 27 0.86 0.57*1.25<br />
46 Domestic assistants [0.03] 0.00 [0.05] 0.00 [0.00] 0.00 [0.17] 0.00 1 0.30 1 0.28 0.01*1.54<br />
47 Waiters 7 1.95 [1.79] 0.00 [0.17] 0.00 4 0.82 10 1.64 21 1.27 0.79*1.94<br />
48 Building caretakers 27 1.45 13 1.22 [0.27] 0.00 14 1.18 42 1.13 96 1.22 0.99*1.50<br />
49 Chimney sweeps 1 1.49 [0.76] 0.00 2 1.82 4 1.50 7 1.35 0.54*2.77<br />
50 Hairdressers 6 1.10 1 3.58 [0.12] 0.00 1 0.34 6 1.07 14 0.97 0.53*1.63<br />
51 Launderers 3 1.18 [0.27] 0.00 [0.02] 0.00 2 1.25 5 1.20 10 1.16 0.56*2.13<br />
52 Military personnel 14 0.94 12 1.83 32 1.47 23 0.87 81 1.16 0.92*1.44<br />
53 ‘‘Other workers’’ 63 0.94 10 0.75 9 1.65 62 0.85 67 0.86 211 0.89 0.78*1.02<br />
54 Economically inactive 44 1.12 78 1.33 8 1.32 64 1.21 215 1.04 409 1.12 1.02*1.24<br />
1 54 All categories 1 618 1.00 814 1.00 81 1.00 1 851 1.00 3 155 1.00 7 519 1.00 Ref.<br />
Obs observed number of cases; SIR st<strong>and</strong>ardised incidence ratio; 95% CI 95% confidence interval.