

technology, energy efficiency and environmental externalities in the ...
technology, energy efficiency and environmental externalities in the ...
technology, energy efficiency and environmental externalities in the ...

You also want an ePaper? Increase the reach of your titles
YUMPU automatically turns print PDFs into web optimized ePapers that Google loves.
TECHNOLOGY, ENERGY EFFICIENCY<br />
AND ENVIRONMENTAL EXTERNALITIES<br />
IN THE CEMENT INDUSTRY<br />
School of Environment, Resources <strong>and</strong> Development<br />
Asian Institute of Technology<br />
Bangkok - Thail<strong>and</strong><br />
ASIAN INSTITUTE<br />
OF TEC HN OLOGY<br />
19 5 9
TECHNOLOGY, ENERGY<br />
EFFICIENCY AND<br />
ENVIRONMENTAL EXTERNALITIES<br />
IN THE CEMENT INDUSTRY<br />
Raw Materials<br />
Preparation<br />
Cl<strong>in</strong>ker Production<br />
- Dry Process √<br />
- Wet Process<br />
- Semi-wet Process<br />
- Semi-dry Process<br />
F<strong>in</strong>ish<strong>in</strong>g<br />
Stack<br />
(650°C)<br />
Flue<br />
gases<br />
Flue<br />
gases<br />
To<br />
Stack<br />
Stack<br />
(350°C)<br />
Heated Air<br />
(250°C)<br />
Exhaust<br />
(250°C)<br />
Energy Flow<br />
Raw Materials<br />
(Limestone, Alum<strong>in</strong>a, Iron oxide,<br />
o<strong>the</strong>r m<strong>in</strong>or constituents, etc.<br />
Limestone usually m<strong>in</strong>ed on site)<br />
Crush<strong>in</strong>g & Preblend<strong>in</strong>g<br />
Screen<strong>in</strong>g & Mill<strong>in</strong>g<br />
Proportion<strong>in</strong>g &<br />
Blend<strong>in</strong>g<br />
Dry<strong>in</strong>g<br />
Screen<strong>in</strong>g & Mill<strong>in</strong>g<br />
Burn<strong>in</strong>g <strong>in</strong> <strong>the</strong> Kiln<br />
Cl<strong>in</strong>ker Cool<strong>in</strong>g<br />
70°C<br />
Mix<strong>in</strong>g with gypsum <strong>and</strong><br />
F<strong>in</strong>ish gr<strong>in</strong>d<strong>in</strong>g<br />
Packag<strong>in</strong>g <strong>and</strong> Shipp<strong>in</strong>g<br />
F<strong>in</strong>ished Packaged<br />
Cement<br />
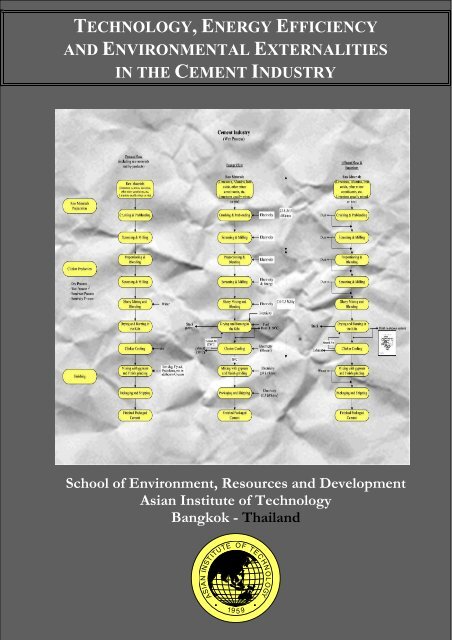
Cement Industry<br />
(Dry Process)<br />
Electricity<br />
Electricity<br />
Electricity<br />
Electricity &<br />
Energy (Fuel)<br />
Electricity<br />
Electricity<br />
Energy (Fuel)<br />
(3-4MJ/kg)<br />
Dust (1150°C)<br />
Electricity<br />
(Blower)<br />
Electricity<br />
(30 kWh/ton)<br />
Electricity<br />
(1.5 kWh/ton)<br />
23.5-34.5<br />
kWh/ton<br />
23-30 kWh/ton<br />
3-4MJ/kg<br />
To<br />
Stack<br />
Brahman<strong>and</strong> Mohanty<br />
Flue<br />
gases<br />
To<br />
Stack<br />
Flue<br />
gases<br />
To<br />
Stack<br />
Dust<br />
Dust<br />
Dust<br />
Dust<br />
Exhaust<br />
Waste<br />
Heated<br />
Air<br />
Effluent Flow &<br />
Emissions<br />
Raw Materials<br />
(Limestone, Alum<strong>in</strong>a, Iron oxide,<br />
o<strong>the</strong>r m<strong>in</strong>or constituents, etc.<br />
Limestone usually m<strong>in</strong>ed on site)<br />
Crush<strong>in</strong>g & Preblend<strong>in</strong>g<br />
Screen<strong>in</strong>g & Mill<strong>in</strong>g<br />
Proportion<strong>in</strong>g &<br />
Blend<strong>in</strong>g<br />
Dry<strong>in</strong>g<br />
Screen<strong>in</strong>g & Mill<strong>in</strong>g<br />
Burn<strong>in</strong>g <strong>in</strong> <strong>the</strong> Kiln<br />
Cl<strong>in</strong>ker Cool<strong>in</strong>g<br />
Mix<strong>in</strong>g with gypsum <strong>and</strong><br />
F<strong>in</strong>ish gr<strong>in</strong>d<strong>in</strong>g<br />
Packag<strong>in</strong>g <strong>and</strong> Shipp<strong>in</strong>g<br />
F<strong>in</strong>ished Packaged<br />
Cement<br />
School of Environment, Resources <strong>and</strong> Development<br />
Asian Institute of Technology<br />
Bangkok - Thail<strong>and</strong><br />
Dust (to disposal system)<br />
* The dotted l<strong>in</strong>e represents Wet Process only
Technology, Energy Efficiency <strong>and</strong> Environmental Externalities<br />
<strong>in</strong> <strong>the</strong> Pulp <strong>and</strong> Paper Industry<br />
© Asian Institute of Technology, 1997<br />
Edited by Brahman<strong>and</strong> Mohanty<br />
Published by School of Environment, Resources <strong>and</strong> Development<br />
Asian Institute of Technology<br />
P.O. Box 4, Pathumthani 12120<br />
Thail<strong>and</strong><br />
e-mail: visu@ait.ac.th<br />
NOTICE<br />
Nei<strong>the</strong>r <strong>the</strong> Swedish International Development Cooperation Agency (Sida) nor <strong>the</strong> Asian<br />
Institute of Technology (AIT) makes any warranty, expressed or implied, or assume any legal<br />
liability for <strong>the</strong> accuracy, completeness, or usefulness of any <strong>in</strong>formation, appratus, product,<br />
or represents that its use would not <strong>in</strong>fr<strong>in</strong>ge privately owned rights. Reference here<strong>in</strong> to any<br />
trademark, or manufacturer, or o<strong>the</strong>rwise does not constitute or imply its endorsement,<br />
recommendation, or favor<strong>in</strong>g by Sida or AIT.<br />
ISBN 974 - 8256 – 70--7<br />
Pr<strong>in</strong>ted <strong>in</strong> India by All India Press, Pondicherry.
FOREWORD<br />
The use of fossil fuels leads to <strong>the</strong> emission of so-called "Green House Gases (GHG)", a<br />
concept which comprises carbon dioxide, nitrous oxides, sulfur oxides, etc. In recent years, a<br />
good deal of research has provided enough material to put forward <strong>the</strong> claim that a big<br />
<strong>in</strong>crease <strong>in</strong> <strong>the</strong> concentration of carbon dioxide <strong>in</strong> <strong>the</strong> atmosphere would lead to a rise <strong>in</strong> <strong>the</strong><br />
average global temperature, with negative consequences for <strong>the</strong> global climate. This claim<br />
has been confirmed by <strong>the</strong> United Nations Intergovernmental Panel on Climate Change<br />
(IPCC) <strong>in</strong> its second scientific assessment published <strong>in</strong> 1996.<br />
Global warm<strong>in</strong>g can have catastrophic impact on human <strong>and</strong> global security: isl<strong>and</strong> nations<br />
<strong>and</strong> low ly<strong>in</strong>g coastal regions would be permanently drowned by <strong>the</strong> rise <strong>in</strong> <strong>the</strong> level of <strong>the</strong><br />
oceans brought on by <strong>the</strong> melt<strong>in</strong>g of polar ice; drought would become widespread; <strong>and</strong><br />
desertification would exp<strong>and</strong> <strong>and</strong> accelerate. Persistent fam<strong>in</strong>es, mass migrations <strong>and</strong> largescale<br />
conflict would be <strong>the</strong> result. Agriculture, food <strong>and</strong> water security, <strong>and</strong> <strong>in</strong>ternational<br />
trade would come under severe stra<strong>in</strong>.<br />
Until recently, <strong>in</strong>dustrialized countries have accounted for most of <strong>the</strong> emission of <strong>the</strong><br />
GHG, <strong>in</strong> particular carbon dioxide, because <strong>the</strong>ir economic development has been very<br />
strongly based on <strong>the</strong> use of fossil fuels. However, <strong>the</strong> same dynamic has also led to a<br />
situation where <strong>the</strong> newly <strong>in</strong>dustrializ<strong>in</strong>g countries of Asia <strong>and</strong> Lat<strong>in</strong> America (<strong>the</strong> strong<br />
South) are today contribut<strong>in</strong>g significantly to <strong>the</strong> emission of carbon dioxide. This tendency<br />
will spread to <strong>and</strong> encompass an <strong>in</strong>creas<strong>in</strong>g number of develop<strong>in</strong>g countries unless both <strong>the</strong><br />
<strong>in</strong>dustrialized <strong>and</strong> <strong>the</strong> develop<strong>in</strong>g countries jo<strong>in</strong>tly agree on implement<strong>in</strong>g <strong>the</strong> measures to<br />
halt <strong>and</strong> <strong>the</strong>n reverse <strong>the</strong> global trend towards a rapid rise <strong>in</strong> <strong>the</strong> emission of carbon dioxide.<br />
That is <strong>the</strong> central purpose of <strong>the</strong> IPCC, which has succeeded <strong>in</strong> obta<strong>in</strong><strong>in</strong>g commitments<br />
from most of <strong>the</strong> <strong>in</strong>dustrialized countries to reduce <strong>the</strong>ir emissions of carbon dioxide.<br />
At <strong>the</strong> 1995 meet<strong>in</strong>g <strong>in</strong> Berl<strong>in</strong> of <strong>the</strong> Conference of <strong>the</strong> Parties (CoP) to <strong>the</strong> United Nations<br />
Climate Convention, it was decided to <strong>in</strong>itiate negotiations to streng<strong>the</strong>n <strong>the</strong> emissionreduction<br />
measures by <strong>the</strong> <strong>in</strong>dustrialized countries, as well as countries of Eastern Europe<br />
<strong>and</strong> <strong>the</strong> Former Soviet Union. The f<strong>in</strong>al negotiations are planned to take place at <strong>the</strong><br />
December 1997 meet<strong>in</strong>g <strong>in</strong> Kyoto of <strong>the</strong> CoP, which ought to result <strong>in</strong> legal <strong>in</strong>struments to<br />
ensure that <strong>the</strong> agreed measures are be<strong>in</strong>g fulfilled.<br />
The fossil fuel generated climate problem is very complex, with strong vested <strong>in</strong>terests <strong>and</strong><br />
special alliances. There is still considerable skepticism <strong>in</strong> <strong>the</strong> develop<strong>in</strong>g world about <strong>the</strong><br />
need for measures to counter global warm<strong>in</strong>g, <strong>in</strong> particular <strong>in</strong> <strong>the</strong> strong South, which <strong>in</strong> no<br />
way wants to jeopardize its own rapid economic development. It is <strong>the</strong>refore imperative to<br />
f<strong>in</strong>d <strong>in</strong>novative solutions, both technical <strong>and</strong> <strong>in</strong>stitutional, to <strong>the</strong> climate problem, which are
acceptable to both <strong>the</strong> North <strong>and</strong> <strong>the</strong> South. Meet<strong>in</strong>g this challenge calls for <strong>in</strong>ter alia<br />
research programs that tackle <strong>the</strong> technological, techno-economic <strong>and</strong> policy problems <strong>in</strong><br />
promot<strong>in</strong>g <strong>the</strong> transition to decreas<strong>in</strong>g use of fossil fuels, <strong>in</strong>creas<strong>in</strong>g <strong>energy</strong> <strong>efficiency</strong> <strong>and</strong><br />
fuel substitution, <strong>and</strong> carbon recycl<strong>in</strong>g systems of <strong>energy</strong> production <strong>and</strong> use.<br />
The Asian Regional Research Programme on Energy, Environment <strong>and</strong> Climate<br />
(ARRPEEC) is part of this global effort, which Sida is very pleased to have <strong>in</strong>itiated <strong>and</strong> is<br />
fully support<strong>in</strong>g. The ARRPEEC comprises technological, techno-economic <strong>and</strong> policy<br />
research on <strong>energy</strong> <strong>efficiency</strong>, fuel substitution <strong>and</strong> carbon recycl<strong>in</strong>g <strong>in</strong> <strong>the</strong> pr<strong>in</strong>cipal<br />
economic sectors of East, Sou<strong>the</strong>ast <strong>and</strong> South Asian countries.<br />
M R Bhagavan<br />
Senior Research Adviser, Department for Research Cooperation<br />
Swedish International Development Cooperation Agency, Sida
PREFACE<br />
Industries have always played a crucial role <strong>in</strong> <strong>the</strong> socio-economic development of a country.<br />
They have contributed primarily to <strong>in</strong>creased prosperity, greater employment <strong>and</strong> livelihood<br />
opportunities. On <strong>the</strong> o<strong>the</strong>r h<strong>and</strong>, <strong>in</strong>dustries are accused of accelerat<strong>in</strong>g <strong>the</strong> consumption of<br />
scarce fossil fuels <strong>and</strong> of pollut<strong>in</strong>g <strong>the</strong> local, regional, <strong>and</strong> global environment by releas<strong>in</strong>g<br />
solid, liquid <strong>and</strong> gaseous pollutants to <strong>the</strong>ir surround<strong>in</strong>gs.<br />
Experiences ga<strong>in</strong>ed worldwide have shown that <strong>the</strong>se impacts of <strong>in</strong>dustries on resource use<br />
<strong>and</strong> <strong>the</strong> environment can be conta<strong>in</strong>ed through more efficient production processes <strong>and</strong><br />
adoption of cleaner technologies <strong>and</strong> procedures. Thus, fossil fuel consumption can be cut<br />
down drastically <strong>and</strong> waste generation can be avoided or m<strong>in</strong>imized to <strong>the</strong> lowest possible<br />
level. Regulatory regimes <strong>in</strong>troduced <strong>in</strong> several countries have led <strong>the</strong> <strong>in</strong>dustries to adopt<br />
appropriate measures. Some countries have adopted economic <strong>in</strong>struments to reflect <strong>the</strong> true<br />
cost of goods <strong>and</strong> services by <strong>in</strong>ternaliz<strong>in</strong>g <strong>the</strong> <strong>environmental</strong> costs of <strong>the</strong>ir <strong>in</strong>put,<br />
production, use, recycl<strong>in</strong>g <strong>and</strong> disposal.<br />
The improvement of production system through <strong>the</strong> use of technologies <strong>and</strong> processes that<br />
utilize resources more efficiently <strong>and</strong> achieve “more with less” is an important pathway<br />
towards <strong>the</strong> long-term sustenance of <strong>in</strong>dustries. It is <strong>in</strong> this context that a research project<br />
was undertaken by <strong>the</strong> Asian Institute of Technology (AIT), with <strong>the</strong> support of <strong>the</strong> Swedish<br />
International Development Cooperation Agency (Sida). The project entitled “Development<br />
of Energy Efficient <strong>and</strong> Environmentally Sound Industrial Technologies <strong>in</strong> Asia” was<br />
launched with <strong>the</strong> specific objective to enhance <strong>the</strong> synergy among selected Asian<br />
develop<strong>in</strong>g countries <strong>in</strong> <strong>the</strong>ir efforts to grasp <strong>the</strong> mechanism <strong>and</strong> various aspects related to<br />
<strong>the</strong> adoption <strong>and</strong> propagation of <strong>energy</strong> efficient <strong>and</strong> <strong>environmental</strong>ly sound technologies.<br />
Three <strong>energy</strong> <strong>in</strong>tensive <strong>and</strong> <strong>environmental</strong>ly pollut<strong>in</strong>g <strong>in</strong>dustrial sub-sectors (cement, iron &<br />
steel, <strong>and</strong> pulp & paper) <strong>and</strong> four Asian countries of vary<strong>in</strong>g sizes, political systems <strong>and</strong><br />
stages of development (Ch<strong>in</strong>a, India, Philipp<strong>in</strong>es, Sri Lanka) were selected <strong>in</strong> <strong>the</strong> framework<br />
of this study. To enhance <strong>in</strong>-country capacity build<strong>in</strong>g <strong>in</strong> <strong>the</strong> subject matter, collaboration<br />
was sought from reputed national <strong>in</strong>stitutes who nom<strong>in</strong>ated experts to actively participate <strong>in</strong><br />
<strong>the</strong> execution of <strong>the</strong> project.<br />
The activities undertaken <strong>in</strong> <strong>the</strong> first phase of <strong>the</strong> project were <strong>the</strong> follow<strong>in</strong>g:<br />
- Evaluation of <strong>the</strong> status of technologies <strong>in</strong> selected <strong>energy</strong> <strong>in</strong>tensive <strong>and</strong><br />
<strong>environmental</strong>ly pollut<strong>in</strong>g <strong>in</strong>dustries;<br />
- Identification of potential areas for <strong>energy</strong> conservation <strong>and</strong> pollution abatement <strong>in</strong><br />
<strong>the</strong>se <strong>in</strong>dustries;<br />
- Analysis of <strong>the</strong> technological development of <strong>energy</strong> <strong>in</strong>tensive <strong>and</strong> pollut<strong>in</strong>g<br />
<strong>in</strong>dustries <strong>in</strong> relation with <strong>the</strong> national regulatory measures;<br />
- Identification of major barriers to <strong>efficiency</strong> improvements <strong>and</strong> pollution<br />
abatement <strong>in</strong> <strong>the</strong> <strong>in</strong>dustrial sector.<br />
Based on <strong>the</strong> <strong>in</strong>itial guidel<strong>in</strong>es prepared at AIT under <strong>the</strong> leadership of Dr. X. Chen,<br />
discussions were held with <strong>the</strong> experts from <strong>the</strong> national research <strong>in</strong>stitutes (NRIs) of <strong>the</strong><br />
four participat<strong>in</strong>g countries. The outcomes of <strong>the</strong>se meet<strong>in</strong>gs were used as a basis for <strong>the</strong><br />
preparation of country reports which were presented at two project workshops held at
Manila <strong>in</strong> May 1995 <strong>and</strong> at Bangkok <strong>in</strong> November 1995. On <strong>the</strong> basis of <strong>the</strong> reports<br />
submitted, cross-country comparison reports were prepared at AIT <strong>and</strong> additional relevant<br />
<strong>in</strong>formation was sought from <strong>the</strong> NRIs to bridge some of <strong>the</strong> gaps found <strong>in</strong> <strong>the</strong>ir respective<br />
reports. This is <strong>the</strong> third of <strong>the</strong> four volumes of documents which have resulted from this<br />
<strong>in</strong>teractive research work between AIT <strong>and</strong> <strong>the</strong> NRIs.<br />
This volume on “Technology, <strong>energy</strong> <strong>efficiency</strong> <strong>and</strong> <strong>environmental</strong> <strong>externalities</strong> <strong>in</strong> <strong>the</strong> pulp<br />
<strong>and</strong> paper <strong>in</strong>dustry” covers a description of <strong>the</strong> paper manufactur<strong>in</strong>g process, <strong>and</strong> <strong>the</strong> <strong>energy</strong><br />
<strong>and</strong> <strong>environmental</strong> aspects associated with it. Then <strong>the</strong>re is a cross-country comparison of<br />
<strong>the</strong> pulp <strong>and</strong> paper sector <strong>in</strong> <strong>the</strong> four countries, followed by <strong>in</strong>dividual country reports<br />
prepared by <strong>the</strong> four NRIs. The first five chapters were prepared by Dr. B. Mohanty <strong>and</strong> Dr.<br />
Uwe Stoll with <strong>the</strong> assistance of research associates figur<strong>in</strong>g <strong>in</strong> <strong>the</strong> Project Team.<br />
S<strong>in</strong>cere thanks are extended to all <strong>the</strong> members of <strong>the</strong> Project Team <strong>in</strong>clud<strong>in</strong>g <strong>the</strong> support<strong>in</strong>g<br />
staff, past <strong>and</strong> present, for <strong>the</strong>ir active participation <strong>and</strong> contribution to <strong>the</strong> project. The<br />
enthusiasm <strong>and</strong> dynamism of Dr. X. Chen dur<strong>in</strong>g <strong>the</strong> execution of <strong>the</strong> first phase <strong>and</strong> <strong>the</strong><br />
underst<strong>and</strong><strong>in</strong>g <strong>and</strong> leadership provided by Dr. C. Visvanathan <strong>in</strong> <strong>the</strong> crucial completion<br />
period of <strong>the</strong> project are acknowledged here. The project would have never seen <strong>the</strong> light of<br />
<strong>the</strong> day without <strong>the</strong> support of Sida. F<strong>in</strong>ally, appreciations are due to two <strong>in</strong>dividuals who<br />
have actually conceived <strong>the</strong> Asian Regional Research Programme on Energy, Environment<br />
<strong>and</strong> Climate (ARRPEEC) <strong>and</strong> provided constant support <strong>and</strong> encouragement to this specific<br />
project under <strong>the</strong> overall program: Dr. M.R. Bhagawan, Senior Research Adviser at Sida, <strong>and</strong><br />
Dr. S.C. Bhattacharya, Professor at AIT.<br />
Brahman<strong>and</strong> Mohanty<br />
Asian Institute of Technology<br />
June, 1997
PROJECT TEAM<br />
Faculty Members (Asian Institute of Technology - School of Environment,<br />
Resources <strong>and</strong> Development)<br />
- Dr. Xavier Chen, Energy Program (Until February 1996)<br />
- Dr. Brahman<strong>and</strong> Mohanty, Energy Program<br />
- Dr. Uwe Stoll, Environmental Eng<strong>in</strong>eer<strong>in</strong>g Program (Until January 1996)<br />
- Dr. C. Visvanathan, Environmental Eng<strong>in</strong>eer<strong>in</strong>g Program (From January 1996)<br />
Research Associates (Asian Institute of Technology - School of Environment,<br />
Resources <strong>and</strong> Development)<br />
- Ms. Nahid Am<strong>in</strong><br />
- Ms. Lilita B. Bacareza<br />
- Mr. Z. Kh<strong>and</strong>kar<br />
- Mr. Aung Na<strong>in</strong>g Oo<br />
- Mr. K. Parameshwaran<br />
National Research Institutes<br />
- Institute for Techno-Economics <strong>and</strong> Energy System Analysis, Ts<strong>in</strong>ghua<br />
University, Beij<strong>in</strong>g, Ch<strong>in</strong>a (Prof. Qiu Daxiong)<br />
- Energy Management Centre, M<strong>in</strong>istry of Power, New Delhi, India (Mr. S.<br />
Ramaswamy)<br />
- Department of Energy, Manila, Philipp<strong>in</strong>es (Mr. C.T. Tupas)<br />
- Energy Conservation Fund, M<strong>in</strong>istry of Irrigation, Power <strong>and</strong> Energy, Colombo,<br />
Sri Lanka (Mr. U. Daranagama)<br />
Research Fellows<br />
- Dr. Wu Xiaobo, School of Management, Zhejiang University, Ch<strong>in</strong>a (January-<br />
June 1996)<br />
- Ms. Wang Yanjia, Ts<strong>in</strong>ghua University, Ch<strong>in</strong>a (May-November 1996)<br />
- Mr. Anil Kumar Aneja, Thapar Corporate R&D Centre, India (May-November<br />
1996)<br />
- Ms. Marisol Portal, National Power Corporation, Philipp<strong>in</strong>es (May-November<br />
1996)<br />
- Mr. Gam<strong>in</strong>i Senanayake, Industrial Services Bureau of North Western Prov<strong>in</strong>ce,<br />
Sri Lanka (May-November 1996)
Table of Contents<br />
1. GENERAL.................................................................................................................................. 1<br />
2. PROCESS DESCRIPTION ...................................................................................................... 2<br />
2.1 CEMENT KILN ....................................................................................................................... 4<br />
2.2 CEMENT KILN PROCESSES .................................................................................................... 5<br />
2.2.1 Wet Process................................................................................................................. 5<br />
2.2.2 Semi-wet Processes ..................................................................................................... 7<br />
2.2.3 Semi-dry Process......................................................................................................... 7<br />
2.2.4 Dry Process................................................................................................................. 8<br />
3. ENERGY ISSSUES IN THE CEMENT INDUSTRY .......................................................... 10<br />
3.1 TYPICAL ENERGY CONSUMPTION PATTERNS ..................................................................... 10<br />
3.2 ENERGY EFFICIENCY MEASURES........................................................................................ 13<br />
3.2.1 Short Term Measures ................................................................................................ 13<br />
3.2.2 Medium Term Measures............................................................................................ 14<br />
3.2.2.1 Measures on Processed Materials <strong>and</strong> Products ....................................................... 14<br />
3.2.2.2 Changes <strong>and</strong> Modifications <strong>in</strong> Sub-Processes .......................................................... 14<br />
3.2.2.3 Recovery of Waste Heat........................................................................................... 16<br />
3.2.3 Long Term Measures................................................................................................. 17<br />
3.2.3.1 Conversion from Wet to Dry Process....................................................................... 17<br />
3.2.3.2 Cogeneration ............................................................................................................ 18<br />
3.2.3.3 Computer-Controlled System ................................................................................... 18<br />
3.3 NEW ENERGY EFFICIENT TECHNOLOGIES FOR CEMENT MANUFACTURING ...................... 18<br />
3.3.1 Suspension Preheat<strong>in</strong>g Technology .......................................................................... 20<br />
3.3.2 Suspension Preheat<strong>in</strong>g/Precalc<strong>in</strong>ation Technology.................................................. 20<br />
3.4 CONCLUDING REMARKS ..................................................................................................... 21<br />
4. ENVIRONMENTAL POLLUTION AND MANAGEMENT.............................................. 22<br />
4.1 SOURCES AND CHARACTERISTICS OF POLLUTANTS ........................................................... 22<br />
4.1.1 Water Pollution ......................................................................................................... 22<br />
4.1.2 Air Pollution.............................................................................................................. 22<br />
4.1.2.1 Particulates ............................................................................................................... 23<br />
4.1.2.2 Gaseous Substances.................................................................................................. 26<br />
4.1.3 Solid Waste................................................................................................................ 26<br />
4.2 CURRENT POLLUTION ABATEMENT STRATEGY AND TECHNOLOGIES ............................... 26<br />
4.2.1 Air Pollution Control ................................................................................................ 26<br />
4.2.1.1 Dust Collect<strong>in</strong>g Devices ........................................................................................... 26<br />
4.2.1.2 Gaseous Emission Control........................................................................................ 29<br />
4.2.2 Water Pollution Control............................................................................................ 29<br />
4.2.3 Solid Waste Disposal................................................................................................. 30<br />
4.2.3.1 L<strong>and</strong>fill ..................................................................................................................... 30<br />
4.3 OTHER ENVIRONMENTAL CONSIDERATIONS IN CEMENT INDUSTRY ................................. 30<br />
4.3.1 Noise Pollution.......................................................................................................... 31<br />
4.3.2 Reduction of Ground Vibrations ............................................................................... 32<br />
4.3.3 Raw Materials Resources <strong>and</strong> Site Restoration ........................................................ 32<br />
4.3.4 Utilization of Waste Materials as Raw Material <strong>and</strong> Fuel <strong>in</strong> Cement Industry........ 32<br />
4.4 CONCLUDING REMARKS ..................................................................................................... 35<br />
5. CROSS-COUNTRY COMPARISON OF THE CEMENT SECTOR ................................ 36<br />
5.1 INTRODUCTION ................................................................................................................... 36<br />
5.2 OVERVIEW OF THE INDUSTRY............................................................................................. 36<br />
5.2.1 Role <strong>in</strong> National Economy ........................................................................................ 36<br />
5.2.2 Share <strong>in</strong> Total Energy Consumption ......................................................................... 36<br />
5.2.3 Trends of Production................................................................................................. 37<br />
5.2.4 Mills <strong>and</strong> Capacities ................................................................................................. 38<br />
i
5.3 CHARACTERISTICS OF THE PARAMETERS AFFECTING ENERGY EFFICIENCY...................... 40<br />
5.3.1 Process Mix............................................................................................................... 42<br />
5.3.2 Average Kiln Size ...................................................................................................... 42<br />
5.3.3 Energy Consumption by Type ................................................................................... 43<br />
5.3.4 Awareness on Energy Conservation ......................................................................... 43<br />
5.4 CHARACTERISTICS OF THE PARAMETERS AFFECTING POLLUTION ABATEMENT MEASURES44<br />
5.4.1 Causes for <strong>the</strong> Pollution Problems ........................................................................... 45<br />
5.4.2 Current Pollution Control Strategies........................................................................ 45<br />
5.4.2.1 Pollution Control Strategies <strong>in</strong> Ch<strong>in</strong>a....................................................................... 45<br />
5.4.2.2 Pollution Control Strategies <strong>in</strong> India ........................................................................ 45<br />
5.4.2.3 Pollution Control Strategies <strong>in</strong> Philipp<strong>in</strong>es............................................................... 46<br />
5.4.2.4 Pollution Control Strategies <strong>in</strong> Sri Lanka................................................................. 46<br />
5.4.3 Comparison of Effluent <strong>and</strong> Emission Characteristics ............................................. 46<br />
5.5 POTENTIAL FOR ENERGY EFFICIENCY IMPROVEMENTS...................................................... 48<br />
5.5.1 Measures on Structure of <strong>the</strong> Industry ...................................................................... 48<br />
5.5.2 Potential of Energy Conservation Measures ............................................................ 48<br />
5.6 POTENTIAL FOR POLLUTION ABATEMENT.......................................................................... 49<br />
5.7 CONCLUSION....................................................................................................................... 50<br />
6. PROFILE OF IRON AND STEEL INDUSTRY IN ASIAN INDUSTRIALIZING<br />
COUNTRIES........................................................................................................................... 52<br />
6.1 COUNTRY REPORT: CHINA.................................................................................................. 52<br />
6.1.1 Introduction............................................................................................................... 52<br />
6.1.2 Technological Trajectory of Ch<strong>in</strong>a’s Cement Industry............................................. 52<br />
6.1.2.1 Higher Growth Rate of Production........................................................................... 54<br />
6.1.2.2 Rapid Increase of Small Size Cement Plants............................................................ 54<br />
6.1.2.3 Production Satisfies <strong>the</strong> Internal Dem<strong>and</strong> ................................................................ 54<br />
6.1.2.4 Better Production Quality <strong>and</strong> Low Energy Intensity .............................................. 54<br />
6.1.2.5 Coal as <strong>the</strong> Ma<strong>in</strong> Fuel............................................................................................... 56<br />
6.1.3 Evolution of Energy Efficiency <strong>in</strong> <strong>the</strong> Cement Industry ............................................ 58<br />
6.1.4 Environmental Externalities of Technological Development <strong>in</strong> <strong>the</strong> Cement Industry60<br />
6.1.5 Potential for Energy Efficiency Improvement <strong>and</strong> Pollution Abatement through<br />
Technological Change............................................................................................. 66<br />
6.1.6 Status of Application of New Technologies for Energy Efficiency Improvement <strong>and</strong><br />
Pollution Abatement ................................................................................................ 69<br />
6.1.7 Conclusions............................................................................................................... 71<br />
6.2 COUNTRY REPORT: INDIA................................................................................................... 73<br />
6.2.1 Introduction............................................................................................................... 73<br />
6.2.2 Technological Trajectory of India’s Cement Industry .............................................. 73<br />
6.2.2.1 Current Scenario....................................................................................................... 73<br />
6.2.2.2 Structure of <strong>the</strong> Cement Industry.............................................................................. 75<br />
6.2.3 Evolution of Energy Efficiency <strong>in</strong> <strong>the</strong> Cement Industry of India............................... 75<br />
6.2.3.1 Process Technology Profile...................................................................................... 77<br />
6.2.3.2 Plant Size.................................................................................................................. 77<br />
6.2.3.3 Thermal Energy Consumption.................................................................................. 78<br />
6.2.3.4 Electrical Energy Consumption................................................................................ 78<br />
6.2.3.5 Domestic Manufacture of Cement Mach<strong>in</strong>ery & Equipment ................................... 79<br />
6.2.4 Environmental Externalities...................................................................................... 84<br />
6.2.5 Status of Application of New Technologies............................................................... 85<br />
6.2.5.1 Status of <strong>the</strong> Development of Technology <strong>in</strong> India.................................................. 85<br />
6.2.5.2 Particulate Pollution <strong>and</strong> Abatement ........................................................................ 88<br />
6.2.5.3 Status of Research <strong>and</strong> Development ....................................................................... 93<br />
6.3 COUNTRY REPORT: PHILIPPINES......................................................................................... 94<br />
6.3.1 Introduction............................................................................................................... 94<br />
6.3.2 Technological Trajectory of <strong>the</strong> Philipp<strong>in</strong>e Cement Industry................................... 94<br />
6.3.2.1 Production Capacity ................................................................................................. 94<br />
ii
6.3.2.2 Plant Development ................................................................................................... 95<br />
6.3.3 Evolution of Energy Efficiency <strong>in</strong> <strong>the</strong> Philipp<strong>in</strong>e Cement Industry........................... 96<br />
6.3.4 Environmental Externalities of <strong>the</strong> Cement Industry <strong>in</strong> <strong>the</strong> Philipp<strong>in</strong>es ................... 98<br />
6.3.4.1 Environmental St<strong>and</strong>ards for Pollution Control <strong>and</strong> Abatement.............................. 98<br />
6.3.4.2 Pollution Control Equipment.................................................................................... 99<br />
6.3.5 Potential for Energy Efficiency Improvement <strong>and</strong> Pollution Abatement through<br />
Technological Change............................................................................................. 99<br />
6.3.6 Status of Application of New Technologies............................................................. 101<br />
6.3.7 Conclud<strong>in</strong>g Remarks ............................................................................................... 101<br />
BIBLIOGRAPHY ...................................................................................................................... 102<br />
iii
General 1<br />
1. GENERAL<br />
Rapid <strong>in</strong>dustrialization <strong>and</strong> <strong>in</strong>frastructure development <strong>in</strong> Asian develop<strong>in</strong>g countries has<br />
led to higher cement consumption, <strong>and</strong> eventually <strong>in</strong>creased production requirement.<br />
Though <strong>the</strong> production <strong>in</strong>creased ma<strong>in</strong>ly due to extended plant capacities <strong>and</strong> <strong>in</strong>troduction<br />
of new factories, little attention was paid to efficient <strong>energy</strong> utilization <strong>and</strong> <strong>environmental</strong><br />
pollution control <strong>in</strong> <strong>the</strong> cement <strong>in</strong>dustry of Asian countries.<br />
Cement is a highly <strong>energy</strong> <strong>in</strong>tensive product. In a cement factory, <strong>the</strong> <strong>energy</strong> bill normally<br />
accounts for 20-25% of <strong>the</strong> total production cost. The major <strong>energy</strong> consum<strong>in</strong>g areas <strong>in</strong><br />
cement <strong>in</strong>dustry are <strong>the</strong> high-temperature processes; almost 55-85% of <strong>the</strong> <strong>energy</strong> <strong>in</strong>put of<br />
<strong>the</strong> f<strong>in</strong>al product is consumed <strong>in</strong> <strong>the</strong> high-temperature kiln. Advanced technologies for<br />
waste heat recovery <strong>and</strong> rationalization of <strong>energy</strong> use could offer significant <strong>energy</strong> sav<strong>in</strong>g<br />
opportunities <strong>in</strong> cement <strong>in</strong>dustry which is ever explod<strong>in</strong>g due to <strong>the</strong> rapid global<br />
<strong>in</strong>frastructure development, especially <strong>in</strong> develop<strong>in</strong>g countries.<br />
This document addresses <strong>the</strong> cement production technologies <strong>in</strong> use, various measures for<br />
efficient utilization of <strong>energy</strong>, major sources of pollution, <strong>and</strong> <strong>the</strong> techniques <strong>and</strong> practices<br />
<strong>in</strong> vogue to abate pollution <strong>in</strong> <strong>the</strong> cement <strong>in</strong>dustry to <strong>the</strong> best possible extent. It fur<strong>the</strong>r<br />
discusses about o<strong>the</strong>r <strong>environmental</strong> problems such as noise pollution, ground vibration<br />
etc., which are serious concerns for <strong>the</strong> <strong>environmental</strong>ists <strong>in</strong> developed countries, as well as<br />
<strong>the</strong> possibilities of utilization of waste from o<strong>the</strong>r <strong>in</strong>dustries by <strong>the</strong> cement <strong>in</strong>dustry. F<strong>in</strong>ally,<br />
country reports on <strong>the</strong> cement <strong>in</strong>dustry for four Asian develop<strong>in</strong>g countries, namely, P.R.<br />
Ch<strong>in</strong>a, India, <strong>the</strong> Philipp<strong>in</strong>es <strong>and</strong> Sri Lanka, which are preceded by a cross-country<br />
comparison of <strong>the</strong> <strong>in</strong>dustry.
2 Technology, Energy Efficiency <strong>and</strong> Environmental Externalities of <strong>the</strong> Cement Industry<br />
2. PROCESS DESCRIPTION<br />
The pr<strong>in</strong>cipal raw materials for cement manufactur<strong>in</strong>g are:<br />
- limestone (quarried from <strong>the</strong> m<strong>in</strong>e, near which <strong>the</strong> plant is usually located),<br />
- silica <strong>and</strong> alum<strong>in</strong>a from clay, shale or s<strong>and</strong>, <strong>and</strong><br />
- iron from iron ore or steel mill scale.<br />
The major processes <strong>in</strong>volved <strong>in</strong> production are:<br />
- excavation of limestone (quarry<strong>in</strong>g)<br />
- crush<strong>in</strong>g of limestone<br />
- preparation of o<strong>the</strong>r raw materials<br />
- gr<strong>in</strong>d<strong>in</strong>g of raw materials <strong>in</strong> <strong>the</strong> raw mill<br />
- storage of raw meal <strong>in</strong> a raw meal silo<br />
- blend<strong>in</strong>g of limestone powder to control CaCO3 percentage<br />
- burn<strong>in</strong>g of raw meal to form cl<strong>in</strong>ker<br />
- gr<strong>in</strong>d<strong>in</strong>g <strong>the</strong> cl<strong>in</strong>ker with gypsum <strong>in</strong> cement mill<br />
- storage of cement <strong>in</strong> silo<br />
- pack<strong>in</strong>g <strong>and</strong> distribution of cement<br />
The kiln feed is prepared by proportion<strong>in</strong>g, gr<strong>in</strong>d<strong>in</strong>g <strong>and</strong> blend<strong>in</strong>g <strong>the</strong> raw materials <strong>in</strong>to a<br />
consistent <strong>and</strong> homogeneous composition so that, after mild heat<strong>in</strong>g to drive off any water<br />
<strong>and</strong> CO2 available <strong>in</strong> <strong>the</strong> limestone (CaCO3), one obta<strong>in</strong>s typically 64% calcium oxide<br />
(CaO), 22% silicon dioxide (SiO2), 3.5% alum<strong>in</strong>um oxide (Al2O3), <strong>and</strong> 3.0% iron ore (as<br />
Fe2O3) (Sell, 1992). These raw materials are processed at very high temperatures so <strong>the</strong>y<br />
react by solid-solid reactions to form cl<strong>in</strong>ker which consists of four major compounds as<br />
shown <strong>in</strong> Table 2.1. The exact proportions of <strong>the</strong>se f<strong>in</strong>al products determ<strong>in</strong>e <strong>the</strong> cement<br />
characteristics; for example, <strong>the</strong> harden<strong>in</strong>g time, <strong>the</strong> early strength <strong>and</strong> <strong>the</strong> f<strong>in</strong>al strength.<br />
Table 2.1. Portl<strong>and</strong> cement cl<strong>in</strong>ker compounds<br />
Chemical name M<strong>in</strong>eral<br />
phase<br />
name<br />
Chemical formula Cement<br />
chemists<br />
designation<br />
Percentage <strong>in</strong><br />
ord<strong>in</strong>ary<br />
cement<br />
Tricalcium Silicate Alite 3CaO.SiO2 C3S 45<br />
Diacalcium Silicate Belite 2CaO.SiO2 C2S 25<br />
Tricalcium Alum<strong>in</strong>ate Celite 3CaO.Al2O3 C3A 11<br />
Tetracalcium Alum<strong>in</strong>o-ferrite Iron 4CaO.Al2O3.Fe2O3 C4AF 8<br />
(Source: Dodson, 1990)<br />
The ma<strong>in</strong> steps of <strong>the</strong> cement manufactur<strong>in</strong>g process are shown schematically <strong>in</strong> Figure<br />
2.1.
Process Description 3<br />
Fig. 2.1. Steps <strong>in</strong> <strong>the</strong> manufacture of Portl<strong>and</strong> cement
4 Technology, Energy Efficiency <strong>and</strong> Environmental Externalities of <strong>the</strong> Cement Industry<br />
The largest volume of raw material is CaCO3 or comparable materials (such as oyster shells<br />
<strong>in</strong> locations where appropriate). The CaCO3 as m<strong>in</strong>ed is often <strong>in</strong> chunks up to 750 mm <strong>in</strong><br />
diameter. These must be crushed to about 10 mm, <strong>and</strong> <strong>the</strong>n mixed with <strong>the</strong> s<strong>and</strong>, shale,<br />
<strong>and</strong> o<strong>the</strong>r <strong>in</strong>gredients for fur<strong>the</strong>r gr<strong>in</strong>d<strong>in</strong>g to about 60µm <strong>in</strong> diameter. Frequently, <strong>the</strong> <strong>in</strong>itial<br />
crush<strong>in</strong>g is done at <strong>the</strong> quarry, prior to transport to <strong>the</strong> cement plant. After gr<strong>in</strong>d<strong>in</strong>g,<br />
depend<strong>in</strong>g upon <strong>the</strong> exact process, water may be added. The mixture is <strong>the</strong>n taken to some<br />
high-temperature process<strong>in</strong>g unit known as rotary kiln for conversion to cement cl<strong>in</strong>ker.<br />
The cl<strong>in</strong>ker must be cooled before fur<strong>the</strong>r process<strong>in</strong>g. Then it is ei<strong>the</strong>r stored, sold or<br />
transported (to <strong>in</strong>dividual gr<strong>in</strong>d<strong>in</strong>g mills), or is ground at <strong>the</strong> plant with gypsum <strong>and</strong> o<strong>the</strong>r<br />
possible additives to a f<strong>in</strong>e powder of f<strong>in</strong>ished cement. The cement is ei<strong>the</strong>r packaged or<br />
sold <strong>in</strong> bulk to <strong>the</strong> distributors.<br />
2.1 Cement Kiln<br />
The Cement kilns are large; up to 230 m <strong>in</strong> length <strong>and</strong> 8 m <strong>in</strong> diameter; <strong>in</strong>cl<strong>in</strong>ed at an angle<br />
of three to six degrees, <strong>and</strong> l<strong>in</strong>ed with temperature-resistant refractory brick. They rotate at<br />
about 50 to 70 revolutions per hour <strong>in</strong> <strong>the</strong> older generation plants, <strong>and</strong> 170 to 180 <strong>in</strong> <strong>the</strong><br />
more modern ones. The feed material is <strong>in</strong>troduced at <strong>the</strong> elevated end <strong>and</strong> is moved<br />
slowly by <strong>the</strong> rotation of <strong>the</strong> kiln down towards <strong>the</strong> fir<strong>in</strong>g end, where heat is applied by a<br />
flame of coal, gas, oil or a comb<strong>in</strong>ation of <strong>the</strong>se fuels. Coal is most widely used as <strong>the</strong> kiln<br />
fuel nowadays.<br />
Several dist<strong>in</strong>ct <strong>the</strong>rmal zones exist <strong>in</strong> <strong>the</strong> kiln. At <strong>the</strong> elevated end where <strong>the</strong> feed is<br />
<strong>in</strong>troduced, is a dry<strong>in</strong>g <strong>and</strong> preheat<strong>in</strong>g zone <strong>in</strong> which <strong>the</strong> material reaches a temperature of<br />
about 800 o C. This is followed by <strong>the</strong> calc<strong>in</strong><strong>in</strong>g zone where carbon dioxide is driven off <strong>the</strong><br />
limestone, convert<strong>in</strong>g it to free lime at a material temperature close to 1000 o C. The<br />
chemical reaction tak<strong>in</strong>g place <strong>in</strong> this zone is as follows:<br />
CaCO3 ⇑ CaO + CO2<br />
By <strong>the</strong> time <strong>the</strong> calc<strong>in</strong>ation is complete, <strong>the</strong> free lime enters <strong>the</strong> <strong>in</strong>termediate zone where<br />
temperature prevails <strong>in</strong> <strong>the</strong> range of 1000 - 1200 o C <strong>and</strong> <strong>the</strong> basic oxide (CaO) reacts with<br />
silica (SiO2) <strong>and</strong> alum<strong>in</strong>a (Al2O3) as shown:<br />
Al2O3 + CaO ⇑ CaO.Al2O3 (mono-calcium alum<strong>in</strong>ate)<br />
2CaO + CaO.Al2O3 ⇑ 3CaO.Al2O3 (tri-calcium alum<strong>in</strong>ate)<br />
SiO2 + 2CaO ⇑ 2CaO.SiO2 (di-calicium silicate)<br />
2CaO + Fe2O3 ⇑ 2CaO.Fe2O3<br />
2CaO.Fe2O3 + 2CaO + Al2O3 ⇑ 4CaO.Al2O3.Fe2O3
Process Description 5<br />
Next is <strong>the</strong> s<strong>in</strong>ter<strong>in</strong>g zone where, at a temperature of about 1300 o C, s<strong>in</strong>ter<strong>in</strong>g of <strong>the</strong><br />
materials beg<strong>in</strong>s. While s<strong>in</strong>ter<strong>in</strong>g, di-calcium silicate gets saturated with <strong>the</strong> rema<strong>in</strong><strong>in</strong>g free<br />
lime <strong>and</strong> forms tri-calcium silicate.<br />
2CaO.SiO2 + CaO ⇑ 3CaO.SiO2 (tri-calcium silicate)<br />
By <strong>the</strong> time <strong>the</strong> materials reach <strong>the</strong> flame area, <strong>the</strong>y are white hot (1425 -1550 o C). In a<br />
semi-liquid state at this stage, <strong>the</strong>y acquire a greenish black color <strong>and</strong> form nodules about<br />
25 mm <strong>in</strong> diameter which, on cool<strong>in</strong>g, is referred to as cl<strong>in</strong>ker. After this extremely hot<br />
area, <strong>the</strong> temperature drops, <strong>and</strong> <strong>the</strong> cl<strong>in</strong>ker starts to cool. The materials <strong>the</strong>n f<strong>in</strong>ally drop<br />
out of <strong>the</strong> kiln onto a cooler, through which large volume of relatively cool air is passed.<br />
The air from <strong>the</strong> cooler, ra<strong>the</strong>r than be<strong>in</strong>g wasted, is channeled <strong>in</strong>to <strong>the</strong> kiln as combustion<br />
air for <strong>the</strong> flame. This air, <strong>in</strong> travers<strong>in</strong>g <strong>the</strong> kiln, becomes turbulent, <strong>and</strong> often picks up<br />
some of <strong>the</strong> f<strong>in</strong>er raw material particles which become entra<strong>in</strong>ed <strong>in</strong> <strong>the</strong> air stream. The air<br />
simultaneously transfers heat to <strong>the</strong> back end of <strong>the</strong> kiln. Before <strong>the</strong> air can exit <strong>the</strong> kiln, it<br />
is passed through a dense curta<strong>in</strong> of cha<strong>in</strong>s that serves two purposes:<br />
- removes some of <strong>the</strong> entra<strong>in</strong>ed dust, <strong>and</strong><br />
- acts as a mechanism for heat transfer <strong>in</strong> order to reta<strong>in</strong> heat as much as possible<br />
with<strong>in</strong> <strong>the</strong> kiln.<br />
The air, after leav<strong>in</strong>g <strong>the</strong> kiln, is ducted to an electrostatic precipitator for particulate<br />
removal, <strong>and</strong> <strong>the</strong>n to <strong>the</strong> stack. The cl<strong>in</strong>ker is <strong>the</strong>n conveyed to <strong>the</strong> f<strong>in</strong>ish-gr<strong>in</strong>d<strong>in</strong>g section<br />
where about five percent of gypsum is added to it. The mixture is f<strong>in</strong>ely ground <strong>in</strong> ball or<br />
tube mills, close-circuited with air separators, to give f<strong>in</strong>ished cement. The cement is<br />
conveyed to <strong>the</strong> storage silos, usually by pneumatic conveyors.<br />
2.2 Cement Kiln Processes<br />
There are four basic types of cement kilns currently <strong>in</strong> use: wet process, semi-wet process,<br />
semi-dry process, <strong>and</strong> dry process. Of <strong>the</strong>se, <strong>the</strong> dry process is <strong>the</strong> most <strong>energy</strong> efficient<br />
<strong>and</strong> most commonly used <strong>technology</strong> nowadays.<br />
2.2.1 Wet process<br />
Worldwide, a considerable proportion of cement cl<strong>in</strong>ker is still produced by <strong>the</strong> wet<br />
process where<strong>in</strong> <strong>the</strong> raw materials are prepared <strong>and</strong> mixed with <strong>the</strong> aid of water (30-40%)<br />
<strong>and</strong> fed <strong>in</strong>to <strong>the</strong> upper end of <strong>the</strong> kiln as a slurry. Wet process is particularly useful when<br />
<strong>the</strong> raw materials conta<strong>in</strong> a significant amount of moisture as quarried. This process has <strong>the</strong><br />
advantage of uniform feed blend<strong>in</strong>g, but requires more <strong>energy</strong> than <strong>the</strong> o<strong>the</strong>r types of kilns,<br />
s<strong>in</strong>ce <strong>the</strong> water must be evaporated dur<strong>in</strong>g <strong>the</strong> process. Similar process reactions as
6 Technology, Energy Efficiency <strong>and</strong> Environmental Externalities of <strong>the</strong> Cement Industry<br />
described <strong>in</strong> section 2.1 lead to <strong>the</strong> formation of cl<strong>in</strong>ker. A typical wet-process rotary kiln is<br />
shown <strong>in</strong> Figure 2.2.<br />
Fig. 2.2. Diagram of a typical wet procvess rotary kiln<br />
Fig. 2.3. Diagram of a typical preheater system
Process Description 7<br />
2.2.2 Semi-wet processes<br />
Semi-wet cement process<strong>in</strong>g employs grate-kiln methods (Figure 2.3). In <strong>the</strong> semi-wet<br />
cement manufactur<strong>in</strong>g process <strong>the</strong> raw materials prepared by wet process<strong>in</strong>g are first<br />
mechanically dewatered - preferably with filter presses - <strong>and</strong> <strong>the</strong>n fed <strong>in</strong> <strong>the</strong> form of<br />
nodules to a dry<strong>in</strong>g unit. This dry<strong>in</strong>g unit may be <strong>the</strong> third compartment of a travel<strong>in</strong>g grate<br />
preheater. Nowadays, a dispersion dryer or impact dryer is preferably <strong>in</strong>stalled ahead of <strong>the</strong><br />
preheater or precalc<strong>in</strong>er kiln. In cases where former wet kilns have been converted <strong>in</strong>to<br />
one-stage or two-stage preheater kilns on this pr<strong>in</strong>ciple, impact dryers have hi<strong>the</strong>rto been<br />
employed. Advantages of grate-kiln systems <strong>in</strong>clude:<br />
- a controlled feed rate<br />
- no flush<strong>in</strong>g of materials <strong>in</strong>to <strong>the</strong> kiln<br />
- no segregation of raw materials due to differential shapes <strong>and</strong> densities<br />
- avoidance of fluidization of <strong>the</strong> materials<br />
- m<strong>in</strong>imal dust<strong>in</strong>g<br />
- production of uniform cl<strong>in</strong>ker<br />
- low <strong>energy</strong> requirement (70% of that required for modern long wet kiln), <strong>and</strong><br />
- ability to use higher-alkali feeds than many o<strong>the</strong>r process<strong>in</strong>g techniques.<br />
2.2.3 Semi-dry process<br />
In <strong>the</strong> semi-dry process, nodules or pellets (approximately 12% water) formed from raw<br />
meal with <strong>the</strong> aid of water are used. The travel<strong>in</strong>g grate preheater kiln cont<strong>in</strong>ues to be<br />
available as a technically well developed pyro-process<strong>in</strong>g unit. Kilns of this type, however,<br />
suffer from some disadvantages <strong>in</strong>herent <strong>in</strong> <strong>the</strong> system, such as:<br />
- relatively high <strong>in</strong>itial cost <strong>and</strong> operat<strong>in</strong>g expenses associated with kiln outputs,<br />
- specific quality requirements of <strong>the</strong> raw materials (grate process requires nodules to<br />
be consistent <strong>in</strong> size <strong>and</strong> composition which is often very difficult to achieve),<br />
- relatively high overall heat consumption (only <strong>the</strong> exhaust air from <strong>the</strong> cooler is<br />
available for dry<strong>in</strong>g <strong>the</strong> materials dur<strong>in</strong>g gr<strong>in</strong>d<strong>in</strong>g),<br />
- restrictions as to <strong>the</strong> use of low-grade fuels, <strong>and</strong><br />
- <strong>in</strong>ability to apply precalc<strong>in</strong>ation.<br />
Because of <strong>the</strong>se drawbacks, this system has lost <strong>the</strong> weight it once possessed. However it<br />
is reported that several of <strong>the</strong> newer <strong>in</strong>stallations <strong>in</strong> <strong>the</strong> United States do employ grate-kiln<br />
methods (Sell, 1992). Depend<strong>in</strong>g upon <strong>the</strong> local conditions, <strong>in</strong> certa<strong>in</strong> situations, <strong>the</strong>y are<br />
deemed preferable to preheater systems.
8 Technology, Energy Efficiency <strong>and</strong> Environmental Externalities of <strong>the</strong> Cement Industry<br />
2.2.4 Dry process<br />
A long kiln similar to that used <strong>in</strong> <strong>the</strong> wet process can also be used for a dry process. Dry<br />
process consumes significantly less <strong>energy</strong> <strong>and</strong> can often h<strong>and</strong>le particulate emission<br />
problems more easily. Moreover, <strong>the</strong>re are dry process<strong>in</strong>g techniques far superior to <strong>the</strong> dry<br />
kiln which already consumes less <strong>energy</strong> than <strong>the</strong> wet process.<br />
Newer cement plants use <strong>the</strong> dry process <strong>in</strong> which <strong>the</strong> raw material is fed to <strong>the</strong> kiln as dry<br />
powder. In <strong>the</strong> most recently erected plants, preheater <strong>and</strong> precalc<strong>in</strong>er units have been<br />
added to improve <strong>the</strong> <strong>the</strong>rmal <strong>efficiency</strong> of <strong>the</strong> process by us<strong>in</strong>g hot kiln gases to pre-heat<br />
<strong>and</strong> pre-calc<strong>in</strong>e <strong>the</strong> feed before it enters <strong>the</strong> kiln. The preferable dry process<strong>in</strong>g method is<br />
by a suspension preheater system as shown <strong>in</strong> Figure 2.4. The f<strong>in</strong>ely ground dry raw<br />
materials are fed <strong>in</strong>to <strong>the</strong> preheater at <strong>the</strong> top, counter-current to <strong>the</strong> air flow. This air flow<br />
orig<strong>in</strong>ates <strong>in</strong> <strong>the</strong> cooler <strong>and</strong> thus has been heated by travers<strong>in</strong>g through <strong>the</strong> cooler <strong>and</strong> also<br />
a short rotary kiln section before be<strong>in</strong>g ducted to <strong>the</strong> preheater. Hence, it is sufficiently hot<br />
to not only preheat, but also partially calc<strong>in</strong>e <strong>the</strong> <strong>in</strong>com<strong>in</strong>g materials. The physical<br />
arrangement of a series of cyclones on <strong>the</strong> preheater is such that <strong>the</strong> hot air <strong>and</strong> <strong>the</strong> feed<br />
can have <strong>in</strong>timate contact <strong>in</strong> a series of stages for maximum heat transfer <strong>and</strong> optimum<br />
<strong>efficiency</strong>. The addition of a flash calc<strong>in</strong>er, a stationary furnace <strong>in</strong>terposed between <strong>the</strong> rotary<br />
kiln <strong>and</strong> <strong>the</strong> suspension preheater, <strong>in</strong>creases <strong>the</strong> amount of calc<strong>in</strong>ation that occurs with<strong>in</strong><br />
<strong>the</strong> preheater, thus <strong>in</strong>creas<strong>in</strong>g <strong>the</strong> potential capacity of <strong>the</strong> rotary kiln. When <strong>the</strong> raw mill<br />
has passed all <strong>the</strong> stages, it is heated up to 800°C <strong>and</strong> is extensively calc<strong>in</strong>ed before enter<strong>in</strong>g<br />
<strong>the</strong> kiln. The temperature of <strong>the</strong> hot gas drops to 300°C from 1000°C.<br />
The hot particulate feed, after pass<strong>in</strong>g through <strong>the</strong> preheater <strong>and</strong> <strong>the</strong> flash calc<strong>in</strong>er, enters a<br />
short rotary kiln where it undergoes cl<strong>in</strong>kerization. The rational beh<strong>in</strong>d accomplish<strong>in</strong>g only<br />
this last stage of <strong>the</strong> process<strong>in</strong>g with<strong>in</strong> <strong>the</strong> kiln is better economy, particularly <strong>in</strong> terms of<br />
<strong>energy</strong> conservation. In addition, most of <strong>the</strong> dust generated can be reta<strong>in</strong>ed with<strong>in</strong> <strong>the</strong><br />
preheater, cutt<strong>in</strong>g back <strong>the</strong> dust problems to a great extent.<br />
Shaft kilns (Figure 2.5) constitute ano<strong>the</strong>r dry process<strong>in</strong>g technique, used to some extent <strong>in</strong><br />
Europe. Shaft kilns have lower <strong>the</strong>rmal <strong>and</strong> power requirements per ton of cl<strong>in</strong>ker<br />
produced than those of rotary kilns <strong>and</strong> are comparable to <strong>the</strong> preheater systems. Their<br />
major disadvantages are <strong>the</strong> small capacity <strong>and</strong> a less uniform product, primarily as a result<br />
of tunnel<strong>in</strong>g of <strong>the</strong> gases through <strong>the</strong> load.
Process Description 9<br />
Fig. 2.4 Diagram of a shaft kiln<br />
Fig. 2.5 Diagram of grate-kiln process
10 Technology, Energy Efficiency <strong>and</strong> Environmental Externalities of <strong>the</strong> Cement Industry<br />
3. ENERGY ISSSUES IN THE CEMENT INDUSTRY<br />
3.1 Typical Energy Consumption Patterns<br />
The cement manufactur<strong>in</strong>g processes consume two types of primary <strong>energy</strong>: <strong>the</strong>rmal<br />
<strong>energy</strong> provided by coal, natural gas or oil, <strong>and</strong> mechanical <strong>energy</strong> converted from<br />
electricity. The <strong>the</strong>rmal <strong>energy</strong> accounts for about 87% of <strong>the</strong> total primary <strong>energy</strong> <strong>and</strong> is<br />
ma<strong>in</strong>ly used <strong>in</strong> cl<strong>in</strong>ker production. Typical <strong>the</strong>rmal <strong>energy</strong> <strong>and</strong> electricity consumptions of<br />
cement manufactur<strong>in</strong>g processes are given <strong>in</strong> Table 3.1.<br />
Table 3.1. Specific <strong>the</strong>rmal <strong>energy</strong> <strong>and</strong> electricity consumption for cement<br />
Process Thermal Energy (GJ/ton) Electricity (kWh/ton)<br />
Wet Process 5.02-5.43 70-125<br />
Semi-wet Process 3.15-3.86 70-125<br />
Dry Process 2.88-3.40 110-125<br />
Semi-dry Process 3.10-3.50 110-125<br />
The secondary <strong>energy</strong> sources used <strong>in</strong> cement production are kiln exhaust gas <strong>and</strong> hot air<br />
from cl<strong>in</strong>ker cooler. A process flow diagram show<strong>in</strong>g <strong>the</strong> various sources of <strong>energy</strong> used <strong>in</strong><br />
<strong>the</strong> cement manufactur<strong>in</strong>g process is given <strong>in</strong> Figures 3.1a & 3.1b.<br />
Secondary heat conta<strong>in</strong>ed <strong>in</strong> <strong>the</strong> hot kiln exhaust gas is utilized primarily <strong>in</strong> pre-dry<strong>in</strong>g <strong>and</strong><br />
preheat<strong>in</strong>g <strong>the</strong> raw materials before <strong>the</strong>ir <strong>in</strong>troduction <strong>in</strong>to <strong>the</strong> kiln <strong>and</strong> raw mill. The waste<br />
heat conta<strong>in</strong>ed <strong>in</strong> <strong>the</strong> exhaust air from <strong>the</strong> cl<strong>in</strong>ker cooler too serves to preheat combustion<br />
air <strong>and</strong> also to dry <strong>and</strong> preheat <strong>the</strong> raw materials before <strong>the</strong>y enter <strong>the</strong> raw mill <strong>and</strong> kiln.<br />
The two most <strong>energy</strong>-<strong>in</strong>tensive phases <strong>in</strong> cement manufactur<strong>in</strong>g are cl<strong>in</strong>ker production <strong>and</strong><br />
gr<strong>in</strong>d<strong>in</strong>g. The cl<strong>in</strong>ker production process consumes ma<strong>in</strong>ly <strong>the</strong>rmal <strong>energy</strong> <strong>in</strong> <strong>the</strong> form of<br />
coal, oil or gas, while gr<strong>in</strong>d<strong>in</strong>g consumes ma<strong>in</strong>ly electrical <strong>energy</strong>.<br />
Typical specific <strong>energy</strong> consumption values for different cement manufactur<strong>in</strong>g processes<br />
are shown <strong>in</strong> Figure 3.2.<br />
For <strong>the</strong> best available <strong>technology</strong> of dry process production with cyclone preheater <strong>and</strong><br />
precalc<strong>in</strong>er, <strong>the</strong> specific <strong>energy</strong> consumption is 3.05 MJ/kg of cl<strong>in</strong>ker. However, some<br />
cement mills <strong>in</strong> develop<strong>in</strong>g countries are still utiliz<strong>in</strong>g <strong>the</strong> wet process with obsolete<br />
technologies <strong>and</strong> consum<strong>in</strong>g up to 8 MJ/kg of cl<strong>in</strong>ker.
Energy Issues <strong>in</strong> <strong>the</strong> Cement Industry 11<br />
Fig. 3.1a. Flow diagram s of a typical dry process cement plant<br />
* T he dotte d l<strong>in</strong> e re pres ents We t Pro ces s on ly
12 Technology, Energy Efficiency <strong>and</strong> Environmental Externalities of <strong>the</strong> Cement Industry<br />
Fig 3.1b.Flow diagram of a typical wet process cement plant<br />
* Th e dot ted l <strong>in</strong>e re pres ents Wet Proc ess only
Energy Issues <strong>in</strong> <strong>the</strong> Cement Industry 13<br />
MJ/kg of Cement<br />
7<br />
6<br />
5<br />
4<br />
3<br />
2<br />
1<br />
0<br />
7.5%<br />
6.5%<br />
82%<br />
4%<br />
10.1%<br />
8.9%<br />
75.5%<br />
5.5%<br />
11%<br />
11%<br />
55%<br />
23%<br />
Wet process Semi-wet process Dry process Semi-dry process<br />
Raw materials preparation Cl<strong>in</strong>ker production F<strong>in</strong>ish<strong>in</strong>g O<strong>the</strong>rs<br />
10.5%<br />
9.3%<br />
60%<br />
20.2%<br />
Figure 3.2. Typical specific <strong>energy</strong> consumption for cement manufactur<strong>in</strong>g<br />
3.2 Energy Efficiency Measures<br />
The utilization of as much secondary <strong>energy</strong> sources as possible <strong>and</strong> <strong>the</strong> reduction of <strong>the</strong><br />
primary purchased <strong>energy</strong> are <strong>the</strong> objectives of <strong>energy</strong> conservation measures <strong>in</strong> <strong>the</strong> cement<br />
<strong>in</strong>dustry. These measures can be classified accord<strong>in</strong>g to <strong>the</strong> level of <strong>energy</strong> sav<strong>in</strong>gs <strong>and</strong><br />
types of <strong>in</strong>vestments <strong>in</strong>volved as follows.<br />
3.2.1 Short term measures<br />
Some of <strong>the</strong> basic <strong>energy</strong> sav<strong>in</strong>g measures that can be readily implemented <strong>in</strong> <strong>the</strong> short<br />
term without major <strong>in</strong>vestments are:<br />
- <strong>in</strong>spection to encourage conservation activity<br />
- tra<strong>in</strong><strong>in</strong>g program for operat<strong>in</strong>g <strong>energy</strong> <strong>in</strong>tensive equipment such as crusher,<br />
gr<strong>in</strong>d<strong>in</strong>g mill, pneumatic separator, vibrat<strong>in</strong>g screen, etc.<br />
- replacement of worn-out parts of crusher <strong>and</strong> gr<strong>in</strong>d<strong>in</strong>g mach<strong>in</strong>es<br />
- controll<strong>in</strong>g <strong>the</strong> slurry water at optimum level (for wet process)<br />
( reduction of moisture content by 5% can save 338 MJ/ton of cl<strong>in</strong>ker)<br />
- controll<strong>in</strong>g <strong>the</strong> combustion air<br />
(10% reduction <strong>in</strong> excess air can save 34-85 MJ/ton of cl<strong>in</strong>ker)<br />
- controll<strong>in</strong>g <strong>the</strong> composition of raw materials<br />
(<strong>the</strong> fluctuation encountered <strong>in</strong> <strong>the</strong> composition of <strong>the</strong> raw materials fed to a<br />
cement kiln is generally compensated by an over-bak<strong>in</strong>g which leads to <strong>energy</strong><br />
losses)<br />
- plugg<strong>in</strong>g of all air leakage
14 Technology, Energy Efficiency <strong>and</strong> Environmental Externalities of <strong>the</strong> Cement Industry<br />
- ensur<strong>in</strong>g <strong>the</strong> un<strong>in</strong>terrupted operation of <strong>the</strong> kiln<br />
- power factor improvement of electric motors<br />
- turn<strong>in</strong>g off motors <strong>and</strong> heaters when<br />
not <strong>in</strong> use.<br />
- <strong>in</strong>sulation enhancement of kiln<br />
Energy sav<strong>in</strong>gs of <strong>the</strong> order of 10-15%<br />
can be achieved by adopt<strong>in</strong>g <strong>the</strong>se short term<br />
measures<br />
<strong>in</strong> develop<strong>in</strong>g countries.<br />
3.2.2 Medium term measures<br />
These <strong>in</strong>clude switch<strong>in</strong>g to new <strong>and</strong> more efficient technologies<br />
as well as recovery of<br />
materials<br />
<strong>and</strong> waste heat with moderate capital expenditures.<br />
3.2.2.1 Measures on processed materials <strong>and</strong> products<br />
(i) Installation of dust collection system<br />
The high velocity gases pass<strong>in</strong>g through <strong>the</strong> kiln carry along a large portion of dust, thus<br />
los<strong>in</strong>g materials as well as <strong>energy</strong> due to <strong>the</strong> extra raw material that has to be processed for<br />
<strong>the</strong> same amount of output. Each percentage of material loss will consume additional<br />
<strong>energy</strong> of about 42 MJ/ton of cl<strong>in</strong>ker. Larger size dust particles can be removed by<br />
cyclones <strong>and</strong> smaller<br />
size dust can be removed by electrostatic precipitators, bag filters or<br />
wet<br />
scrubbers.<br />
(ii) Diversification of cement products<br />
The blend<strong>in</strong>g of certa<strong>in</strong> materials like granulated slag, fly ash <strong>and</strong> pozzolans with <strong>the</strong><br />
cement makes it possible to produce more cement from <strong>the</strong> same amount of cl<strong>in</strong>ker, <strong>and</strong> as<br />
a result, <strong>the</strong> fuel consumption per ton of cement can be reduced. About 20% of cl<strong>in</strong>ker can<br />
be replaced by fly ash <strong>and</strong> up to 25% by blast furnace slag without<br />
chang<strong>in</strong>g <strong>the</strong> character<br />
of<br />
<strong>the</strong> ord<strong>in</strong>ary Portl<strong>and</strong> cement as a general purpose cement.<br />
3.2.2.2 Changes <strong>and</strong> modifications <strong>in</strong> sub-processes<br />
(i) Reduction of water content of slurry<br />
The water content of slurry can be reduced by any <strong>the</strong> follow<strong>in</strong>g means:<br />
- addition of chemicals of slurry th<strong>in</strong>ners<br />
- us<strong>in</strong>g proper filters so that slurry is dewatered mechanically<br />
- preheat<strong>in</strong>g <strong>the</strong> slurry by utiliz<strong>in</strong>g <strong>the</strong> secondary <strong>energy</strong> sources<br />
(each percentage of water reduction <strong>in</strong> <strong>the</strong> slurry will <strong>in</strong>crease <strong>the</strong> kiln capacity<br />
by<br />
about 1.5% <strong>and</strong> reduce <strong>the</strong> <strong>energy</strong> consumption by 68 MJ/ton of cl<strong>in</strong>ker)
Energy Issues <strong>in</strong> <strong>the</strong> Cement Industry 15<br />
(ii) Installation of dual fir<strong>in</strong>g system<br />
The reaction at <strong>the</strong> kiln takes place at two stages, firstly at a lower temperature range of<br />
800-900°C (which is called calc<strong>in</strong>ation) <strong>and</strong> <strong>the</strong>n at a higher temperature range of 1300-<br />
1500°C (termed as burn<strong>in</strong>g). Low grade fuels can be used <strong>in</strong> <strong>the</strong> lower temperature range<br />
combustion so that fuels with higher calorific values can be replaced. Depend<strong>in</strong>g on <strong>the</strong><br />
system,<br />
20-25% of <strong>the</strong> total fuel can be replaced by low grade fuel be<strong>in</strong>g utilized for <strong>the</strong><br />
calc<strong>in</strong>ation phase.<br />
(iii) Change<br />
<strong>in</strong> cl<strong>in</strong>ker gr<strong>in</strong>d<strong>in</strong>g system: vertical roller mills to replace tube <strong>and</strong> ball<br />
mills<br />
Upgradation of equipment such as jaw-crusher to gyratory crusher, ball mill to vertical<br />
roller<br />
mill (VRM), worm gears to helical <strong>and</strong> spiral gears, etc., can <strong>in</strong>crease<br />
<strong>the</strong> <strong>efficiency</strong> of<br />
power transmission system <strong>and</strong> reduce specific power consumption.<br />
In roller mills, raw materials are dried dur<strong>in</strong>g pulverization us<strong>in</strong>g waste heat from <strong>the</strong> kiln<br />
<strong>and</strong> size reduction is effected by roller or comparable gr<strong>in</strong>d<strong>in</strong>g elements travel<strong>in</strong>g over <strong>the</strong><br />
circular bed of material which is <strong>the</strong>n subjected to a prelim<strong>in</strong>ary classify<strong>in</strong>g action by a<br />
stream of air sweep<strong>in</strong>g through <strong>the</strong> mill. The gr<strong>in</strong>d<strong>in</strong>g <strong>efficiency</strong> of VRM is more than<br />
twice <strong>the</strong> value for ball mill <strong>in</strong> coarse size reduction up to a size of 0.5 mm. Thus <strong>the</strong> power<br />
consumption of VRM is 35% less than <strong>the</strong> ball mill. Up to 25% electricity may be saved by<br />
replac<strong>in</strong>g ball mills with roller mills. In new plants, roller mills are recommended to be used<br />
<strong>in</strong>stead of ball mills. The specific electricity consumption of different systems are given <strong>in</strong><br />
T able 3.2.<br />
Table 3.2. Specific electricity consumption of cement gr<strong>in</strong>d<strong>in</strong>g<br />
systems<br />
Gr<strong>in</strong>d<strong>in</strong>g System Electricity (kWh/ton)<br />
Open system with ball mills 55<br />
Closed system with ball mills <strong>and</strong> a separator for recycl<strong>in</strong>g 47<br />
Closed system with pre-gr<strong>in</strong>d<strong>in</strong>g of cl<strong>in</strong>ker <strong>in</strong>to an <strong>energy</strong> efficient<br />
41<br />
roller mill with recirculation<br />
Closed system based on roller press, a ball mill <strong>and</strong> separator 39<br />
Closed system only based on a roller press <strong>and</strong> separator 28<br />
(iv) New rotary kiln<br />
New rotary kiln plant with 4-stage HUMBOLDT preheater <strong>and</strong> wet preparation<br />
can result<br />
<strong>in</strong><br />
higher <strong>efficiency</strong> <strong>and</strong> performance <strong>and</strong> <strong>energy</strong> sav<strong>in</strong>g of around 15-20%.
16 Technology, Energy Efficiency <strong>and</strong> Environmental Externalities of <strong>the</strong> Cement Industry<br />
(v) Operat<strong>in</strong>g <strong>the</strong> mill <strong>in</strong> closed loop <strong>in</strong>stead of open loop<br />
The screen<strong>in</strong>g <strong>and</strong> size reduction operation can be ei<strong>the</strong>r open or closed circuit circuit as<br />
shown <strong>in</strong> Figure 3.3. After screen<strong>in</strong>g, <strong>the</strong> mixture is ground <strong>in</strong> <strong>the</strong> raw mill. There is a 5 to<br />
7 % <strong>in</strong>crease <strong>in</strong> <strong>the</strong> output <strong>and</strong> a correspond<strong>in</strong>g reduction <strong>in</strong> specific<br />
<strong>energy</strong> consumption.<br />
(i)<br />
feed<br />
Reduction<br />
f<strong>in</strong>e products<br />
fresh feed<br />
Reduction<br />
Classification<br />
f<strong>in</strong>e products<br />
Open-circuit (ii) Closed-circuit<br />
3.2.2.3 Recovery of waste heat<br />
Figure 3.3. Processes of size reduction<br />
oversize<br />
The waste heat available <strong>in</strong> <strong>the</strong> form of secondary <strong>energy</strong> sources is shown <strong>in</strong> Figure 3.4<br />
with<br />
typical temperature ranges.<br />
Preheater<br />
<strong>in</strong>termediate<br />
gas (500-800°C)<br />
Preheater<br />
Preheater<br />
exhaust gas (280-600 °C)<br />
Hot air from cooler (Secondary<br />
air)<br />
Calc<strong>in</strong>ator (700-900°C)<br />
Exhaust air from<br />
cooler<br />
(150-400 °C)<br />
Kiln exit gas Kiln Cl<strong>in</strong>ker<br />
(Bypass gas) Cooler Cl<strong>in</strong>ker<br />
(1000-1200<br />
°C) Products
Energy Issues <strong>in</strong> <strong>the</strong> Cement Industry 17<br />
Figure 3.4. Availability of waste heat at different temperature levels<br />
The exhaust gases from preheater, calc<strong>in</strong>ator<br />
<strong>and</strong> kiln, <strong>and</strong> <strong>the</strong> exhaust air from <strong>the</strong> cooler<br />
can be<br />
used for <strong>the</strong> follow<strong>in</strong>g purposes:<br />
- to dry <strong>the</strong> raw materials (applicable<br />
for blast furnace slag, coal, etc.)<br />
- to by-pass to precalc<strong>in</strong>ator<br />
- to generate steam (36-108 MJ/ton cl<strong>in</strong>ker), <strong>and</strong><br />
- to generate electricity us<strong>in</strong>g Organic Rank<strong>in</strong>e Cycle (ORC)<br />
For a cement factory of 1000 ton/day of cl<strong>in</strong>ker capacity, <strong>the</strong> amount of waste heat<br />
recoverable<br />
from various streams can be:<br />
- by-pass gas: 120-241 MJ/ton of cl<strong>in</strong>ker<br />
- cyclone preheater exhaust gas: 388-457 MJ/ton of cl<strong>in</strong>ker<br />
- cl<strong>in</strong>ker cooler exhaust gas: 345-457 MJ/ton of cl<strong>in</strong>ker.<br />
3.2.3 Long term measures<br />
Different long term <strong>energy</strong> <strong>efficiency</strong> measures concern<strong>in</strong>g major modifications<br />
<strong>in</strong> <strong>the</strong><br />
production<br />
process to <strong>in</strong>crease <strong>the</strong> <strong>efficiency</strong> of <strong>the</strong> <strong>in</strong>dustry are discussed below.<br />
3.2.3.1 Conversion from wet to dry process<br />
Conversion of wet process to dry process can lead to better <strong>energy</strong> <strong>efficiency</strong> <strong>and</strong> an<br />
<strong>in</strong>crease <strong>in</strong> cl<strong>in</strong>ker output. The conversion may be ei<strong>the</strong>r full or partial depend<strong>in</strong>g upon <strong>the</strong><br />
characteristics of <strong>the</strong> available raw materials.<br />
The estimated <strong>energy</strong> sav<strong>in</strong>gs due to <strong>the</strong><br />
process<br />
changes are given <strong>in</strong> Table 3.3.<br />
Table 3.3. Energy sav<strong>in</strong>g due to process changes (MJ/kg cl<strong>in</strong>ker)<br />
Action Taken Initial Process New Process Energy Sav<strong>in</strong>g<br />
Replace Wet Dry with preheater 1.8-5.0<br />
Convert Wet Dry with preheater 1.8-4.0<br />
Convert Wet Dry 0.8-1.6<br />
Replace Wet Semi-wet with step-type preheater up to 3.0<br />
Convert Wet Semi-wet with step-type preheater up to 2.5<br />
Replace Wet Wet with spray dryer up to 2.5<br />
Convert Wet Wet with spray dryer up to 2.0<br />
Replace Dry Dry with preheater 0.9-2.0<br />
Convert Dry Dry with preheater 0.9-1.5<br />
Note: - Investment cost of about US$ 10 million for 440 tpd wet kiln<br />
to 550 tpd, 4-<br />
stage preheater conversion (estimated rate of return: 17%).<br />
- Investment cost of about US$ 95 million for 1500 tpd wet kiln to 4300<br />
tpd<br />
4-stage preheater/pre-calc<strong>in</strong>er conversion (estimated rate of return 20%).
18 Technology, Energy Efficiency <strong>and</strong> Environmental Externalities of <strong>the</strong> Cement Industry<br />
3.2.3.2 Cogeneration<br />
Cogeneration would be attractive for fuel sav<strong>in</strong>g <strong>and</strong> better <strong>energy</strong> utilization <strong>in</strong> connection<br />
with <strong>the</strong> conversion of a kiln from wet to dry process. The temperature of <strong>the</strong> kiln exhaust<br />
gases is <strong>in</strong>creased from 180-260°C for <strong>the</strong> wet kiln to around 550-760 °C for <strong>the</strong> dry kiln so<br />
that steam power generation system is possible with waste heat recovery boilers. Electricity<br />
generation of <strong>the</strong> order of 50-100 kWh/ton of cl<strong>in</strong>ker may be feasible. Cogeneration can<br />
lead to <strong>the</strong> follow<strong>in</strong>g benefits:<br />
- facilitate un<strong>in</strong>terrupted kiln operation<br />
- better fuel <strong>efficiency</strong><br />
- lower consumption of refractories<br />
- better cl<strong>in</strong>ker quality<br />
- higher kiln utilization<br />
For a cement factory of 1000 ton/day of cl<strong>in</strong>ker capacity, <strong>the</strong> amount of waste heat<br />
recoverable from various streams can be:<br />
- by-pass gas: 120-241 MJ/ton of cl<strong>in</strong>ker<br />
- cyclone preheater exhaust gas: 388-457 MJ/ton of cl<strong>in</strong>ker<br />
- cl<strong>in</strong>ker cooler exhaust gas: 345-457 MJ/ton of cl<strong>in</strong>ker<br />
3.2.3.3 Computer-controlled system<br />
In <strong>the</strong> cement <strong>in</strong>dustry, all processes are like a cha<strong>in</strong>, one operation l<strong>in</strong>ked to ano<strong>the</strong>r. The<br />
moisture content of slurry will affect <strong>the</strong> quality of cl<strong>in</strong>ker produced. The amount of fuel<br />
fed to <strong>the</strong> fir<strong>in</strong>g system of <strong>the</strong> kiln must be proportional to <strong>the</strong> quantity of slurry fed to <strong>the</strong><br />
kiln. If <strong>the</strong> residence time of mixture <strong>in</strong> <strong>the</strong> kiln is ma<strong>in</strong>ta<strong>in</strong>ed at optimum, <strong>energy</strong> losses<br />
due to overbak<strong>in</strong>g can be avoided. Therefore, it is necessary to control <strong>and</strong> monitor each<br />
function of <strong>the</strong> processes <strong>in</strong>volved to ensure that <strong>the</strong> system is operat<strong>in</strong>g at optimum<br />
condition: i.e., m<strong>in</strong>imal <strong>energy</strong> consumption, maximal output, m<strong>in</strong>imal waste <strong>and</strong> longest<br />
life of equipment.<br />
A fully automated monitor<strong>in</strong>g <strong>and</strong> control system developed by Mitsubishi (MICS),<br />
compris<strong>in</strong>g all stages of <strong>the</strong> process up to <strong>the</strong> storage of cement, is given <strong>in</strong> Table 3.4.<br />
3.3 New Energy Efficient Technologies for Cement Manufactur<strong>in</strong>g<br />
In fact, <strong>the</strong> kiln process <strong>technology</strong> of cement <strong>in</strong>dustry can be said to be at quite a mature<br />
stage. However, due to <strong>the</strong> nature of gradual development of technologies, some<br />
modifications are still go<strong>in</strong>g on. Nowadays, <strong>the</strong> ma<strong>in</strong> area of process improvement is <strong>the</strong><br />
gr<strong>in</strong>d<strong>in</strong>g of cl<strong>in</strong>ker <strong>and</strong> various designs have been emerg<strong>in</strong>g. Automation of <strong>the</strong> cement<br />
manufactur<strong>in</strong>g <strong>and</strong> computerization are also <strong>the</strong> current <strong>in</strong>terests of cement manufacturers.
Energy Issues <strong>in</strong> <strong>the</strong> Cement Industry 19<br />
It is worthwhile to highlight <strong>the</strong> kiln processes which are undergo<strong>in</strong>g modifications <strong>in</strong> order<br />
to improve <strong>the</strong> <strong>energy</strong> <strong>efficiency</strong> <strong>and</strong> <strong>environmental</strong> soundness of <strong>the</strong> cement <strong>in</strong>dustry.<br />
Table 3.4. Operat<strong>in</strong>g ranges, tasks <strong>and</strong> possibilities of applications of MICS<br />
--------------------------------------------------------------------------------------------------------------<br />
Operat<strong>in</strong>g range Tasks <strong>and</strong> functions of MICS<br />
--------------------------------------------------------------------------------------------------------------<br />
Raw material - blend<strong>in</strong>g bed data acquisition <strong>and</strong> process<strong>in</strong>g<br />
blend<strong>in</strong>g bed - controll<strong>in</strong>g <strong>the</strong> blend<strong>in</strong>g of several components<br />
--------------------------------------------------------------------------------------------------------------<br />
Raw mill - raw mill monitor<strong>in</strong>g<br />
- controll<strong>in</strong>g start-up <strong>and</strong> mill performance<br />
- monitor<strong>in</strong>g <strong>the</strong> blend<strong>in</strong>g silo<br />
- monitor<strong>in</strong>g <strong>the</strong> condition<strong>in</strong>g tower <strong>and</strong> electrostatic precipitator<br />
--------------------------------------------------------------------------------------------------------------<br />
Rotary kiln - kiln monitor<strong>in</strong>g<br />
- kiln control dur<strong>in</strong>g start-up<br />
- automation kiln control<br />
- automatic measurement of kiln shell temperatures<br />
- calc<strong>in</strong>er monitor<strong>in</strong>g<br />
--------------------------------------------------------------------------------------------------------------<br />
Coal gr<strong>in</strong>d<strong>in</strong>g mill - coal mill monitor<strong>in</strong>g<br />
- controll<strong>in</strong>g start-up <strong>and</strong> mill performance<br />
--------------------------------------------------------------------------------------------------------------<br />
Cement Gr<strong>in</strong>d<strong>in</strong>g mill - cement mill monitor<strong>in</strong>g<br />
- controll<strong>in</strong>g start-up <strong>and</strong> mill performance<br />
--------------------------------------------------------------------------------------------------------------<br />
Quality control - x-ray fluorescence analysis data process<strong>in</strong>g<br />
- calibrat<strong>in</strong>g <strong>the</strong> analyzers<br />
- controll<strong>in</strong>g <strong>the</strong> raw material proportion<strong>in</strong>g<br />
- adjust<strong>in</strong>g <strong>the</strong> raw meal composition<br />
- check<strong>in</strong>g <strong>the</strong> cement quality<br />
--------------------------------------------------------------------------------------------------------------<br />
Electricity supply - monitor<strong>in</strong>g <strong>the</strong> electric current <strong>and</strong><br />
power consumption<br />
--------------------------------------------------------------------------------------------------------------<br />
Supervision <strong>and</strong> - daily operational reports on <strong>in</strong>dividual sections<br />
documentation of plant<br />
- daily, weekly <strong>and</strong> monthly reports on<br />
plant performance<br />
- ma<strong>in</strong>ta<strong>in</strong><strong>in</strong>g optimum operation of kiln,<br />
raw mill, cement mill <strong>and</strong> coal mill
20 Technology, Energy Efficiency <strong>and</strong> Environmental Externalities of <strong>the</strong> Cement Industry<br />
3.3.1 Suspension preheat<strong>in</strong>g <strong>technology</strong><br />
The suspension system attached to <strong>the</strong> kiln consists of up to six cyclones (usually four or<br />
five). The mixture of raw material is fed <strong>in</strong>to <strong>the</strong> top stage which gradually moves through<br />
<strong>the</strong> cyclones until it enters <strong>the</strong> rotary kiln. The hot kiln exit gases simultaneously move <strong>in</strong><br />
<strong>the</strong> opposite direction <strong>and</strong> <strong>the</strong> highly turbulent mix<strong>in</strong>g action between <strong>the</strong> feed <strong>and</strong> gases<br />
promotes efficient heat exchange, sufficient to <strong>in</strong>duce 40-50% calc<strong>in</strong>ation of <strong>the</strong> raw feed<br />
by <strong>the</strong> time it enters <strong>the</strong> rotary kiln. A large amount of secondary heat is recovered which<br />
helps to lower <strong>the</strong> specific primary <strong>energy</strong> consumption to around 3.15 MJ/kg of cl<strong>in</strong>ker.<br />
3.3.2 Suspension preheat<strong>in</strong>g/precalc<strong>in</strong>ation <strong>technology</strong><br />
This system consists of a four stage suspension preheater, a furnace for precalc<strong>in</strong>ation <strong>and</strong><br />
a rotary kiln. The preheated mixture is precalc<strong>in</strong>ated <strong>in</strong> <strong>the</strong> furnace before enter<strong>in</strong>g <strong>the</strong> kiln.<br />
As a result, <strong>the</strong> raw mix is substantially calc<strong>in</strong>ed (up to a maximum of 85-90%) by <strong>the</strong> time<br />
it enters <strong>the</strong> kiln. The specific <strong>energy</strong> consumption is about 3.15 MJ/kg of cl<strong>in</strong>ker <strong>and</strong> <strong>the</strong><br />
advantage is up to two-third of <strong>the</strong> total fuel requirements can be replaced by low grade<br />
fuels. The flow diagram of suspension preheat<strong>in</strong>g/precalc<strong>in</strong>ation system is shown <strong>in</strong> Figure<br />
3.5.<br />
Raw<br />
material<br />
Burners<br />
Induced draft fan<br />
Material flow<br />
Gas flow<br />
Precalc<strong>in</strong>ation<br />
furnace Secondary air duct<br />
Kiln burner<br />
Kiln Product<br />
Cooler
Energy Issues <strong>in</strong> <strong>the</strong> Cement Industry 21<br />
Figure 3.5. Flow diagram of suspension preheat<strong>in</strong>g/precalc<strong>in</strong>ation system<br />
3.4 Conclud<strong>in</strong>g Remarks<br />
S<strong>in</strong>ce <strong>the</strong> cement <strong>in</strong>dustry is an <strong>energy</strong> <strong>in</strong>tensive high-temperature-process, attention should<br />
be given to <strong>the</strong> recovery of waste heat from <strong>the</strong> various exhaust streams. The housekeep<strong>in</strong>g<br />
measures can lead to lower <strong>energy</strong> consumption as well as proper function<strong>in</strong>g of processes.<br />
The modification <strong>and</strong> replacement of sub-processes by adapt<strong>in</strong>g advanced technologies can<br />
also save significant amount of <strong>energy</strong>.<br />
The low grade fuel substitution <strong>in</strong> cement <strong>in</strong>dustry is found to be beneficial both at <strong>the</strong><br />
macro <strong>and</strong> micro levels. The fuel substitution needs strategic plann<strong>in</strong>g at <strong>the</strong> plant<br />
management level as well as <strong>in</strong>stitutional support from <strong>the</strong> national authorities.<br />
Cogeneration <strong>and</strong> computerization are also <strong>the</strong> improvements which should be<br />
<strong>in</strong>corporated along with process conversion. In most <strong>in</strong>dustrialized countries, <strong>the</strong> wet<br />
process has been completely elim<strong>in</strong>ated. The conversion of wet to dry process is <strong>the</strong><br />
necessary improvement for develop<strong>in</strong>g countries. Therefore, medium <strong>and</strong> long term goals<br />
should be set to take gradual action <strong>in</strong> this direction.
22 Technology, Energy Efficiency <strong>and</strong> Environmental Externalities of <strong>the</strong> Cement Industry<br />
4. ENVIRONMENTAL POLLUTION AND MANAGEMENT<br />
4.1 Sources <strong>and</strong> Characteristics of Pollutants<br />
4.1.1 Water pollution<br />
The largest part of <strong>the</strong> water used <strong>in</strong> cement manufactur<strong>in</strong>g is essentially non pollut<strong>in</strong>g.<br />
Process water is evaporated <strong>and</strong> most cool<strong>in</strong>g water is not contam<strong>in</strong>ated. The water<br />
pollution problems orig<strong>in</strong>at<strong>in</strong>g from cement plants are generally directly related to dust<br />
collection <strong>and</strong>/or dust disposal. The ma<strong>in</strong> sources are:<br />
- raw material wash<strong>in</strong>g <strong>and</strong> beneficiation - produces high pH <strong>and</strong> alkal<strong>in</strong>ity, total<br />
dissolved <strong>and</strong> suspended solids<br />
- process water - only <strong>in</strong> <strong>the</strong> event of spillage<br />
- dust control - uses wet scrubbers to collect kiln dust from effluent gases.<br />
- dust leach<strong>in</strong>g - dry dust is mixed <strong>in</strong> a slurry <strong>and</strong> placed <strong>in</strong> a clarifier for settl<strong>in</strong>g,<br />
<strong>the</strong> under flow of which is returned to <strong>the</strong> kiln. The overflow conta<strong>in</strong><strong>in</strong>g high<br />
pH, alkal<strong>in</strong>ity, suspended solids, dissolved solids, potassium <strong>and</strong> sulfate is<br />
discharged. This constitutes <strong>the</strong> most severe water pollution problem <strong>in</strong> <strong>the</strong><br />
<strong>in</strong>dustry.<br />
- dust disposal - collected dust is mixed <strong>in</strong>to slurry <strong>and</strong> fed <strong>in</strong>to a pond for solid<br />
settl<strong>in</strong>g. Settled solids are not recovered <strong>and</strong> <strong>the</strong> overflow (leachate) is<br />
discharged.<br />
Only <strong>in</strong> exceptional cases, seepage water from dumps or stockpiles will have to be<br />
considered. The process water used <strong>in</strong> cement manufactur<strong>in</strong>g is required for condition<strong>in</strong>g<br />
<strong>the</strong> exit gases or for <strong>the</strong> treatment of <strong>the</strong> raw meal <strong>in</strong> wet-process <strong>and</strong> grate preheater kilns.<br />
As this water evaporates <strong>in</strong>to <strong>the</strong> atmosphere, it is <strong>the</strong>refore not discharged as waste water.<br />
4.1.2 Air pollution<br />
Among <strong>the</strong> pollution problems associated with cement <strong>in</strong>dustry, air pollution is<br />
undoubtedly <strong>the</strong> most significant one. Mak<strong>in</strong>g 1 ton of cement requires <strong>the</strong> gr<strong>in</strong>d<strong>in</strong>g of<br />
about 2.5 tons of raw materials, <strong>in</strong>termediate products <strong>and</strong> solid fuels to a dust-like<br />
f<strong>in</strong>eness. Fur<strong>the</strong>rmore, even with heat-sav<strong>in</strong>g methods, about 100-110 kg of coal equivalent<br />
(with a flame temperature of over 1500 o C) is needed per ton of cement. Depend<strong>in</strong>g on <strong>the</strong><br />
process employed <strong>and</strong> <strong>the</strong> degree of sophistication of a cement plant, <strong>the</strong> manufacture of 1<br />
kg of cement gives rise to between 6 <strong>and</strong> 14 m 3 of exhaust air <strong>and</strong> gas. These quantities of<br />
air <strong>and</strong> gas have to be cleaned before be<strong>in</strong>g discharged <strong>in</strong>to <strong>the</strong> atmosphere. Besides <strong>the</strong><br />
particulate emissions, <strong>the</strong>se gaseous pollutants play an important part <strong>in</strong> <strong>the</strong> air pollution.<br />
The gases from <strong>the</strong> kilns are generally identified as CO, CO2 <strong>and</strong> nitrogen oxides. Oxides<br />
of sulfur are ei<strong>the</strong>r absent or present only as a trace quantity depend<strong>in</strong>g on <strong>the</strong> sulfur<br />
content of <strong>the</strong> coal used <strong>and</strong> also because sulfur oxides are absorbed <strong>in</strong> <strong>the</strong> kiln dur<strong>in</strong>g <strong>the</strong><br />
cl<strong>in</strong>ker<strong>in</strong>g process. Hydrocarbons <strong>and</strong> o<strong>the</strong>r organic identities <strong>in</strong> <strong>the</strong> exit gases are absent if<br />
coal is used as <strong>the</strong> fuel.
Environmental Pollution <strong>and</strong> Management 23<br />
4.1.2.1 Particulates<br />
While <strong>the</strong>re are various sources of dust generation <strong>in</strong> a cement plant, <strong>the</strong> kiln generates <strong>the</strong><br />
largest quantities of dust <strong>and</strong> gases. It is well known that <strong>the</strong> nature <strong>and</strong> quantity of dust<br />
<strong>and</strong> gases from kilns depend on <strong>the</strong> characteristics of raw materials, fuel, process, burn<strong>in</strong>g<br />
conditions, kiln dimensions, system used, etc., which <strong>in</strong> turn govern <strong>the</strong> choice of <strong>the</strong> dust<br />
collection system <strong>and</strong> its <strong>efficiency</strong>. The largest air pollutants <strong>in</strong> cement plants are <strong>the</strong><br />
particulate emissions, which consist of carbonates, silicates, alum<strong>in</strong>ates, fluorides <strong>and</strong> alkali<br />
halides, emitted through gasses at temperature of 120-350 o C. The chemical characteristics<br />
of <strong>the</strong> pollutants reflect <strong>the</strong> raw-mix composition <strong>and</strong> fuel quality. The use of lower grade<br />
raw materials leads to generation of kiln dust richer <strong>in</strong> SiO2 <strong>and</strong> alkali halides. The use of<br />
lower grade limestone also leads to relatively higher quantities of particulate matter <strong>and</strong> <strong>the</strong><br />
particles <strong>in</strong> this case are relatively small.<br />
4.1.2.2 Gaseous Substances<br />
Beside <strong>the</strong> airborne emissions (dusts), every combustion process gives rise to gaseous<br />
emission. The nature <strong>and</strong> quantity of <strong>the</strong> gases produced are specifically bound up with <strong>the</strong><br />
process <strong>in</strong> question <strong>and</strong> depend on <strong>the</strong> fuels, <strong>the</strong> combustion atmosphere <strong>and</strong> <strong>the</strong><br />
temperature. In fir<strong>in</strong>g systems <strong>in</strong>volv<strong>in</strong>g direct contact between combustion gases <strong>and</strong> solid<br />
feed material, <strong>the</strong> <strong>in</strong>itial materials employed are moreover to be rated among <strong>the</strong> pr<strong>in</strong>cipal<br />
<strong>in</strong>fluenc<strong>in</strong>g factors. The exit gases from cement kilns consist ma<strong>in</strong>ly of nitrogen oxides,<br />
carbon dioxide, oxygen <strong>and</strong> water vapor. In addition, <strong>the</strong>y may conta<strong>in</strong> small amounts of<br />
sulfur dioxide, nitrogen oxides, carbon monoxide <strong>and</strong> organic hydrocarbons. For product<br />
quality <strong>and</strong> process economy, <strong>the</strong> burn<strong>in</strong>g of cement cl<strong>in</strong>ker normally requires an oxidiz<strong>in</strong>g<br />
atmosphere <strong>and</strong> a temperature of over 1500 o C <strong>in</strong> <strong>the</strong> kiln, so that <strong>the</strong> exit gases conta<strong>in</strong><br />
only harmless amounts of carbon monoxide <strong>and</strong> hydrocarbons, if at all. Gaseous chlor<strong>in</strong>e<br />
<strong>and</strong> fluor<strong>in</strong>e compounds are not emitted, because <strong>the</strong>y are comb<strong>in</strong>ed with <strong>the</strong> alkal<strong>in</strong>e kiln<br />
feed. Highly volatile compounds may eventually be released <strong>in</strong>dependently of burn<strong>in</strong>g<br />
process.<br />
(i) Sulfur dioxide<br />
Sulfur is <strong>in</strong>troduced with <strong>the</strong> raw materials <strong>and</strong> fuels <strong>in</strong> <strong>the</strong> cement burn<strong>in</strong>g process. The<br />
sulfur compounds <strong>in</strong> <strong>the</strong> fuel first of all form SO2. If <strong>the</strong> raw materials conta<strong>in</strong> pyrite or<br />
organic sulfides, some of <strong>the</strong>se sulfides will oxidize to SO2 at temperatures as low as 450-<br />
600oC, correspond<strong>in</strong>g to <strong>the</strong> top stages <strong>in</strong> a preheater. Here, <strong>the</strong> absorption of SO2 is<br />
extremely low, <strong>and</strong> a substantial part passes out of <strong>the</strong> kiln system. In <strong>the</strong>se cases, <strong>the</strong>refore,<br />
<strong>the</strong> kiln exit gases will always conta<strong>in</strong> SO2. The sulfur dioxide formed by dissociation <strong>and</strong><br />
combustion reacts chiefly with alkalis of <strong>the</strong> raw materials, giv<strong>in</strong>g rise to <strong>the</strong> formation of<br />
alkali sulfate which is <strong>in</strong>corporated <strong>in</strong> <strong>the</strong> cl<strong>in</strong>ker or <strong>the</strong> dust <strong>and</strong> thus discharged from <strong>the</strong><br />
kiln system. In addition, sulfur dioxide reacts with calcium oxide from <strong>the</strong> calcim<strong>in</strong>ed raw<br />
meal to give calcium sulfate <strong>in</strong> an oxidiz<strong>in</strong>g kiln atmosphere. This reaction is not conf<strong>in</strong>ed
24 Technology, Energy Efficiency <strong>and</strong> Environmental Externalities of <strong>the</strong> Cement Industry<br />
to <strong>the</strong> kiln itself, but cont<strong>in</strong>ues <strong>in</strong> <strong>the</strong> condition<strong>in</strong>g tower <strong>and</strong> gr<strong>in</strong>d<strong>in</strong>g/dry<strong>in</strong>g plant, <strong>in</strong><br />
which <strong>the</strong> fresh reactive surface area formed <strong>in</strong> <strong>the</strong> gr<strong>in</strong>d<strong>in</strong>g process strongly promotes this<br />
reaction <strong>in</strong> <strong>the</strong> presence of water vapor. If sulfuric or organically comb<strong>in</strong>ed sulfur is present<br />
<strong>and</strong> <strong>the</strong> excess air is <strong>in</strong>sufficient, SO2 may be released even at relatively low temperatures<br />
from <strong>the</strong> preheater of <strong>the</strong> kiln plant. The emission of SO2 can, however, be reduced by<br />
pass<strong>in</strong>g <strong>the</strong> gas through a gr<strong>in</strong>d<strong>in</strong>g/dry<strong>in</strong>g mill to a condition<strong>in</strong>g tower. The cement<br />
burn<strong>in</strong>g process <strong>and</strong> gr<strong>in</strong>d<strong>in</strong>g process are thus function as ideal desulfuris<strong>in</strong>g systems <strong>in</strong><br />
which well <strong>in</strong> excess of 90 percent of SO2 is reta<strong>in</strong>ed. That is why it is generally possible to<br />
use fuels with high sulfur content <strong>in</strong> <strong>the</strong> cement <strong>in</strong>dustry without harmful consequences to<br />
<strong>the</strong> environment. The <strong>in</strong>troduction of a m<strong>in</strong>imum amount of sulfur for comb<strong>in</strong><strong>in</strong>g <strong>the</strong> raw<br />
material alkalis as sulfate is <strong>in</strong>deed desirable to achieve better product quality.<br />
(ii) Nitrogen oxides<br />
NO formation takes place by means of two mechanisms. By <strong>the</strong> first mechanism, <strong>the</strong><br />
<strong>the</strong>rmal NO is formed <strong>in</strong> <strong>the</strong> kiln burn<strong>in</strong>g zone from <strong>the</strong> content of nitrogen <strong>in</strong> <strong>the</strong><br />
atmosphere. The quantity is determ<strong>in</strong>ed ma<strong>in</strong>ly by temperature <strong>and</strong> excess oxygen. By <strong>the</strong><br />
second mechanism, <strong>the</strong> fuel NO is formed. In this <strong>in</strong>stance, <strong>the</strong> content of volatiles <strong>and</strong><br />
nitrogen <strong>in</strong> <strong>the</strong> fuel, as well as excess oxygen are <strong>the</strong> decid<strong>in</strong>g factors. The fuel NO<br />
formation is of secondary importance <strong>in</strong> <strong>the</strong> burn<strong>in</strong>g zone as <strong>the</strong> temperature at this po<strong>in</strong>t<br />
is so high that considerable <strong>the</strong>rmal NO is formed anyway. With secondary fir<strong>in</strong>g, as <strong>in</strong><br />
precalc<strong>in</strong>ers, <strong>the</strong> fuel NO is of importance. The emissions of nitrogen oxides from <strong>the</strong><br />
cement manufactur<strong>in</strong>g process are much more difficult to reduce. For reasons of quality,<br />
<strong>the</strong> cement kiln has to be operated with high combustion temperatures <strong>and</strong> excess air;<br />
under <strong>the</strong>se conditions <strong>the</strong> nitrogen oxide formed is more particularly <strong>the</strong> <strong>the</strong>rmal NO. Gas<br />
measurements carried out <strong>in</strong> various parts of <strong>the</strong> world have revealed widely differ<strong>in</strong>g<br />
amounts of NOx emission from cement kilns, rang<strong>in</strong>g from about 150 to over 1000 ppm<br />
(Kroboth et al. 1987). As opposed to what had been found with SO2 emission, <strong>the</strong>re was<br />
no ascerta<strong>in</strong>able elim<strong>in</strong>ation of NOx <strong>in</strong> condition<strong>in</strong>g tower or gr<strong>in</strong>d<strong>in</strong>g/dry<strong>in</strong>g plants<br />
associated with <strong>the</strong> kilns. The reduced concentrations of NOx measured <strong>in</strong> those<br />
<strong>in</strong>stallations was entirely due to dilution with process air. A large number of short-term <strong>and</strong><br />
long-term <strong>in</strong>vestigations have meanwhile revealed that <strong>the</strong> follow<strong>in</strong>g factors are of<br />
qualitative importance to nitrogen oxide formation dur<strong>in</strong>g <strong>the</strong> cl<strong>in</strong>ker burn<strong>in</strong>g process: <strong>the</strong><br />
fuel used, <strong>the</strong> design <strong>and</strong> operation of precalc<strong>in</strong><strong>in</strong>g system or <strong>the</strong> secondary fir<strong>in</strong>g methods<br />
employed, <strong>the</strong> characteristic properties of secondary fuels, <strong>the</strong> burnability of <strong>the</strong> feed<br />
material, <strong>the</strong> flame temperature, <strong>the</strong> flame shape, <strong>the</strong> burner or its sett<strong>in</strong>g, <strong>and</strong> <strong>the</strong> excess air<br />
factor. The variations <strong>in</strong> <strong>the</strong> NOx content of <strong>the</strong> cleaned gas discharged from a kiln plant,<br />
as determ<strong>in</strong>ed <strong>in</strong> long-term measurements, are plotted <strong>in</strong> Figures 4.1.a <strong>and</strong> 4.1.b. Dur<strong>in</strong>g<br />
<strong>the</strong> course of <strong>the</strong> day as represented <strong>in</strong> Figure 4.1.a <strong>the</strong> kiln functioned trouble-free,<br />
produc<strong>in</strong>g cl<strong>in</strong>ker with between 0.7 <strong>and</strong> 1.2 percent of free lime. The NOx emission<br />
behavior of <strong>the</strong> same kiln over a long period is shown <strong>in</strong> Figure 4.1.b.
Environmental Pollution <strong>and</strong> Management 25<br />
Fig. 4.1a. Daily variation of NO emissions of a rotary kiln<br />
Fig. 4.1b. Daily variation of NO emissions of a rotary kiln (over a long period)
26 Technology, Energy Efficiency <strong>and</strong> Environmental Externalities of <strong>the</strong> Cement Industry<br />
4.1.3 Solid waste<br />
The major solid waste from cement <strong>in</strong>dustry is <strong>the</strong> dust collected from <strong>the</strong> air pollution<br />
control equipment. In addition, used refractories are also to be disposed of.<br />
4.2 Current Pollution Abatement Strategy <strong>and</strong> Technologies<br />
4.2.1 Air pollution control<br />
Pollution abatement <strong>in</strong> cement <strong>in</strong>dustry <strong>in</strong>volves ma<strong>in</strong>ly prevention of air <strong>and</strong> water<br />
protection. By early 1980’s <strong>the</strong> average specific heat consumption for cement manufacture<br />
steadily decreased due to <strong>the</strong> change over to <strong>energy</strong>-sav<strong>in</strong>g preheater kilns <strong>and</strong> to waste<br />
heat utilization techniques. In contrast with <strong>the</strong> heat consumption, <strong>the</strong> specific electric<br />
power consumption slightly <strong>in</strong>creased. This is due, among o<strong>the</strong>r factors, to <strong>the</strong> newly built<br />
coal gr<strong>in</strong>d<strong>in</strong>g plants <strong>and</strong> to <strong>the</strong> <strong>in</strong>creas<strong>in</strong>gly str<strong>in</strong>gent requirements to be fulfilled by<br />
<strong>environmental</strong> protection. Thus, <strong>the</strong>se factors should be considered when decid<strong>in</strong>g <strong>the</strong><br />
<strong>environmental</strong> st<strong>and</strong>ards.<br />
The overall dust emission values can be steadily reduced with <strong>the</strong> aid of advances <strong>in</strong><br />
dedust<strong>in</strong>g <strong>technology</strong> <strong>and</strong> of process eng<strong>in</strong>eer<strong>in</strong>g changes. It has been proved that <strong>the</strong> dust<br />
emission levels can be reduced not only dur<strong>in</strong>g normal plant operation, but more<br />
particularly also dur<strong>in</strong>g start-up <strong>and</strong> shut-down (Kroboth et al, 1987). For example, <strong>in</strong> <strong>the</strong><br />
case of grate pre-heater kilns, <strong>the</strong> auxiliary chimney as a source of emission has been<br />
elim<strong>in</strong>ated. Instead, while <strong>the</strong> grate is stopped, <strong>the</strong> hot kiln exit gases are so conditioned<br />
with added air <strong>and</strong> water that even dur<strong>in</strong>g heat<strong>in</strong>g-up <strong>and</strong> cool<strong>in</strong>g-down of <strong>the</strong> kiln <strong>the</strong>y can<br />
be dedusted <strong>in</strong> <strong>the</strong> kiln’s dust collect<strong>in</strong>g unit. A remarkable decrease <strong>in</strong> dust emissions <strong>in</strong><br />
<strong>the</strong> vic<strong>in</strong>ity of cement plant can be atta<strong>in</strong>ed by elim<strong>in</strong>ation of <strong>the</strong> so-called diffuse dust<br />
sources. For this, enclosed build<strong>in</strong>gs <strong>and</strong> silos for cl<strong>in</strong>ker storage have to be build up.<br />
4.2.1.1 Dust collect<strong>in</strong>g devices<br />
It is <strong>the</strong> physical characteristics, such as total dust load, particle size distribution, bulk<br />
density, electrical resistivity <strong>and</strong> gas volume which normally determ<strong>in</strong>e <strong>the</strong> selection of<br />
suitable <strong>and</strong> efficient collection system, as some of <strong>the</strong>se characteristics limit <strong>the</strong> power<br />
<strong>in</strong>put <strong>and</strong> collection <strong>efficiency</strong>. Dedust<strong>in</strong>g equipment <strong>in</strong> <strong>the</strong> form of filter<strong>in</strong>g or of<br />
electrostatic precipitat<strong>in</strong>g units to reduce dust emission is employed <strong>in</strong> <strong>the</strong> cement <strong>in</strong>dustry.<br />
Inertia-force separators are now used only for pre-clean<strong>in</strong>g purposes, e.g., for protection of<br />
fans, or are <strong>in</strong>tegrally <strong>in</strong>corporated <strong>in</strong> <strong>the</strong> filter or precipitator systems. Formerly, cyclone<br />
collectors were considered adequate for both kiln stack <strong>and</strong> cooler stack (pr<strong>in</strong>cipal<br />
particulate emission sources) because <strong>the</strong>y prevented nuisance dust-fall conditions. Now,<br />
however, opacity <strong>and</strong> discharge weight require more efficient collection equipment. Fabric<br />
filters are generally used for <strong>the</strong> dedust<strong>in</strong>g of primary crush<strong>in</strong>g operations, materials<br />
h<strong>and</strong>l<strong>in</strong>g, raw meal blend<strong>in</strong>g <strong>and</strong> silo discharge operations, whereas gr<strong>in</strong>d<strong>in</strong>g <strong>and</strong> dry<strong>in</strong>g<br />
<strong>in</strong>stallations (<strong>in</strong>clud<strong>in</strong>g those for coal) are dedusted with electrostatic precipitators or with
Environmental Pollution <strong>and</strong> Management 27<br />
fabric filters. The latter appear to be better suited to cope with transitional <strong>and</strong> upset<br />
conditions because <strong>the</strong>ir function<strong>in</strong>g is <strong>in</strong>dependent of <strong>the</strong> condition<strong>in</strong>g of <strong>the</strong> dust-laden<br />
gases.<br />
For this reason, it is preferable to use fabric filters <strong>in</strong> every practicable case. Experience <strong>in</strong><br />
<strong>the</strong> cement <strong>in</strong>dustry shows that electrostatic precipitators <strong>and</strong> fabric filters of equally<br />
advanced technical development <strong>and</strong> suitable design perform equally well with regard to<br />
dust collection <strong>efficiency</strong>, but not with regard to <strong>the</strong>ir behavior <strong>in</strong> cop<strong>in</strong>g with special dusts,<br />
high temperatures <strong>and</strong> vary<strong>in</strong>g conditions of plant operation. In view of <strong>the</strong>se<br />
considerations, electrostatic precipitators have been adopted world-wide for clean<strong>in</strong>g <strong>the</strong><br />
kiln exit gas, whereas for clean<strong>in</strong>g <strong>the</strong> air discharged from cl<strong>in</strong>ker coolers <strong>the</strong> dedust<strong>in</strong>g<br />
equipment currently used comprises granular bed filters, fabric filters or electrostatic<br />
precipitators. The gaseous discharge from a dry process kiln conta<strong>in</strong>s <strong>in</strong>sufficient moisture<br />
for satisfactory ESP operation unless it has been used to dry <strong>the</strong> raw material. Its<br />
temperature may be too high, <strong>in</strong> which case <strong>the</strong> gases must first be cooled by air dilution,<br />
radiation from cool<strong>in</strong>g loops, or humidification. After humidification, dry process kiln<br />
gases can be controlled by ESP. Bag collectors may be preferred if <strong>the</strong> gas cool<strong>in</strong>g has been<br />
accomplished by air dilution (which <strong>in</strong>creases <strong>the</strong> gas volume requir<strong>in</strong>g treatment) or by<br />
radiation. For wet process kilns, <strong>the</strong> ESP has general acceptance. There are, moreover,<br />
cl<strong>in</strong>ker cool<strong>in</strong>g systems which do not produce exhaust air, namely, rotary coolers <strong>and</strong><br />
planetary coolers. Fur<strong>the</strong>rmore, grate coolers embody<strong>in</strong>g <strong>the</strong> so-called duo-<strong>the</strong>rm operat<strong>in</strong>g<br />
system with <strong>in</strong>termediate cool<strong>in</strong>g, which do not discharge exhaust air <strong>in</strong>to <strong>the</strong> atmosphere<br />
ei<strong>the</strong>r, have proved <strong>the</strong>ir suitability. The emission of heavy metals can be kept to very low<br />
values by means of high-<strong>efficiency</strong> dust collect<strong>in</strong>g equipment <strong>and</strong> suitable process control.<br />
(i) Cyclone separators<br />
Cyclone separators (mechanical precipitation) utilize a centrifugal force generated by a<br />
sp<strong>in</strong>n<strong>in</strong>g gas stream to separate <strong>the</strong> particulate matter from <strong>the</strong> carrier gas (Rao, 1994). It<br />
can be used at high temperature <strong>and</strong> is suitable where coarse particles are present.<br />
Particulates are removed from kiln gases by electrostatic precipitators or fabric bag<br />
collectors, ei<strong>the</strong>r of which may be preceded by cyclone collectors. Scrubbers have had very<br />
little applications because of <strong>the</strong> problems <strong>in</strong> h<strong>and</strong>l<strong>in</strong>g particulates which react with water.<br />
(ii) Fabric filters<br />
Because of <strong>the</strong> modest dimensions, better ma<strong>in</strong>tenance possibilities, greater reliability <strong>and</strong><br />
lower capital cost, fabric filter systems operat<strong>in</strong>g with compressed air (reverse-pulse)<br />
clean<strong>in</strong>g have ga<strong>in</strong>ed wide acceptance. Filters with low-pressure or reverse-flow clean<strong>in</strong>g<br />
are now seldom used.<br />
While fabric filters have no rivals <strong>in</strong> <strong>the</strong> dedust<strong>in</strong>g of air from materials h<strong>and</strong>l<strong>in</strong>g<br />
equipment, b<strong>in</strong>s <strong>and</strong> silos, <strong>the</strong>y have, <strong>in</strong> experience so far ga<strong>in</strong>ed, not proved satisfactory <strong>in</strong><br />
conjunction with kiln plants because of <strong>the</strong> peak temperatures that occur, <strong>the</strong> special
28 Technology, Energy Efficiency <strong>and</strong> Environmental Externalities of <strong>the</strong> Cement Industry<br />
properties of kiln dusts <strong>and</strong> <strong>the</strong> critical conditions associated with start-up <strong>and</strong> change-over<br />
operations. Fabric filters have <strong>in</strong>deed been used, <strong>in</strong> a very few cases, for clean<strong>in</strong>g <strong>the</strong> gases<br />
from heat-economiz<strong>in</strong>g preheater kilns. With <strong>the</strong>se kiln systems difficulties arise ma<strong>in</strong>ly on<br />
account of <strong>the</strong> very sticky f<strong>in</strong>e dust particles which rapidly choke <strong>the</strong> filter fabric, result<strong>in</strong>g<br />
<strong>in</strong> high resistance, heavy power consumption <strong>and</strong> reduced throughput rates. The air<br />
pressure used for filter clean<strong>in</strong>g is limited by <strong>the</strong> stresses that <strong>the</strong> fabric can resist.<br />
Investigations show that <strong>the</strong> rate of wear rises with <strong>in</strong>creas<strong>in</strong>g air pressure <strong>in</strong> reverse-pulse<br />
clean<strong>in</strong>g. Fur<strong>the</strong>rmore, for reasons of clean<strong>in</strong>g <strong>and</strong> manipulation <strong>the</strong>re are limits to <strong>the</strong> size<br />
of <strong>the</strong> filter bags. For <strong>the</strong>se reasons, <strong>the</strong> fabric filters used <strong>in</strong> conjunction with big kilns,<br />
with well <strong>in</strong> excess of 100,000 cubic meters of exit gas to be treated per hour, comprise<br />
thous<strong>and</strong>s of <strong>in</strong>dividual bags. On account of this, capital cost <strong>and</strong> expenditure on repairs<br />
are high. Besides, such filters are difficult to monitor <strong>in</strong> cont<strong>in</strong>uos operation. It is virtually<br />
impossible, with such large numbers of bags, to p<strong>in</strong>po<strong>in</strong>t a defective bag <strong>and</strong> change it<br />
promptly.<br />
(iii) Electrostatic precipitator<br />
The fundamental pr<strong>in</strong>ciple of electrostatic precipitation has rema<strong>in</strong>ed unchanged for many<br />
years. In matters of detail, however, <strong>the</strong>re have been important developments, <strong>in</strong> recent<br />
years. As a result, not only has <strong>the</strong> precipitation <strong>in</strong> cont<strong>in</strong>uos operation been improved, but<br />
also <strong>the</strong> operational reliability under abnormal service conditions.<br />
Changes <strong>in</strong> precipitator design, such as greater duct width (wider collector electrode<br />
spac<strong>in</strong>g) <strong>and</strong> new shapes <strong>and</strong> materials for <strong>the</strong> discharge electrodes <strong>and</strong> collector electrodes,<br />
have resulted <strong>in</strong> a lower<strong>in</strong>g of cleaned gas dust contents <strong>and</strong> yielded advantages <strong>in</strong> terms of<br />
capital cost <strong>and</strong> ma<strong>in</strong>tenance <strong>and</strong> repair expenses. The technological optimization of <strong>the</strong><br />
dust-laden gas admission <strong>and</strong> condition<strong>in</strong>g procedures by means of control systems <strong>and</strong><br />
process computers, <strong>the</strong> use of microprocessors for precipitator voltage control <strong>and</strong><br />
rapp<strong>in</strong>g, <strong>and</strong> <strong>the</strong> use of pulse generators have helped to achieve better dedust<strong>in</strong>g dur<strong>in</strong>g<br />
transitional operat<strong>in</strong>g conditions.<br />
The most difficult dedust<strong>in</strong>g conditions <strong>in</strong> <strong>the</strong> cement <strong>in</strong>dustry often occur <strong>in</strong> connection<br />
with cyclone preheater kilns. The st<strong>and</strong>ard solution for such a kiln, which is usually<br />
operated with exit gas utilization, consists <strong>in</strong> clean<strong>in</strong>g <strong>the</strong> exit gas <strong>in</strong> an electrostatic<br />
precipitator preceded by a condition<strong>in</strong>g tower. S<strong>in</strong>ce operation with condition<strong>in</strong>g towers<br />
requires much ma<strong>in</strong>tenance, especially with unfavorable dust resistivity, when exit gas<br />
temperatures of 130 o C <strong>and</strong> lower have to be atta<strong>in</strong>ed, solutions have been devised<br />
compris<strong>in</strong>g separate precipitators for <strong>the</strong> kiln <strong>and</strong> mill. In order to reduce cost it has been<br />
endeavored <strong>in</strong> some cases, by mak<strong>in</strong>g use of pulse generators, to manage with only one<br />
precipitator despite <strong>the</strong> absence of a cool<strong>in</strong>g tower (Kroboth et al., 1987). ESPs are<br />
sensitive to gas charecteristics (such as temperature) <strong>and</strong> to voltage variation. Baghouse is<br />
generally regarded as more reliable <strong>in</strong> this respect. The overall costs of <strong>the</strong> two systems are<br />
similar; <strong>the</strong> choice of system will depend on <strong>the</strong> flue gas charecteristics <strong>and</strong> local<br />
considerations.
Environmental Pollution <strong>and</strong> Management 29<br />
4.2.1.2 Gaseous emission control<br />
Careful control of excess air <strong>in</strong> both kiln <strong>and</strong> calc<strong>in</strong>er is necessary to keep <strong>the</strong> SO2 <strong>and</strong> NO<br />
concentration at m<strong>in</strong>imum. To achieve low NO concentration, a high precalc<strong>in</strong>er <strong>and</strong> low<br />
burn<strong>in</strong>g zone temperature should be used. If <strong>the</strong> kiln feed conta<strong>in</strong>s pyrites, SO2 emission is<br />
unavoidable. If <strong>the</strong> required limits for SO2 <strong>and</strong> NO concentrations cannot be achieved<br />
with<strong>in</strong> <strong>the</strong> actual production process, o<strong>the</strong>r documented methods must be used, e.g. <strong>the</strong><br />
NH3 <strong>in</strong>jection <strong>in</strong> preheater bottom to remove NO, <strong>and</strong> lime or limestone scrubb<strong>in</strong>g to<br />
remove SO2, as is practiced <strong>in</strong> <strong>the</strong>rmal power plants.<br />
The required particulate removal from <strong>the</strong> kiln <strong>and</strong> cl<strong>in</strong>ker cooler exhausts is 99.9% of all<br />
particulates <strong>and</strong> 95.5% of particulates that are less than 10 microns <strong>in</strong> size (PM10). These<br />
removal efficiencies are to be achieved at least 95% of <strong>the</strong> time that <strong>the</strong> plant is operat<strong>in</strong>g.<br />
In operational terms, <strong>the</strong>se requirements correspond to an emission level of 50 mg/Nm 3<br />
particulates under full load conditions. This level is based on values that are rout<strong>in</strong>ely<br />
achieved <strong>in</strong> well run plants (World Bank, 1995).<br />
The follow<strong>in</strong>g po<strong>in</strong>ts summarize <strong>the</strong> key production <strong>and</strong> control practices that will lead to<br />
compliance with emission requirements:<br />
- give reference to <strong>the</strong> dry process,<br />
- adopt <strong>the</strong> follow<strong>in</strong>g pollution prevention measures to m<strong>in</strong>imize air emissions:<br />
- <strong>in</strong>stall equipment covers for crush<strong>in</strong>g, gr<strong>in</strong>d<strong>in</strong>g <strong>and</strong> mill<strong>in</strong>g operations,<br />
- use adjustable conveyors to m<strong>in</strong>imize drop distances,<br />
- wet down <strong>in</strong>termediate <strong>and</strong> f<strong>in</strong>ished product storage files,<br />
- use low NOx burners with optimum level of excess air,<br />
- use low sulfur fuels <strong>in</strong> <strong>the</strong> kiln.<br />
- operate control systems to achieve <strong>the</strong> required emission levels.<br />
4.2.2 Water pollution control<br />
In general, <strong>the</strong> <strong>environmental</strong> protection problems associated with water are m<strong>in</strong>or ones <strong>in</strong><br />
<strong>the</strong> cement <strong>in</strong>dustry. However, statuary requirements restrict<strong>in</strong>g <strong>the</strong> extraction of water<br />
from available sources or requir<strong>in</strong>g separate treatment of cool<strong>in</strong>g <strong>and</strong> surface water may<br />
<strong>in</strong>volve substantial capital expenditure (Kroboth et al., 1987). For leach<strong>in</strong>g, <strong>the</strong> ma<strong>in</strong><br />
treatment <strong>and</strong> control method <strong>in</strong>volves segregation of dust-contact streams <strong>and</strong><br />
neutralization with stack gases followed by sedimentation with recycl<strong>in</strong>g <strong>and</strong> reuse of<br />
wastewater. Devices employed <strong>in</strong>clude:<br />
- cool<strong>in</strong>g towers or ponds to reduce <strong>the</strong> temperature of cool<strong>in</strong>g process waters<br />
- settl<strong>in</strong>g ponds to reduce <strong>the</strong> concentration of suspended solids<br />
- contam<strong>in</strong>ant ponds to dispose of waste kiln dust<br />
- clarifiers to separate solids <strong>in</strong> dust-leach<strong>in</strong>g operations.
30 Technology, Energy Efficiency <strong>and</strong> Environmental Externalities of <strong>the</strong> Cement Industry<br />
Pollution of waterways caused by storage piles runoff <strong>and</strong> dust contam<strong>in</strong>ation can be<br />
reduced by locat<strong>in</strong>g storage piles where storm waters would be conta<strong>in</strong>ed, pav<strong>in</strong>g areas<br />
used by vehicles <strong>and</strong> frequently build<strong>in</strong>g ditches around <strong>the</strong> plant area dra<strong>in</strong><strong>in</strong>g to a hold<strong>in</strong>g<br />
sump.<br />
As stated earlier, very few operations <strong>in</strong> <strong>the</strong> manufactur<strong>in</strong>g of cement add pollutants to <strong>the</strong><br />
water used. For <strong>the</strong> most part, with <strong>the</strong> exception of leach<strong>in</strong>g systems, pollution results<br />
from practices that allow materials to come <strong>in</strong> contact with water. Pollutant levels can be<br />
greatly reduced or even elim<strong>in</strong>ated by <strong>in</strong>stitut<strong>in</strong>g “good house keep<strong>in</strong>g” practice or more<br />
extensive reuse <strong>and</strong> recycl<strong>in</strong>g of contam<strong>in</strong>ated waters.<br />
4.2.3 Solid waste disposal<br />
The treatment <strong>and</strong> use of <strong>the</strong> waste materials aris<strong>in</strong>g from <strong>the</strong> production process of <strong>the</strong><br />
cement <strong>in</strong>dustry generally presents no problems. The dust particles can be added to <strong>the</strong><br />
<strong>in</strong>termediate <strong>and</strong> end products without impair<strong>in</strong>g <strong>the</strong>ir quality <strong>and</strong> without any<br />
disadvantages to <strong>the</strong> environment. Problems may arise <strong>in</strong> special case, however, when<br />
substantial quantities of kiln dust conta<strong>in</strong><strong>in</strong>g heavy metals have to be elim<strong>in</strong>ated <strong>and</strong> can be<br />
deposited on special waste dumps only after undergo<strong>in</strong>g appropriate treatment.<br />
Fur<strong>the</strong>rmore, waste disposal problems are to be expected at cement plants which, <strong>in</strong> order<br />
to produce low-alkali cl<strong>in</strong>ker, are obliged constantly to discard large quantities of kiln dust<br />
<strong>and</strong> bypass dust. The controlled dump<strong>in</strong>g of such dusts, as is still allowed <strong>in</strong> some<br />
countries, is bound to <strong>in</strong>creas<strong>in</strong>gly attract <strong>the</strong> attention of nature conservationists. The<br />
market for this dust (as, for example, fertilizers) are limited, though for some soils it can be<br />
very beneficial. In some recent tests, cement dust has been fed to cattle as a gra<strong>in</strong><br />
supplement, <strong>and</strong> <strong>the</strong> cattle appear to thrive (Sell, 1992). Some has also been used as a filler<br />
<strong>in</strong> road beds, <strong>and</strong> as an aggregate <strong>in</strong> <strong>the</strong> production of cement blocks. Regardless of <strong>the</strong>se<br />
possible markets, however, <strong>the</strong> majority must be disposed of <strong>in</strong> l<strong>and</strong>fill sites.<br />
4.2.3.1 L<strong>and</strong>fill<br />
Cement dust l<strong>and</strong>fills are not of <strong>the</strong> “sanitary l<strong>and</strong>fill” type. Usually, <strong>the</strong>y are just old<br />
quarries or similar areas. The relative non-reactivity of <strong>the</strong>se dusts does not dem<strong>and</strong> dirt<br />
cover or similar precautions. The sheer volume of <strong>the</strong>se wastes renders many such<br />
techniques impractical (Sell, 1992). L<strong>and</strong>fill procedures are costly <strong>in</strong> numerous respects.<br />
The dust has had a significant monetary <strong>and</strong> <strong>energy</strong> <strong>in</strong>vestment <strong>in</strong> its production,<br />
<strong>in</strong>vestments that would literally be thrown away if <strong>the</strong> dust were disposed of. Suitable<br />
locations for l<strong>and</strong>fill sites near plants are gett<strong>in</strong>g more scarce as <strong>the</strong> quantities of waste<br />
grow. Many sites have <strong>environmental</strong> problems, such as leach<strong>in</strong>g of alkalis from <strong>the</strong> dust<br />
dur<strong>in</strong>g ra<strong>in</strong>storms. The dust is of a very low density, <strong>and</strong> thus some sites can also be very<br />
dangerous: a person or animal who would accidentally fall <strong>in</strong>to an area recently filled would<br />
s<strong>in</strong>k <strong>and</strong> soon suffocate, <strong>in</strong> some locations.
Environmental Pollution <strong>and</strong> Management 31<br />
4.3 O<strong>the</strong>r Environmental Considerations <strong>in</strong> Cement Industry<br />
4.3.1 Noise pollution<br />
Noise sources which have a considerable effect on <strong>the</strong> overall noise emission are<br />
distributed throughout <strong>the</strong> plant: <strong>the</strong> quarry with its mobile mach<strong>in</strong>es <strong>and</strong> crushers which<br />
operates only <strong>in</strong> day time, <strong>the</strong> cement gr<strong>in</strong>d<strong>in</strong>g plants, <strong>the</strong> rotary kiln with its grate or<br />
planetary cooler, <strong>the</strong> gas discharge outlet <strong>and</strong> vehicular traffic <strong>in</strong> <strong>the</strong> cement plant.<br />
With regard to noise control measures <strong>in</strong> <strong>the</strong> plant, a dist<strong>in</strong>ction is to be drawn between<br />
primary <strong>and</strong> secondary measures. Primary measures are applied at <strong>the</strong> mach<strong>in</strong>es or o<strong>the</strong>r<br />
sources of noise <strong>the</strong>mselves. These are essentially design arrangements, e.g., relat<strong>in</strong>g to<br />
teeth of gear systems, fan blades, etc., which can be applied only <strong>in</strong> new or replacement of<br />
mach<strong>in</strong>ery. Suppliers’ guarantees relat<strong>in</strong>g to noise emission are now a normal requirement<br />
associated with any order for equipment.<br />
It is fur<strong>the</strong>rmore advisable to opt for relatively quiet work<strong>in</strong>g methods, e.g., <strong>the</strong> use of<br />
electric motors <strong>in</strong>stead of <strong>in</strong>ternal combustion eng<strong>in</strong>es, water-cooled <strong>in</strong>stead of air-cooled<br />
eng<strong>in</strong>es, low heights of fall of materials be<strong>in</strong>g stockpiled, adequate cushion<strong>in</strong>g material to<br />
reduce impact <strong>and</strong> rush<strong>in</strong>g noises, <strong>and</strong> avoidance of locat<strong>in</strong>g several noise mach<strong>in</strong>es <strong>in</strong><br />
close proximity to one ano<strong>the</strong>r.<br />
Secondary measures such as sound attenuators (silencers), acoustic enclosures, acoustic<br />
walls, etc., reduce sound propagation, as do appropriate structural measures. They are more<br />
particularly suitable for subsequent improvements. Drawbacks associated with <strong>the</strong>ir use,<br />
besides extra operat<strong>in</strong>g expense due to pressure loss or <strong>the</strong> need for forced heat dissipation,<br />
may <strong>in</strong>clude <strong>in</strong>convenience <strong>in</strong> operat<strong>in</strong>g, ma<strong>in</strong>ta<strong>in</strong><strong>in</strong>g <strong>and</strong> repair<strong>in</strong>g <strong>the</strong> mach<strong>in</strong>ery affected<br />
by <strong>the</strong>se acoustic arrangements. In connection with all such measures, <strong>the</strong> cost factor which<br />
progressively <strong>in</strong>creases with <strong>the</strong> degree of sound level reduction achieved, should be<br />
critically exam<strong>in</strong>ed.<br />
4.3.2 Reduction of ground vibrations<br />
As with noise, problems with adjacent residents may also arise <strong>in</strong> connection with ground<br />
vibrations <strong>in</strong> cases where <strong>the</strong> distance between residential build<strong>in</strong>gs <strong>and</strong> <strong>the</strong> cement works<br />
or <strong>the</strong> quarry dim<strong>in</strong>ishes. Vibrations are generated by shock-like or impact-like actions such<br />
as blast<strong>in</strong>g, comb<strong>in</strong>ation of materials by drop-weights, discharge of cl<strong>in</strong>ker from silos,<br />
periodic excitation due to roller mills or out-of-balance rotors. The geological condition of<br />
<strong>the</strong> subsoil is an important factor govern<strong>in</strong>g <strong>the</strong> propagation of body waves as well as <strong>the</strong><br />
frequency composition of <strong>the</strong> vibrations.<br />
In <strong>the</strong> absence of precise <strong>in</strong>formation on geological conditions, on account of <strong>the</strong> large<br />
number of factors <strong>in</strong>volved, it is not possible to predict vibration nuisance - as contrasted<br />
with noise nuisance - at some considerable distance from <strong>the</strong> source. With blast<strong>in</strong>g, <strong>the</strong>
32 Technology, Energy Efficiency <strong>and</strong> Environmental Externalities of <strong>the</strong> Cement Industry<br />
<strong>in</strong>tensity of <strong>the</strong> vibration emission can to some extent be controlled by <strong>the</strong> technique<br />
employed (number <strong>and</strong> spac<strong>in</strong>g of blast holes, amount of explosive fired, depth of holes,<br />
sequenced delay-action fir<strong>in</strong>g), <strong>and</strong> propagation by <strong>the</strong> direction <strong>in</strong> which quarry<strong>in</strong>g<br />
advances.<br />
4.3.3 Raw material resources <strong>and</strong> site restoration<br />
Quarry<strong>in</strong>g <strong>the</strong> raw materials needed for cement manufacture <strong>in</strong>volves <strong>in</strong>tervention <strong>in</strong><br />
nature <strong>and</strong> <strong>the</strong> l<strong>and</strong>scape. Because people have developed a higher awareness to<br />
<strong>environmental</strong> <strong>and</strong> nature conservation, it has <strong>in</strong> many developed countries become<br />
<strong>in</strong>creas<strong>in</strong>gly difficult to extend exist<strong>in</strong>g quarries or <strong>in</strong>deed to start new ones. All <strong>the</strong> same,<br />
conservation <strong>and</strong> <strong>the</strong> need to secure raw material resources must not be regarded as two<br />
exclusive aims. Contrary to <strong>the</strong> popular op<strong>in</strong>ion, <strong>the</strong> natural reserves of limestone, marl,<br />
chalk <strong>and</strong> s<strong>and</strong> are not <strong>in</strong>exhaustible, particularly <strong>in</strong> relation to <strong>the</strong> sitt<strong>in</strong>g of cement plants.<br />
To make arrangements for <strong>the</strong> long-term supply of m<strong>in</strong>eral raw materials <strong>in</strong> <strong>the</strong> requisite<br />
quantities <strong>and</strong> at acceptable cost is an important economic necessity. Besides <strong>the</strong> dem<strong>and</strong>s<br />
of <strong>the</strong> natural conservation <strong>the</strong> dem<strong>and</strong>s of ma<strong>in</strong>ta<strong>in</strong><strong>in</strong>g a supply of raw materials must<br />
<strong>the</strong>refore always be given due consideration.<br />
The cement <strong>in</strong>dustry strives to compensate for <strong>the</strong> unavoidable <strong>in</strong>tervention <strong>in</strong> <strong>the</strong> nature<br />
<strong>and</strong> <strong>the</strong> l<strong>and</strong>scape by appropriate action to ensure l<strong>and</strong>scape preservation <strong>and</strong> site<br />
restoration. In decid<strong>in</strong>g how <strong>the</strong> site is to be restored <strong>and</strong> what its subsequent utilization<br />
will be, <strong>the</strong>re are many viewpo<strong>in</strong>ts to be considered. The natural features of <strong>the</strong> quarry are<br />
especially important. The quarry<strong>in</strong>g operations should be so conducted that <strong>the</strong> m<strong>in</strong>eral<br />
deposits can be utilized as fully as possible. Based on this pr<strong>in</strong>ciple, it can be analyzed what<br />
potential <strong>the</strong>re exists for subsequent utilization <strong>and</strong> for what purposes <strong>the</strong> sites can be<br />
practicably <strong>and</strong> mean<strong>in</strong>gfully used <strong>in</strong> each particular case. Some of <strong>the</strong> possible utilization<br />
paths are:<br />
- agricultural <strong>and</strong> forestry;<br />
- <strong>in</strong>dustrial use;<br />
- municipal use;<br />
- traffic <strong>and</strong> transportation;<br />
- leisure <strong>and</strong> recreational use.<br />
Besides utilization for specific purposes, planned natural restoration has been ga<strong>in</strong><strong>in</strong>g <strong>in</strong><br />
importance <strong>in</strong> recent years. For this purpose, worked-out quarry sites are <strong>in</strong>tentionally<br />
“given over to nature” with<strong>in</strong> <strong>the</strong> plann<strong>in</strong>g context, so that suitable habits for animal <strong>and</strong><br />
plant life (biotopes) can develop. These may be pools or ponds <strong>and</strong> marshy areas or tips,<br />
slopes <strong>and</strong> escarpments, as well as edge zones, offer<strong>in</strong>g undisturbed liv<strong>in</strong>g conditions for<br />
many species of plants <strong>and</strong> animals.
Environmental Pollution <strong>and</strong> Management 33<br />
4.3.4 Utilization of waste as raw material <strong>and</strong> fuel <strong>in</strong> cement <strong>in</strong>dustry<br />
Because of <strong>the</strong> special features of <strong>the</strong> cement burn<strong>in</strong>g process - <strong>the</strong> strongly alkal<strong>in</strong>e feed<br />
material, kiln charge <strong>and</strong> kiln dust, oxidiz<strong>in</strong>g kiln atmosphere, temperature distribution <strong>in</strong><br />
<strong>the</strong> burn<strong>in</strong>g system, <strong>and</strong> <strong>the</strong> <strong>in</strong>timate contact between <strong>the</strong> solids <strong>and</strong> gases <strong>in</strong> <strong>the</strong> kiln - it is<br />
possible, on <strong>the</strong> one h<strong>and</strong>, to employ waste materials as fuel <strong>and</strong>, on <strong>the</strong> o<strong>the</strong>r h<strong>and</strong>, to add<br />
waste materials to <strong>the</strong> raw mix or <strong>the</strong> cement. The cement <strong>in</strong>dustry can thus make an<br />
important contribution to <strong>the</strong> disposal of wastes aris<strong>in</strong>g from o<strong>the</strong>r sectors of <strong>in</strong>dustry.<br />
The use of waste materials as “junk fuel” (waste-derived fuel) <strong>in</strong> <strong>the</strong> cl<strong>in</strong>ker burn<strong>in</strong>g process<br />
is subject to limits due to requirements of <strong>environmental</strong> compatibility, product quality, <strong>and</strong><br />
economy <strong>in</strong> relation to primary fuels.<br />
Such materials may be fired <strong>in</strong> a f<strong>in</strong>ely ground condition or <strong>in</strong> lump form. The feed-<strong>in</strong><br />
po<strong>in</strong>ts for <strong>the</strong>se fuels are <strong>the</strong> ma<strong>in</strong> fir<strong>in</strong>g system <strong>in</strong> <strong>the</strong> precalc<strong>in</strong>er or <strong>the</strong> riser duct of <strong>the</strong><br />
cyclone preheater, <strong>the</strong> kiln <strong>in</strong>let or <strong>the</strong> hot gas compartment of a grate preheater kiln, or as<br />
an <strong>in</strong>ter-ground admixture to <strong>the</strong> kiln feed meal.<br />
The kiln <strong>in</strong>let (feed end) can be used for this purpose only <strong>in</strong> plants equipped with<br />
preheaters. The waste-derived fuels fed <strong>in</strong>to <strong>the</strong> system at this po<strong>in</strong>t are mostly <strong>in</strong> <strong>the</strong> form<br />
of coarse lumps. They may consist of scrap motor tires, rubber shreds, shredded<br />
household refuse, compacted refuse, or textile <strong>and</strong> wood wastes. However, f<strong>in</strong>ely divided<br />
waste materials such as acid sludge, low-grade coal <strong>and</strong> oil shale may also be fed <strong>in</strong> here.<br />
As numerous measurements have shown, with proper process control <strong>the</strong> fir<strong>in</strong>g of <strong>the</strong>se<br />
waste-derived fuels does not cause any <strong>in</strong>crease <strong>in</strong> emission of <strong>environmental</strong>ly relevant<br />
pollutants. Emission of diox<strong>in</strong>s <strong>and</strong> furans have received special attention because <strong>the</strong>y<br />
have been identified <strong>in</strong> <strong>the</strong> stack gases from number of solid waste <strong>in</strong>c<strong>in</strong>erators. However,<br />
survey of test results from trial burns at cement kilns <strong>in</strong>dicates that emissions of diox<strong>in</strong>s<br />
<strong>and</strong> furans from <strong>the</strong>se facilities are not significant. When diox<strong>in</strong>s <strong>and</strong> furans have been<br />
observed, <strong>the</strong>y appear to be three orders of magnitude less than those reported for<br />
municipal <strong>in</strong>c<strong>in</strong>erators. Moreover, <strong>the</strong>re is no change <strong>in</strong> diox<strong>in</strong> or furan emissions due to<br />
<strong>the</strong> use of waste-derived fuels. If waste materials with a high sulfur or chloride content are<br />
used as fuels, attention must be paid not only to <strong>the</strong> quality of <strong>the</strong> cl<strong>in</strong>ker <strong>and</strong> cement<br />
produced, but also more particularly to <strong>the</strong> process eng<strong>in</strong>eer<strong>in</strong>g requirements of kiln<br />
control. It is advantageous to carry out an emission prognosis to ascerta<strong>in</strong> what quantities<br />
of waste-derived fuels can permissibly be used.<br />
The waste-derived fuels currently used <strong>in</strong> USA <strong>and</strong> European cement plants are primarily<br />
waste oils <strong>and</strong> spent organic solvents from <strong>the</strong> follow<strong>in</strong>g <strong>in</strong>dustries: pa<strong>in</strong>t <strong>and</strong> coat<strong>in</strong>gs,<br />
auto <strong>and</strong> truck assembly, solvent reclamation, <strong>in</strong>k <strong>and</strong> pr<strong>in</strong>t<strong>in</strong>g, cosmetics, toy, medical <strong>and</strong><br />
electronics. The follow<strong>in</strong>g <strong>environmental</strong> <strong>and</strong> economical benefits can be achieved when<br />
wastes are destroyed <strong>in</strong> a cement kiln:
34 Technology, Energy Efficiency <strong>and</strong> Environmental Externalities of <strong>the</strong> Cement Industry<br />
- combustion gas temperature <strong>and</strong> residence time <strong>in</strong> kilns are much greater than<br />
those encountered <strong>in</strong> commercial <strong>in</strong>c<strong>in</strong>erators. The susta<strong>in</strong>ed high combustion<br />
gas temperatures, comb<strong>in</strong>ed with <strong>in</strong>tense turbulence ensure efficient destruction<br />
of even stable organic compounds. The gas <strong>in</strong> <strong>the</strong> burn<strong>in</strong>g zone of a kiln reaches<br />
2000 o C for a period of approximately three seconds, while an <strong>in</strong>c<strong>in</strong>erator<br />
achieves its maximum temperature for about half that time.<br />
- <strong>the</strong> kiln contents are alkal<strong>in</strong>e <strong>and</strong> can trap hydrogen chloride formed dur<strong>in</strong>g<br />
combustion of chlor<strong>in</strong>ated wastes. Most of sulfur oxides are similarly trapped as<br />
calcium sulfate.<br />
- ash result<strong>in</strong>g from <strong>in</strong>combustible material such as metals <strong>in</strong> waste becomes<br />
<strong>in</strong>corporated <strong>in</strong> <strong>the</strong> cl<strong>in</strong>ker, elim<strong>in</strong>at<strong>in</strong>g disposal problems.<br />
- <strong>the</strong>re is no significant change <strong>in</strong> emissions from cement kilns when wastederived<br />
fuels are used, <strong>and</strong> new emissions from <strong>the</strong> operation of an <strong>in</strong>c<strong>in</strong>erator<br />
are not added to <strong>the</strong> atmosphere when waste-derived fuels are used to replace<br />
fossil fuel <strong>in</strong> an exist<strong>in</strong>g cement kiln.<br />
- replacement of imported fuel or conservation of non-renewable resources by<br />
waste-derived fuels for coal, coke <strong>and</strong> natural gas.<br />
- a reduction <strong>in</strong> manufactur<strong>in</strong>g costs through <strong>the</strong> recovery of <strong>the</strong> <strong>energy</strong> value of<br />
wastes which would o<strong>the</strong>rwise be lost. Waste fuels typically have a heat value of<br />
24 GJ/t which is somewhat less than coal but are available at a fraction of <strong>the</strong><br />
cost.<br />
In connection with <strong>the</strong> conversion of coal-fired power stations to <strong>environmental</strong>ly<br />
<strong>in</strong>nocuous fir<strong>in</strong>g methods rapidly <strong>in</strong>creas<strong>in</strong>g quantities of fly-ash <strong>and</strong> gypsum are becom<strong>in</strong>g<br />
available from <strong>the</strong> flue gas desulfurization treatment now applied <strong>in</strong> many parts of <strong>the</strong><br />
world. Due to <strong>the</strong> lack of adequate dump<strong>in</strong>g spaces <strong>and</strong> also because of <strong>the</strong>ir content of<br />
various <strong>environmental</strong>ly relevant substances that can be washed or leached out, <strong>the</strong> disposal<br />
of <strong>the</strong>se materials is encounter<strong>in</strong>g major difficulties. Under certa<strong>in</strong> conditions <strong>the</strong> cement<br />
<strong>in</strong>dustry can contribute to solv<strong>in</strong>g <strong>the</strong>se problems. Thus, <strong>in</strong> a number of countries <strong>the</strong><br />
requirement applicable to fly-ash <strong>and</strong> flue gas gypsum <strong>and</strong> to <strong>the</strong>ir use <strong>in</strong> cement<br />
manufacture have been embodied <strong>in</strong> national codes <strong>and</strong> st<strong>and</strong>ards.
Environmental Pollution <strong>and</strong> Management 35<br />
4.4 Conclud<strong>in</strong>g Remarks<br />
S<strong>in</strong>ce air pollution is a major concern, priority <strong>in</strong> <strong>the</strong> cement <strong>in</strong>dustry is to m<strong>in</strong>imize <strong>the</strong><br />
<strong>in</strong>crease <strong>in</strong> ambient particulate levels by reduc<strong>in</strong>g <strong>the</strong> mass load emitted from <strong>the</strong> stacks,<br />
from fugitive emissions, <strong>and</strong> from o<strong>the</strong>r sources. Collection <strong>and</strong> recycl<strong>in</strong>g of dust <strong>in</strong> kiln<br />
gases is required to improve <strong>the</strong> <strong>efficiency</strong> of <strong>the</strong> operation <strong>and</strong> to reduce <strong>the</strong> atmospheric<br />
emissions. NOx levels should be controlled by adjustment of <strong>the</strong> kiln burner <strong>and</strong> use of an<br />
optimum level of excess air. For control of fugitive particulate emissions, ventilation system<br />
should be used <strong>in</strong> conjunction with hoods <strong>and</strong> enclosures cover<strong>in</strong>g transfer po<strong>in</strong>ts. Drop<br />
distances should be m<strong>in</strong>imized by use of adjustable conveyors. Mechanical systems such as<br />
cyclones trap <strong>the</strong> larger particulates <strong>in</strong> kiln gases <strong>and</strong> act as preconditioner for downstream<br />
collection devices. Electrostatic precipitators <strong>and</strong> fabric filter system are <strong>the</strong> pr<strong>in</strong>cipal<br />
options for collection <strong>and</strong> control of f<strong>in</strong>e particulates.<br />
Storage <strong>and</strong> waste areas should be wetted-down to reduce dust generation from <strong>the</strong>se<br />
sources. Appropriate storm-water <strong>and</strong> run-off control system should be provided to<br />
m<strong>in</strong>imize <strong>the</strong> quantities of suspended materials carried off-site. Alkali dust removed from<br />
<strong>the</strong> kiln gases is normally disposed of as solid waste, but it may be possible to reuse a<br />
portion for agricultural lim<strong>in</strong>g.
36 Technology, Energy Efficiency <strong>and</strong> Environmental Externalities of <strong>the</strong> Cement Industry<br />
5. CROSS-COUNTRY COMPARISON OF THE CEMENT SECTOR<br />
5.1 Introduction<br />
The cement dem<strong>and</strong> has been <strong>in</strong>creas<strong>in</strong>g <strong>in</strong> <strong>the</strong> develop<strong>in</strong>g countries along with <strong>the</strong> rapid<br />
development of <strong>in</strong>frastructure. In <strong>the</strong> favor of abundant resources, <strong>the</strong> develop<strong>in</strong>g<br />
countries have been produc<strong>in</strong>g cement without tak<strong>in</strong>g much care of <strong>the</strong> process <strong>energy</strong><br />
consumption. As a capital <strong>in</strong>tensive <strong>in</strong>dustry, <strong>the</strong> ma<strong>in</strong> difference between <strong>the</strong> <strong>in</strong>dustrialized<br />
economies <strong>and</strong> develop<strong>in</strong>g countries is <strong>the</strong> average size of <strong>the</strong> mills. The small mills<br />
predom<strong>in</strong>ate <strong>in</strong> develop<strong>in</strong>g countries with 1.5 to 2 times higher specific <strong>energy</strong><br />
consumption <strong>in</strong> comparison with <strong>the</strong> <strong>in</strong>dustrialized countries. Besides <strong>the</strong> scale of <strong>the</strong> mills,<br />
<strong>the</strong>re are various o<strong>the</strong>r factors which lead to <strong>the</strong> <strong>in</strong><strong>efficiency</strong> of <strong>energy</strong> use <strong>in</strong> <strong>the</strong> cement<br />
<strong>in</strong>dustry.<br />
Production of cement <strong>in</strong>volves a lot of gr<strong>in</strong>d<strong>in</strong>g of raw materials, <strong>in</strong>termediate products<br />
<strong>and</strong> fuel to pulverized form, <strong>and</strong> generates air pollutants. As <strong>the</strong> <strong>in</strong>dustry <strong>in</strong> this region still<br />
operate with obsolete technologies, <strong>the</strong> wet process dom<strong>in</strong>ates as <strong>the</strong> process <strong>technology</strong> <strong>in</strong><br />
some of <strong>the</strong> countries, which creates water pollution <strong>in</strong> addition to <strong>the</strong> air pollution<br />
problems. As for <strong>the</strong> case of <strong>energy</strong>, mill size also plays a role <strong>in</strong> <strong>the</strong> <strong>in</strong><strong>efficiency</strong> of<br />
pollution abatement<br />
This paper presents a comparative study of <strong>the</strong> cement <strong>in</strong>dustries <strong>in</strong> Ch<strong>in</strong>a, India, <strong>the</strong><br />
Philipp<strong>in</strong>es <strong>and</strong> Sri Lanka to po<strong>in</strong>t out <strong>the</strong> major causes of <strong>energy</strong> <strong>in</strong><strong>efficiency</strong> <strong>and</strong> pollution<br />
problems, <strong>and</strong> to identify <strong>the</strong> improvements <strong>and</strong> potential application of <strong>energy</strong> efficient<br />
<strong>and</strong> <strong>environmental</strong>ly sound technologies.<br />
5.2 Overview of <strong>the</strong> Industry<br />
5.2.1 Role <strong>in</strong> <strong>the</strong> national economy<br />
In 1989, <strong>the</strong> Indian cement <strong>in</strong>dustry accounted for 1.8% of total output of manufactur<strong>in</strong>g<br />
economy <strong>and</strong> 0.23% of <strong>the</strong> gross domestic product.<br />
5.2.2 Share <strong>in</strong> total <strong>energy</strong> consumption<br />
In 1990, <strong>energy</strong> consumption of Ch<strong>in</strong>ese cement <strong>in</strong>dustry accounted for 6.6% of <strong>the</strong> total<br />
<strong>in</strong>dustrial <strong>energy</strong> consumption <strong>and</strong> 3.5% of total national <strong>energy</strong> consumption.<br />
In 1990, Indian cement <strong>in</strong>dustry had a share of over 10% of <strong>the</strong> <strong>in</strong>dustrial sector’s coal<br />
consumption <strong>and</strong> over 6% of <strong>the</strong> <strong>in</strong>dustrial sector’s electricity consumption.
Profile of <strong>the</strong> Cement Industry <strong>in</strong> Asian Industrializ<strong>in</strong>g Countries 37<br />
In 1992, <strong>the</strong> <strong>energy</strong> consumption of <strong>the</strong> cement <strong>in</strong>dustry represented 16.73% of <strong>in</strong>dustrial<br />
sector’s <strong>energy</strong> consumption <strong>and</strong> 4.95% of total national <strong>energy</strong> consumption <strong>in</strong> <strong>the</strong><br />
Philipp<strong>in</strong>es.<br />
5.2.3 Production trend<br />
Among <strong>the</strong> countries under study, Ch<strong>in</strong>a is <strong>the</strong> world’s largest cement producer. Both<br />
Ch<strong>in</strong>a <strong>and</strong> India are cement export<strong>in</strong>g countries. The trends of cement production <strong>in</strong> <strong>the</strong><br />
countries under this study are shown <strong>in</strong> Figure 5.1.<br />
Cement (Million Tons)<br />
Million Tons<br />
400<br />
350<br />
300<br />
250<br />
200<br />
150<br />
100<br />
50<br />
Ch<strong>in</strong>a<br />
0<br />
1980 1985 1986 1987 1988 1989 1990 1991 1992 1993<br />
Years<br />
Philipp<strong>in</strong>es' Cement Production<br />
10<br />
8<br />
6<br />
4<br />
2<br />
0<br />
1980 1985 1991 1992 1993<br />
Years<br />
Million Tons<br />
Figure 5.1. Trends of cement production<br />
India<br />
Sri Lanka's Cement Production<br />
1<br />
0.8<br />
0.6<br />
0.4<br />
0.2<br />
0<br />
1970 1980 1990 1992<br />
Years<br />
From <strong>the</strong> figure, it can be seen that <strong>the</strong> cement production of Ch<strong>in</strong>a has been <strong>in</strong>creas<strong>in</strong>g<br />
very rapidly s<strong>in</strong>ce 1990. The average growth rate of cement production was about 11%<br />
from 1985 to 1993 <strong>and</strong> 20.6% from 1990 to 1993.<br />
The production of Indian cement <strong>in</strong>dustry has been gradually <strong>in</strong>creas<strong>in</strong>g <strong>and</strong> <strong>the</strong> average<br />
growth rate has been about 7.25% from 1985 to 1993.
38 Technology, Energy Efficiency <strong>and</strong> Environmental Externalities of <strong>the</strong> Cement Industry<br />
In <strong>the</strong> Philipp<strong>in</strong>es, <strong>the</strong> cement production <strong>in</strong> 1993 was more than 2.5 times that <strong>in</strong> 1985.<br />
The production is expected to grow at <strong>the</strong> rate of 5.6% annually up to year 2000.<br />
In Sri Lanka, <strong>the</strong> cement is produced from <strong>the</strong> cement plants as well as cl<strong>in</strong>ker gr<strong>in</strong>d<strong>in</strong>g<br />
mills which use imported cl<strong>in</strong>ker as <strong>in</strong>put material. The production of cement has been<br />
significantly <strong>in</strong>creas<strong>in</strong>g at an average growth rate of 6.04% s<strong>in</strong>ce 1980 along with <strong>the</strong><br />
<strong>in</strong>crease <strong>in</strong> imported cl<strong>in</strong>ker. The production trends of cl<strong>in</strong>ker <strong>and</strong> cement <strong>in</strong> Sri Lanka are<br />
compared <strong>in</strong> Figure 5.2 to assess <strong>the</strong> role of imported cl<strong>in</strong>ker <strong>in</strong> cement <strong>in</strong>dustry.<br />
Thous<strong>and</strong> Tons<br />
1000<br />
800<br />
600<br />
400<br />
200<br />
0<br />
Cl<strong>in</strong>ker<br />
Cement<br />
1970 1980 1990 1992<br />
Figure 5.2. Trends of cl<strong>in</strong>ker <strong>and</strong> cement production <strong>in</strong> Sri Lanka<br />
5.2.4 Mills <strong>and</strong> capacities<br />
The cement <strong>in</strong>dustry of Ch<strong>in</strong>a is characterized by a number of small mills with manual or<br />
mechanized shaft kilns. In 1992, <strong>the</strong>re were totally 6,177 mills of which, only 79 were large<br />
<strong>and</strong> medium size mills with capacity exceed<strong>in</strong>g 0.3 million tons per year.<br />
In 1989, <strong>the</strong>re were 558 factories <strong>in</strong> Indian cement <strong>in</strong>dustry <strong>in</strong>clud<strong>in</strong>g both cement mills<br />
<strong>and</strong> cl<strong>in</strong>ker gr<strong>in</strong>d<strong>in</strong>g mills. In 1992, 97 mills produced both cl<strong>in</strong>ker <strong>and</strong> cement, 2 mills<br />
produced only cl<strong>in</strong>ker <strong>and</strong> <strong>the</strong> rest were cl<strong>in</strong>ker gr<strong>in</strong>d<strong>in</strong>g mills.<br />
The breakdown of cement mills which produce both cl<strong>in</strong>ker <strong>and</strong> cement by plant capacity,<br />
is given <strong>in</strong> Figure 5.3 for Ch<strong>in</strong>a <strong>and</strong> India. The average capacity of mills <strong>in</strong> Ch<strong>in</strong>a is too<br />
small. Although <strong>the</strong> average capacity of Indian cement mills is larger than that of Ch<strong>in</strong>ese<br />
mills, it is still small <strong>in</strong> comparison with <strong>the</strong> developed countries. About 87% of Indian<br />
mills are under <strong>the</strong> annual plant capacity of 1 million tons of cement. However, In Japan,<br />
over 88% of <strong>the</strong> mills have <strong>the</strong> plant capacity of more than 1 million tons of cement per<br />
year <strong>and</strong> over 50% of <strong>the</strong> plants are mills with plant annual output exceed<strong>in</strong>g 2 million<br />
tons of cement.
Profile of <strong>the</strong> Cement Industry <strong>in</strong> Asian Industrializ<strong>in</strong>g Countries 39<br />
There are 18 cement plants <strong>in</strong> <strong>the</strong> Philipp<strong>in</strong>es with a total capacity of 7.4 <strong>and</strong> 9.5 million<br />
tons of cl<strong>in</strong>ker <strong>and</strong> cement per year respectively, lead<strong>in</strong>g to an average plant capacity of<br />
about 5.5 million tons of cement per year.<br />
98.72%<br />
Ch<strong>in</strong>a<br />
>0.3
40 Technology, Energy Efficiency <strong>and</strong> Environmental Externalities of <strong>the</strong> Cement Industry<br />
<strong>the</strong>re has been a slowdown <strong>in</strong> <strong>the</strong> growth of small mills at <strong>the</strong> cost of medium <strong>and</strong> largesize<br />
plants.<br />
% of Total Production<br />
90<br />
80<br />
70<br />
60<br />
50<br />
40<br />
30<br />
20<br />
10<br />
0<br />
1970 1980 1985 1986 1987 1988 1989 1990 1991<br />
Figure 5.5. Share of small mills <strong>in</strong> Ch<strong>in</strong>ese cement production<br />
In India, <strong>the</strong> small units <strong>in</strong> private sector <strong>and</strong> large mills <strong>in</strong> public sector have been grow<strong>in</strong>g<br />
<strong>in</strong> parallel. The shares of private sector <strong>and</strong> public sector <strong>in</strong> total cement production are<br />
given <strong>in</strong> Table 5.1.<br />
Table 5.1. Shares of private <strong>and</strong> public sectors <strong>in</strong> India (% of total production)<br />
1977 1983 1991 1992<br />
Private Sector 90.08 83.90 89.80 89.60<br />
Public Sector 9.92 16.10 10.20 10.40<br />
5.3 Characteristics of <strong>the</strong> Parameters affect<strong>in</strong>g Energy Efficiency<br />
The major parameters which affect <strong>the</strong> specific <strong>energy</strong> consumption of <strong>the</strong> cement <strong>in</strong>dustry<br />
are:<br />
- Control on raw material mix<strong>in</strong>g<br />
- Process mix (dry, wet, semi)<br />
- Degree of precalc<strong>in</strong>ation<br />
- Level of waste heat recovery<br />
- Product mix, etc.<br />
The specific <strong>energy</strong> consumption of <strong>the</strong> cement <strong>in</strong>dustries <strong>in</strong> selected countries are shown<br />
<strong>in</strong> Figure 5.6.<br />
It can be seen that <strong>the</strong> specific <strong>energy</strong> consumption of Ch<strong>in</strong>ese cement <strong>in</strong>dustry is nearly<br />
twice as much that of former west Germany. The trends of specific <strong>energy</strong> consumption <strong>in</strong><br />
selected countries are shown <strong>in</strong> Figure 5.7.
Profile of <strong>the</strong> Cement Industry <strong>in</strong> Asian Industrializ<strong>in</strong>g Countries 41<br />
MJ/kg of Cement<br />
MJ/kg of Cement<br />
7<br />
6<br />
5<br />
4<br />
3<br />
2<br />
1<br />
0<br />
Ch<strong>in</strong>a Philipp<strong>in</strong>es Japan<br />
Figure 5.6. Specific <strong>energy</strong> consumption of cement <strong>in</strong>dustry<br />
8<br />
7<br />
6<br />
5<br />
4<br />
3<br />
2<br />
1<br />
0<br />
1980 1985 1986 1987 1988 1989 1990 1991 1992 1993<br />
Ch<strong>in</strong>a India Philipp<strong>in</strong>e Japan<br />
Figure 5.7. Trends of specific <strong>energy</strong> consumption<br />
The curve of specific <strong>energy</strong> consumption of Ch<strong>in</strong>ese cement <strong>in</strong>dustry is quite flat.<br />
Although <strong>the</strong> specific <strong>energy</strong> consumption of Indian <strong>in</strong>dustry has been decreas<strong>in</strong>g, it has<br />
become slower <strong>in</strong> <strong>the</strong> recent years <strong>and</strong> still rema<strong>in</strong> higher than that of developed countries.<br />
To underst<strong>and</strong> <strong>the</strong> major causes of <strong>in</strong><strong>efficiency</strong> <strong>in</strong> cement <strong>in</strong>dustries of <strong>the</strong> countries under<br />
this study, some parameters which have <strong>in</strong>fluences on <strong>the</strong> <strong>energy</strong> consumption are<br />
compared.
42 Technology, Energy Efficiency <strong>and</strong> Environmental Externalities of <strong>the</strong> Cement Industry<br />
5.3.1 Process-mix<br />
The cement production process-mix is one of <strong>the</strong> important parameters affect<strong>in</strong>g <strong>energy</strong><br />
<strong>efficiency</strong> of <strong>the</strong> <strong>in</strong>dustry s<strong>in</strong>ce wet process consumes about 1.5 times more <strong>energy</strong> than <strong>the</strong><br />
dry process. Although <strong>the</strong> manual <strong>and</strong> mechanized shaft kilns have been completely<br />
elim<strong>in</strong>ated <strong>in</strong> <strong>in</strong>dustrialized countries, <strong>the</strong>y are still used <strong>in</strong> develop<strong>in</strong>g countries, especially<br />
<strong>in</strong> Ch<strong>in</strong>a. The wet process is also no longer <strong>in</strong> use <strong>in</strong> <strong>the</strong> <strong>in</strong>dustrialized countries. The<br />
shares of cement production processes are given <strong>in</strong> Table 5.2.<br />
Table 5.2. Total cement production <strong>and</strong> share of processes (%) <strong>in</strong> 1993<br />
Ch<strong>in</strong>a India Philipp<strong>in</strong>es Sri Lanka Japan<br />
Dry Process 9 82 51 100 100<br />
Semi Processes n.a 2 9 0 0<br />
Wet Process n.a 16 40 0 0<br />
Manual/Mechanized<br />
Shaft Kilns<br />
80 0 0 0 0<br />
Total Production<br />
(Million Tons)<br />
367.88 57.96 7.96 0.89* 88.25*<br />
* 1992 data (source: ESCAP)<br />
The share of advanced dry process <strong>in</strong> Ch<strong>in</strong>a is considerably low, lead<strong>in</strong>g to <strong>in</strong><strong>efficiency</strong> of<br />
<strong>energy</strong> use <strong>in</strong> <strong>the</strong> cement <strong>in</strong>dustry. One of <strong>the</strong> major achievements of Indian cement<br />
<strong>in</strong>dustry is cont<strong>in</strong>uous <strong>in</strong>crease <strong>in</strong> <strong>the</strong> share of dry process. However, <strong>the</strong> specific <strong>energy</strong><br />
consumption of Indian cement <strong>in</strong>dustry is still high. One reason for <strong>the</strong> high specific<br />
<strong>energy</strong> consumption could be <strong>the</strong> use of low-grade fuel <strong>in</strong> <strong>the</strong> kiln. The trends of different<br />
processes <strong>in</strong> Indian cement <strong>in</strong>dustry are given <strong>in</strong> Table 5.3.<br />
Table 5.3. Trends of shares of cement production processes <strong>in</strong> India<br />
Processes 1960 1970 1980 1992-93<br />
Dry 1.1 21.5 32.7 82.0<br />
Semi 4.5 9.0 5.7 2.0<br />
Wet 94.4 69.5 61.6 16.0<br />
5.3.2 Average kiln size<br />
Cl<strong>in</strong>ker production <strong>in</strong> kiln is a high-temperature process <strong>and</strong> about 55-85% of total <strong>energy</strong><br />
<strong>in</strong>put is consumed <strong>in</strong> this process. The recovery of waste heat from <strong>the</strong> exhaust stream of<br />
kilns is an <strong>in</strong>fluential factor on specific <strong>energy</strong> consumption of <strong>the</strong> cement <strong>in</strong>dustry. The<br />
recovery of waste heat would be more economic <strong>in</strong> case of large-size kilns. The average size<br />
of rotary kilns are compared <strong>in</strong> Figure 5.8.
Profile of <strong>the</strong> Cement Industry <strong>in</strong> Asian Industrializ<strong>in</strong>g Countries 43<br />
'000 Tons of Cl<strong>in</strong>ker/yr<br />
1200<br />
1000<br />
800<br />
600<br />
400<br />
200<br />
0<br />
90<br />
240<br />
1000<br />
Ch<strong>in</strong>a India Japan<br />
Figure 5.8. Average capacity of rotary kilns<br />
The vertical kilns are no longer <strong>in</strong> use <strong>in</strong> Japan. The average size of vertical kilns is 30<br />
thous<strong>and</strong> tons of cl<strong>in</strong>ker per kiln per year <strong>in</strong> both Ch<strong>in</strong>a <strong>and</strong> India.<br />
5.3.3 Energy consumption by type<br />
The specific consumption of two types of <strong>energy</strong> sources, <strong>the</strong>rmal <strong>energy</strong> <strong>and</strong> electricity,<br />
are given <strong>in</strong> Table 5.4 for selected countries by different processes.<br />
Table 5.4. Specific <strong>the</strong>rmal <strong>and</strong> electrical <strong>energy</strong> consumption<br />
Ch<strong>in</strong>a India Philipp<strong>in</strong>es Sri Lanka Japan<br />
Thermal Energy (MJ/kg Cl<strong>in</strong>ker)<br />
Dry Process 4.85 3.8-4.4 4.2 4.35 3.0<br />
Wet Process 6.04 5.9-6.8 7.5 - -<br />
Mechanized Shaft Kiln Process 4.90 n.a - - -<br />
Electricity (kWh/ton cement) 110 120-130 130 130 96<br />
Although <strong>the</strong> dry process predom<strong>in</strong>ates <strong>in</strong> Indian cement <strong>in</strong>dustry, <strong>the</strong> higher specific<br />
<strong>the</strong>rmal <strong>energy</strong> consumption of dry process would be one of <strong>the</strong> major causes of high<br />
overall specific <strong>energy</strong> consumption. The specific electricity consumption of develop<strong>in</strong>g<br />
countries is significantly higher than that of <strong>in</strong>dustrialized countries. In fact, <strong>the</strong> higher<br />
electricity consumption is due to <strong>the</strong> <strong>in</strong>efficient gr<strong>in</strong>d<strong>in</strong>g of raw materials <strong>and</strong> cl<strong>in</strong>ker.<br />
5.3.4 Awareness on <strong>energy</strong> conservation<br />
Some of <strong>the</strong> <strong>energy</strong> conservation measures which have already taken place are summarized<br />
<strong>in</strong> <strong>the</strong> Table 5.5.
44 Technology, Energy Efficiency <strong>and</strong> Environmental Externalities of <strong>the</strong> Cement Industry<br />
The table shows that, some advanced technologies have already been implemented <strong>in</strong> <strong>the</strong><br />
develop<strong>in</strong>g countries. However, <strong>the</strong> dissem<strong>in</strong>ation rate of <strong>the</strong>se technologies is quite low <strong>in</strong><br />
comparison with <strong>the</strong> <strong>in</strong>dustrialized countries.<br />
Table 5.5. Energy conservation measures already undertaken<br />
Country Energy Conservation Measures<br />
Ch<strong>in</strong>a - Clos<strong>in</strong>g <strong>and</strong> convert<strong>in</strong>g manual vertical kilns to mechanized kilns<br />
- Premix control of raw materials <strong>and</strong> fuel<br />
- Raw material <strong>in</strong>gredient <strong>and</strong> uniformity control<br />
- Improv<strong>in</strong>g raw material gr<strong>in</strong>d<strong>in</strong>g facilities<br />
- Conversion of wet process kilns to semi or dry process kilns with<br />
suspension preheat<strong>in</strong>g systems<br />
- Introduction of precalc<strong>in</strong>er facilities<br />
- Computer controlled kiln operation<br />
- Improv<strong>in</strong>g cl<strong>in</strong>ker gr<strong>in</strong>d<strong>in</strong>g facilities<br />
India - Installation of raw material composition control equipment<br />
- Improv<strong>in</strong>g <strong>the</strong> raw materials <strong>and</strong> cl<strong>in</strong>ker gr<strong>in</strong>d<strong>in</strong>g<br />
- Computer controlled fuel feed<strong>in</strong>g<br />
- Installation of high <strong>efficiency</strong> burners<br />
- Installation of secondary fir<strong>in</strong>g system<br />
- Waste heat recovery through cogeneration boilers<br />
- Improv<strong>in</strong>g house-keep<strong>in</strong>g measures<br />
- Dust recycl<strong>in</strong>g system<br />
- Power factor improvements<br />
- Combustion control<br />
- Installation of logic controller for sequential start<strong>in</strong>g <strong>and</strong> process<br />
optimization<br />
- Introduction of precalc<strong>in</strong>er facilities<br />
Philipp<strong>in</strong>e<br />
s<br />
- Installation of high pressure roller mills<br />
- Fuel switch<strong>in</strong>g from bunker oil to coal<br />
- Conversion of direct to <strong>in</strong>direct fir<strong>in</strong>g system<br />
- Rehabilitation of small capacity kilns to achieve rated output<br />
- Installation of precalc<strong>in</strong>er<br />
- Rehabilitation of cl<strong>in</strong>ker cooler<br />
Sri Lanka - Insulation improvement <strong>and</strong> house-keep<strong>in</strong>g<br />
5.4 Characteristics of <strong>the</strong> Parameters Affect<strong>in</strong>g Pollution Abatement Measures<br />
In new , <strong>environmental</strong> concerns are for air pollutants such as dust, SOx <strong>and</strong> NOx. The<br />
cement <strong>in</strong>dustry be<strong>in</strong>g very capital <strong>in</strong>tensive, many plants cont<strong>in</strong>ue to use <strong>the</strong> old wet
Profile of <strong>the</strong> Cement Industry <strong>in</strong> Asian Industrializ<strong>in</strong>g Countries 45<br />
process. As a result, water pollution is also a major concern <strong>in</strong> those <strong>in</strong>dustries. Apart from<br />
water pollution from raw material preparation, use of wet scrubbers <strong>in</strong> many plants also<br />
add additional water pollutants. But <strong>the</strong> wet scrubbers allow to reduce <strong>the</strong> presence of NOx<br />
<strong>and</strong> SOx <strong>in</strong> exhaust air.<br />
5.4.1 Causes of <strong>the</strong> pollution problems<br />
In general very limited attention is paid to abate pollution <strong>in</strong> <strong>the</strong>se countries. The causes for<br />
<strong>the</strong> pollution are attributed to <strong>the</strong> follow<strong>in</strong>g:<br />
- Poor quality of raw material<br />
- Sulfur rich <strong>and</strong> coal based fuel usage for <strong>energy</strong> need<br />
- Huge number of small scale <strong>in</strong>dustries<br />
- Capital <strong>in</strong>tensive equipment for pollution abatement/process modification<br />
- Non availability of spare parts for pollution abatement equipment <strong>in</strong> local market<br />
- Lack of awareness of <strong>the</strong> economical benefits achieved through pollution<br />
abatement<br />
5.4.2 Current pollution control strategies<br />
As seen from <strong>the</strong> process mix from Table 5.2, Ch<strong>in</strong>a <strong>and</strong> <strong>the</strong> Philipp<strong>in</strong>es should have<br />
serious pollution related to both air <strong>and</strong> water due to <strong>the</strong> less share of dry process <strong>in</strong> total<br />
production. But <strong>in</strong> case of India <strong>and</strong> Sri Lanka, <strong>the</strong> major concern is air pollution because<br />
of <strong>the</strong> predom<strong>in</strong>ance of dry process <strong>in</strong> <strong>the</strong> total production. Follow<strong>in</strong>g are <strong>the</strong> reported<br />
activities related to pollution abatement <strong>in</strong> <strong>the</strong> countries under study.<br />
5.4.2.1 Pollution control strategies <strong>in</strong> Ch<strong>in</strong>a<br />
Dur<strong>in</strong>g <strong>the</strong> period of 1991 to 1993, while <strong>the</strong> number of units <strong>in</strong>creased by 21%:<br />
- Wastewater discharge <strong>in</strong>creased only by 10%<br />
- Wastewater discharged directly to natural water bodies <strong>in</strong>creased to 72% from<br />
69%<br />
- Wastewater reach<strong>in</strong>g regulatory st<strong>and</strong>ards <strong>in</strong>creased from 67% to 69%<br />
- Dust discharge decreased to 0.9% from 1.14% of total cement production<br />
- Waste gas purification rate <strong>in</strong>creased to 76% from 67%<br />
- Percentage of SO2 removal <strong>in</strong>creased to 7% from 5%<br />
- Percentage of dust removal <strong>in</strong>creased to 78% from 76%<br />
Accord<strong>in</strong>g to a study carried out <strong>in</strong> 1993, new generation suspension preheater kilns emit<br />
less dust, NOx <strong>and</strong> SOx than o<strong>the</strong>r conventional kilns. A case study was carried out <strong>in</strong> 1993<br />
to realize <strong>the</strong> feasibility of pollution abatement <strong>and</strong> <strong>energy</strong> conservation by convert<strong>in</strong>g wet<br />
process to dry process.
46 Technology, Energy Efficiency <strong>and</strong> Environmental Externalities of <strong>the</strong> Cement Industry<br />
5.4.2.2 Pollution control strategies <strong>in</strong> India<br />
Different emission st<strong>and</strong>ards were set up consider<strong>in</strong>g <strong>the</strong> location <strong>and</strong> capacity of <strong>the</strong><br />
plants. To meet <strong>the</strong>se emission st<strong>and</strong>ards, advanced dust collection systems such as<br />
electrostatic precipitator <strong>and</strong> fabric filters are used. Follow<strong>in</strong>g were identified as some<br />
constra<strong>in</strong>ts for pollution abatement:<br />
- Poor quality of coal<br />
- Non availability of <strong>the</strong> spare parts for pollution control equipment<br />
- Non availability of tra<strong>in</strong>ed man power<br />
- Problems <strong>in</strong> <strong>in</strong>stall<strong>in</strong>g new dust collectors due to layout constra<strong>in</strong>ts<br />
- The ash content of coal varies from 22-45 %, lead<strong>in</strong>g to high concentration of CO<br />
emission which <strong>in</strong> turn creates <strong>the</strong> danger of explosion <strong>in</strong> ESPs<br />
- Frequent voltage fluctuations <strong>and</strong> unscheduled power cuts affect ESP operation.<br />
5.4.2.3 Pollution control strategies <strong>in</strong> <strong>the</strong> Philipp<strong>in</strong>es<br />
Environmental protection regulation was published <strong>in</strong> 1978, which <strong>in</strong>cludes air quality,<br />
water quality <strong>and</strong> noise level control. Regulations <strong>in</strong> <strong>the</strong> Philipp<strong>in</strong>es are not str<strong>in</strong>gent as<br />
those <strong>in</strong> Taiwan <strong>and</strong> Japan. About 24% of <strong>the</strong> production units <strong>in</strong> <strong>the</strong> <strong>in</strong>dustry have no<br />
dust collector. Absence of dust collectors is very common <strong>in</strong> crusher <strong>and</strong> raw material drier<br />
sections. In early 80’s all cement plants were converted to coal fir<strong>in</strong>g system.<br />
5.4.2.4 Pollution control strategies <strong>in</strong> Sri Lanka<br />
All mills are provided with ESPs <strong>and</strong> fabric filters for removal <strong>and</strong> recycl<strong>in</strong>g arrangements<br />
for dust but no st<strong>and</strong>-by units are available. So dur<strong>in</strong>g ma<strong>in</strong>tenance of <strong>the</strong> equipment, dust<br />
is discharged <strong>in</strong>to <strong>the</strong> atmosphere without any control.<br />
5.4.3 Comparison of effluent <strong>and</strong> emission characteristics<br />
A comparison of water consumption <strong>and</strong> quantity <strong>and</strong> characteristics of wastewater with<br />
German st<strong>and</strong>ards is made <strong>in</strong> Table 5.6. In most cases, data are not available even though it<br />
is an important pollut<strong>in</strong>g <strong>in</strong>dustry. Especially India <strong>and</strong> Sri Lanka do not have any data<br />
related to water pollution. It can be attributed to dim<strong>in</strong>ish<strong>in</strong>g trend of wet process <strong>in</strong> India<br />
<strong>and</strong> non availability of wet process <strong>in</strong> Sri Lanka.<br />
A similar comparison for air emission is shown <strong>in</strong> Table 5.7. Even though data are available<br />
related to air pollution, comparison is not possible <strong>in</strong> most cases because of <strong>the</strong> different<br />
basis. Though dust emission st<strong>and</strong>ards <strong>in</strong> India <strong>and</strong> Philipp<strong>in</strong>e are very close to each o<strong>the</strong>r,<br />
<strong>the</strong>y are ten times higher than <strong>the</strong> German regulatory st<strong>and</strong>ards.
Profile of <strong>the</strong> Cement Industry <strong>in</strong> Asian Industrializ<strong>in</strong>g Countries 47<br />
Table 5.6. Quantity <strong>and</strong> characteristics of wastewater released<br />
Parameters<br />
Water consumption<br />
(ton/ton cement produced)<br />
Wastewater discharged<br />
(ton/ton cement produced)<br />
Germany * Ch<strong>in</strong>a India Philipp<strong>in</strong>es Sri Lanka<br />
pH 6-8.5<br />
Suspended solids (mg/l) 100 75<br />
Settleable solids (ml/l)<br />
DS (mg/l)<br />
BOD5 (mg/l)<br />
0.3<br />
COD (mg/l)<br />
Oil <strong>and</strong> Grease (mg/l)<br />
Total N (mg/l)<br />
Cyanide (mg/l)<br />
Heavy metals (mg/l)<br />
150<br />
- Cr<br />
Wastewater reuse rate (%)<br />
0.3<br />
Treatment rate of wastewater (%) 76<br />
Proportion<br />
st<strong>and</strong>ards (%)<br />
reach<strong>in</strong>g discharge<br />
68.6<br />
Hydro carbons (mg/l) 10<br />
* The German regulatory st<strong>and</strong>ard for lime, s<strong>and</strong> <strong>and</strong> stone related <strong>in</strong>dustries<br />
Table 5.7. Quantity <strong>and</strong> characteristics of air pollutants released<br />
Parameters Germany* Ch<strong>in</strong>a India Philipp<strong>in</strong>es Sri Lanka<br />
Dust discharged (TSP) (mg/m 3 ) 30 25-30** 150-400 300<br />
SO2 (mg/m 3 ) 100 1.81** 732 4100<br />
NOx (mg/m 3 ) 500 260-1800 #<br />
3000<br />
CO (mg/m 3 )<br />
Organics (mg/m<br />
100<br />
3 )<br />
Heavy metals (mg/m 3 )<br />
Treatment rate of waste gas (%)<br />
Rate of treated waste gas discharged<br />
which meet st<strong>and</strong>ards (%)<br />
* The German regulatory st<strong>and</strong>ard for lime, s<strong>and</strong> <strong>and</strong> stone related <strong>in</strong>dustries<br />
** <strong>in</strong> kg/ton cement produced<br />
# depend<strong>in</strong>g on <strong>the</strong> type of kiln <strong>in</strong> ppm
48 Technology, Energy Efficiency <strong>and</strong> Environmental Externalities of <strong>the</strong> Cement Industry<br />
5.5 Potential for Energy Efficiency Improvements<br />
5.5.1 Measures on <strong>the</strong> structure of <strong>the</strong> <strong>in</strong>dustry<br />
One of <strong>the</strong> major <strong>energy</strong> conservation measures <strong>in</strong> Japan was <strong>the</strong> clos<strong>in</strong>g of small <strong>and</strong><br />
medium sized low productivity plants. As a capital <strong>in</strong>tensive <strong>in</strong>dustry, <strong>the</strong> closure of all<br />
small plants <strong>and</strong> <strong>in</strong>stallation of large mills is not a feasible solution for develop<strong>in</strong>g<br />
countries. However, <strong>the</strong> future expansion of mills should be done <strong>in</strong> a planned manner.<br />
The growth of <strong>in</strong>efficient small mills should be restricted, especially <strong>in</strong> Ch<strong>in</strong>a, to achieve<br />
<strong>the</strong> lower specific <strong>energy</strong> consumption of <strong>the</strong> <strong>in</strong>dustry. S<strong>in</strong>ce <strong>the</strong> cement <strong>in</strong>dustry requires<br />
great amount of raw materials, <strong>the</strong> transportation cost <strong>and</strong> geographical condition of a<br />
particular country would greatly <strong>in</strong>fluence <strong>the</strong> selection of a mill capacity. The future mills<br />
should be equipped with <strong>energy</strong> efficient technologies.<br />
The privatization of some <strong>in</strong>efficient public mills could also help to improve <strong>the</strong> <strong>energy</strong><br />
<strong>efficiency</strong> of <strong>the</strong> cement <strong>in</strong>dustry <strong>in</strong> develop<strong>in</strong>g countries.<br />
5.5.2 Potential of <strong>energy</strong> conservation measures<br />
The present st<strong>and</strong>ard of a modern <strong>energy</strong> efficient cement plant <strong>in</strong> developed countries<br />
consists of <strong>the</strong> follow<strong>in</strong>g process technologies:<br />
- raw meal preparation us<strong>in</strong>g roller presses <strong>and</strong>/or vertical mills with high <strong>efficiency</strong><br />
separators <strong>and</strong> with dryer system based on heat recovery from <strong>the</strong> cyclone tower.<br />
- cl<strong>in</strong>ker burn<strong>in</strong>g <strong>in</strong> a short rotary kiln with 5-6 stages preheater cyclone towers <strong>and</strong><br />
precalc<strong>in</strong>er. Cl<strong>in</strong>ker heat should be recovered as secondary <strong>and</strong> tertiary preheated<br />
combustion air for <strong>the</strong> kiln <strong>and</strong> <strong>the</strong> precalc<strong>in</strong>er respectively.<br />
- cool<strong>in</strong>g of cl<strong>in</strong>ker <strong>in</strong> a grate cooler.<br />
- gr<strong>in</strong>d<strong>in</strong>g of cl<strong>in</strong>ker <strong>in</strong> a modern semi-f<strong>in</strong>ish or f<strong>in</strong>ish system consist<strong>in</strong>g of roller<br />
presses, high <strong>efficiency</strong> separator <strong>and</strong> a f<strong>in</strong>al ball mill.<br />
As horizontal technologies, <strong>the</strong> use of low grade fuel, higher level of waste heat recovery<br />
<strong>and</strong> cogeneration can be seen <strong>in</strong> a modern cement mill.<br />
Therefore, <strong>the</strong> potential of <strong>energy</strong> sav<strong>in</strong>gs can be estimated by assum<strong>in</strong>g that all <strong>the</strong><br />
facilities would be upgraded to <strong>the</strong> best available technologies mentioned above. However,<br />
<strong>the</strong> applications of new <strong>and</strong> <strong>energy</strong> efficient technologies are site specific <strong>and</strong> detail<br />
feasibility studies should be carried out on a case by case basis.<br />
The potential of major <strong>energy</strong> conservation measures for <strong>the</strong> countries under this study are<br />
given <strong>in</strong> Table 5.8.
Profile of <strong>the</strong> Cement Industry <strong>in</strong> Asian Industrializ<strong>in</strong>g Countries 49<br />
Table 5.8. Potential of <strong>energy</strong> conservation measures #<br />
Energy Conservation Measures Ch<strong>in</strong>a India Philipp<strong>in</strong>es Sri Lanka<br />
Short Term Measures<br />
- Management practices<br />
- Control of slurry water content<br />
- Combustion air control<br />
- Control on composition of raw materials<br />
- Insulation improvement of kilns<br />
- Power factor improvement<br />
Medium Term Measures<br />
- Dust recycl<strong>in</strong>g system<br />
- Reduction of water content of slurry<br />
- Installation of dual fir<strong>in</strong>g system<br />
- Retrofitt<strong>in</strong>g mechanized kilns<br />
- Introduction of suspension preheater <strong>and</strong><br />
precalc<strong>in</strong>er<br />
- Installation of high pressure roller mills<br />
- Waste heat recovery<br />
Long Term Measures<br />
- Conversion of wet to dry process with<br />
suspension preheater systems<br />
- Cogeneration<br />
- Computerization<br />
****<br />
****<br />
****<br />
***<br />
***<br />
****<br />
****<br />
**<br />
****<br />
****<br />
****<br />
****<br />
****<br />
***<br />
***<br />
****<br />
***<br />
**<br />
***<br />
***<br />
***<br />
***<br />
***<br />
****<br />
***<br />
-<br />
****<br />
****<br />
****<br />
**<br />
****<br />
****<br />
***<br />
***<br />
***<br />
***<br />
***<br />
***<br />
***<br />
***<br />
****<br />
-<br />
****<br />
****<br />
****<br />
****<br />
****<br />
****<br />
***<br />
-<br />
***<br />
***<br />
**<br />
****<br />
****<br />
-<br />
****<br />
-<br />
****<br />
****<br />
****<br />
-<br />
**<br />
****<br />
# Note: For each <strong>energy</strong> conservation measure, <strong>the</strong> relative scope of application is shown<br />
by <strong>the</strong> number of asterisks. For <strong>in</strong>stance, conversion of wet to dry process has a higher<br />
scope <strong>in</strong> Philipp<strong>in</strong>es where <strong>the</strong> share of wet process is 40% of total production than <strong>in</strong><br />
India where it is only 16%.<br />
5.6 Potential for Pollution Abatement<br />
For an <strong>energy</strong> <strong>in</strong>tensive <strong>in</strong>dustry with basically coal as <strong>the</strong> ma<strong>in</strong> <strong>energy</strong> source, any<br />
reduction <strong>in</strong> <strong>energy</strong> consumption itself is a pollution abatement measure. Apart from that,<br />
recovery <strong>and</strong> recycl<strong>in</strong>g of dust reduces not only <strong>the</strong> pollution load on <strong>the</strong> environment, but<br />
also <strong>the</strong> specific <strong>energy</strong> consumption. Some of <strong>the</strong> potential pollution abatement measures<br />
are listed <strong>in</strong> Table 5.9. Though <strong>the</strong> measures mentioned <strong>in</strong> <strong>the</strong> table can contribute to<br />
pollution abatement, some of <strong>the</strong>m also contribute to specific <strong>energy</strong> reduction. The<br />
measures are however listed only <strong>in</strong> case when <strong>the</strong>y contribute directly to pollution<br />
abatement.
50 Technology, Energy Efficiency <strong>and</strong> Environmental Externalities of <strong>the</strong> Cement Industry<br />
Table 5.9. Potential for pollution abatement measures #<br />
Pollution Abatement Measures<br />
Short Term Measures<br />
Ch<strong>in</strong>a India Philip<br />
-p<strong>in</strong>es<br />
- Management practices<br />
**** *** ****<br />
- Good house keep<strong>in</strong>g<br />
**** *** ***<br />
- Operat<strong>in</strong>g at optimized parameters<br />
**** *** ***<br />
- Full capacity utilization<br />
*** *** ***<br />
- Rigorous implementation of <strong>environmental</strong> regulations *** *** ***<br />
- Excess air control <strong>in</strong> combustion<br />
**** *** ***<br />
- Control water content at optimum for wet process<br />
Medium Term Measures<br />
*** * **<br />
- Use of low sulfur fuel<br />
*** *** ***<br />
- Conversion of wet process to dry process<br />
**** ** ***<br />
- Add suspension preheater <strong>and</strong> precalc<strong>in</strong>er to dry process **** *** ***<br />
- Dust recycl<strong>in</strong>g system<br />
*** *** ***<br />
- Elim<strong>in</strong>ation of wet scrubbers<br />
*** *** ***<br />
- Add ESPs <strong>and</strong> fabric filters to dust collection system<br />
*** *** ***<br />
- Use of dual fir<strong>in</strong>g system<br />
Long Term Measures<br />
-Use only dry process with suspension preheater <strong>and</strong> precalc<strong>in</strong>er<br />
*** *** ***<br />
system<br />
*** ** ***<br />
- Elim<strong>in</strong>ation of small scale plants<br />
- Improved process control by expert system <strong>and</strong> sensitive NOx<br />
**** *** ***<br />
analyzer<br />
**** **** ****<br />
Sri Lanka<br />
# Note: For each pollution abatement measure, <strong>the</strong> relative scope of application is shown<br />
by <strong>the</strong> number of asterisks as <strong>in</strong> Table 5.8.<br />
5.7 Conclusion<br />
The potential of <strong>energy</strong> sav<strong>in</strong>g <strong>in</strong> <strong>the</strong> cement <strong>in</strong>dustry is considerably high <strong>in</strong> <strong>the</strong><br />
develop<strong>in</strong>g countries where <strong>the</strong> small mills <strong>and</strong> outdated technologies dom<strong>in</strong>ate. Even <strong>in</strong><br />
European countries, <strong>the</strong> <strong>the</strong>oretical sav<strong>in</strong>g estimated was about 13% of <strong>the</strong> current total<br />
consumption <strong>in</strong> <strong>the</strong> cement <strong>in</strong>dustry.<br />
The conversion of wet to dry process, closure of <strong>in</strong>efficient small mills, higher<br />
dissem<strong>in</strong>ation of preheat<strong>in</strong>g <strong>and</strong> precalc<strong>in</strong>ation technologies <strong>and</strong> improv<strong>in</strong>g <strong>the</strong> gr<strong>in</strong>d<strong>in</strong>g<br />
facilities of raw materials <strong>and</strong> cl<strong>in</strong>ker could result <strong>in</strong> significant <strong>energy</strong> sav<strong>in</strong>gs <strong>in</strong> develop<strong>in</strong>g<br />
countries. The substitution of low grade fuel, <strong>in</strong>creased level of waste heat recovery <strong>and</strong><br />
cogeneration also provide major <strong>energy</strong> sav<strong>in</strong>g opportunities. One of <strong>the</strong> major barriers to<br />
harness <strong>the</strong> new <strong>energy</strong> efficient technologies is <strong>the</strong> lack of data at both micro <strong>and</strong> macro<br />
levels. Therefore, <strong>in</strong>stallation of measur<strong>in</strong>g equipment <strong>in</strong> production processes <strong>and</strong> regular<br />
****<br />
***<br />
***<br />
***<br />
***<br />
***<br />
-<br />
***<br />
-<br />
-<br />
-<br />
-<br />
-<br />
***<br />
-<br />
**<br />
****
Profile of <strong>the</strong> Cement Industry <strong>in</strong> Asian Industrializ<strong>in</strong>g Countries 51<br />
acquisition <strong>and</strong> updat<strong>in</strong>g of data would be <strong>the</strong> first step to improve <strong>the</strong> <strong>energy</strong> <strong>efficiency</strong> of<br />
<strong>the</strong> cement <strong>in</strong>dustry.<br />
As far as <strong>the</strong> national authorities are concerned, <strong>the</strong> required cooperative actions to<br />
improve <strong>energy</strong> <strong>efficiency</strong> <strong>in</strong> cement <strong>in</strong>dustry are <strong>the</strong> follow<strong>in</strong>gs: provide <strong>in</strong>formation about<br />
projects where new <strong>energy</strong> efficient technologies have been implemented successfully;<br />
create a better condition for <strong>technology</strong> transfer from <strong>in</strong>dustrialized countries <strong>and</strong> set up<br />
dissem<strong>in</strong>ation strategies for each efficient <strong>technology</strong>.
52 Technology, Energy Efficiency <strong>and</strong> Environmental Externalities of <strong>the</strong> Cement Industry<br />
6. PROFILE OF THE CEMENT INDUSTRY IN SELECTED ASIAN<br />
COUNTRIES<br />
This section evaluates <strong>the</strong> current status <strong>and</strong> technological trajectory of <strong>the</strong> cement <strong>in</strong>dustries <strong>in</strong><br />
four Asian countries, namely Ch<strong>in</strong>a, India, <strong>the</strong> Philipp<strong>in</strong>es <strong>and</strong> Sri Lanka.<br />
6.1 COUNTRY REPORT: CHINA<br />
6.1.1 Introduction<br />
Ch<strong>in</strong>a is a develop<strong>in</strong>g country with a huge population. In recent years, Ch<strong>in</strong>a’s economy <strong>and</strong> <strong>the</strong><br />
people’s liv<strong>in</strong>g st<strong>and</strong>ard have <strong>in</strong>creased very rapidly. The high economic growth caused a high<br />
dem<strong>and</strong> for <strong>energy</strong> <strong>and</strong> <strong>the</strong> primary <strong>energy</strong> consumption <strong>in</strong>creased by 85% from 1985 to 1993,<br />
with an average annual growth rate of 4.9%. The build<strong>in</strong>g material <strong>in</strong>dustry is known as a big<br />
<strong>energy</strong> consumer <strong>and</strong> its total <strong>energy</strong> consumption has amounted to 119 million tce, represent<strong>in</strong>g<br />
over 10% of <strong>the</strong> total <strong>energy</strong> consumption of Ch<strong>in</strong>a <strong>in</strong> 1990. The <strong>energy</strong> consumption by cement<br />
manufactur<strong>in</strong>g is about 35% of <strong>the</strong> build<strong>in</strong>g material <strong>in</strong>dustry. It has high <strong>energy</strong> <strong>in</strong>tensity per unit<br />
product <strong>and</strong> low <strong>energy</strong> <strong>efficiency</strong> of equipment. The discharge of waste gas, residues <strong>and</strong> water<br />
is 910,500 million m 3 , 3.09 million tons (Mt) <strong>and</strong> 252.56 Mt, respectively. It is very important to<br />
improve production technologies <strong>and</strong> aggr<strong>and</strong>ize <strong>energy</strong> <strong>efficiency</strong> for <strong>the</strong> reduction of<br />
<strong>environmental</strong> pollution.<br />
6.1.2 Technological trajectory of Ch<strong>in</strong>a’s cement <strong>in</strong>dustry<br />
Ch<strong>in</strong>a’s first cement plant was built <strong>in</strong> 1889 just 18 years after <strong>the</strong> first Portl<strong>and</strong> cement plant of<br />
<strong>the</strong> USA started its operations. The manual shaft kiln was adopted <strong>in</strong> <strong>the</strong> plant. By <strong>the</strong> 1930s,<br />
most exist<strong>in</strong>g plants with waste heat recovery generation kilns moved <strong>in</strong> from Japan, <strong>and</strong> by <strong>the</strong><br />
1950s, <strong>the</strong> wet process (identified with <strong>the</strong> technological development of <strong>the</strong> world at that time)<br />
had been adopted <strong>in</strong> most cement plants. A small number of cement plants adopted <strong>the</strong> Libor<br />
kilns, also considered to be an advanced <strong>technology</strong>. Meanwhile, <strong>the</strong> country started to<br />
manufacture complete sets of wet process equipment for export to o<strong>the</strong>r countries. It is said that<br />
by <strong>the</strong> end of <strong>the</strong> first Five-Year plann<strong>in</strong>g period, Ch<strong>in</strong>a was at par with <strong>the</strong> developed countries<br />
<strong>in</strong> terms of <strong>technology</strong> <strong>in</strong> <strong>the</strong> cement <strong>in</strong>dustry.<br />
In <strong>the</strong> <strong>in</strong>ternational level, <strong>the</strong> <strong>technology</strong> for suspension preheat<strong>in</strong>g (SP) kilns was be<strong>in</strong>g<br />
perfected. Two difficult problems, <strong>the</strong> adaptability of strong basic material <strong>and</strong> <strong>the</strong> recovery of<br />
waste dust, had been solved with <strong>the</strong> new <strong>technology</strong>. SP kilns with high <strong>the</strong>rmal <strong>efficiency</strong> was<br />
developed <strong>and</strong> <strong>the</strong> first large SP kiln which produced 1800 tons cl<strong>in</strong>ker per day was built up <strong>in</strong><br />
1965. This had a larger capacity than <strong>the</strong> long wet kiln developed <strong>in</strong> 1970. From <strong>the</strong>n on, <strong>the</strong> dry<br />
process has been adopted <strong>in</strong> <strong>the</strong> production of cement, <strong>and</strong> due to <strong>the</strong> keen competition <strong>in</strong> <strong>the</strong><br />
cement <strong>in</strong>dustry <strong>in</strong> <strong>the</strong> 1970s, <strong>the</strong> mechanized shaft kilns <strong>in</strong> <strong>the</strong> developed countries were f<strong>in</strong>ally<br />
elim<strong>in</strong>ated.
Profile of <strong>the</strong> Cement Industry <strong>in</strong> Ch<strong>in</strong>a 53<br />
As opposed to <strong>the</strong> technological trends of cement production <strong>in</strong> <strong>the</strong> first world, Ch<strong>in</strong>a had been<br />
develop<strong>in</strong>g small cement plants with shaft kilns s<strong>in</strong>ce <strong>the</strong> second Five-Year Plan, <strong>and</strong> most of<br />
<strong>the</strong>se were manually-operated shaft kilns. The technological gap between <strong>the</strong> advanced nations of<br />
<strong>the</strong> world <strong>and</strong> Ch<strong>in</strong>a became <strong>in</strong>creas<strong>in</strong>gly wider.<br />
Brought about by this situation, <strong>the</strong> Ch<strong>in</strong>ese government has done a lot both <strong>in</strong> <strong>the</strong> development<br />
of <strong>the</strong> build<strong>in</strong>g material <strong>in</strong>dustry <strong>and</strong> improvement of <strong>energy</strong> <strong>efficiency</strong> s<strong>in</strong>ce <strong>the</strong> 1980s. After<br />
1985, Ch<strong>in</strong>a has become <strong>the</strong> biggest cement produc<strong>in</strong>g country <strong>in</strong> <strong>the</strong> world. From <strong>the</strong> follow<strong>in</strong>g<br />
tables one can follow <strong>the</strong> development trajectory of <strong>the</strong> country’s cement <strong>in</strong>dustry <strong>and</strong> its<br />
characteristics.<br />
6.1.2.1 Higher growth rate of production<br />
Tables 6.1.1 <strong>and</strong> 6.1.2 show <strong>the</strong> GDP <strong>and</strong> cement production growth rates, respectively. The<br />
cement production grew at an average rate of about 11% from 1985 to 1993, higher than that of<br />
<strong>the</strong> GDP (about 9.2%).<br />
Table 6.1.1. The <strong>in</strong>dex <strong>and</strong> growth rate of GDP from 1978 to 1993 <strong>in</strong> Ch<strong>in</strong>a<br />
Year GDP Index GDP growth rate (%) Year GDP Index GDP growth rate (%)<br />
1978 100.0 1988 251.3 11.4<br />
1979 107.6 7.6 1989 262.2 4.3<br />
1980 116.0 7.8 1990 272.4 3.9<br />
1985 187.4 12.9 1991 294.2 8.0<br />
1986 203.3 8.5 1992 334.2 13.6<br />
1987 225.6 11.0 1993 379.0 13.4<br />
Source: Statistical Yearbook of Ch<strong>in</strong>a, 1994 (The growth rate is calculated from <strong>the</strong><br />
<strong>in</strong>dex)<br />
Table 6.1.2. Cement production (Mt)<br />
Year Production Growth rate (%) Year Production Growth rate (%)<br />
1960 15.65 1987 186.25 12.06<br />
1965 16.34 4.4 1988 210.14 12.83<br />
1970 25.75 57.6 1989 210.29 0.07<br />
1975 46.26 79.7 1990 209.71 -0.3<br />
1980 79.86 72.6 1991 252.61 20.46<br />
1985 159.55 99.8 1992 308.22 22.01<br />
1986 166.06 4.08 1993 367.88 19.36<br />
Source: Statistical Yearbook of Ch<strong>in</strong>a, 1994
54 Technology, Energy Efficiency <strong>and</strong> Environmental Externalities of <strong>the</strong> Cement Industry<br />
6.1.2.2 Rapid <strong>in</strong>crease of small size cement plants<br />
Because of <strong>the</strong> high dem<strong>and</strong> for cement, many small size cement plants have been built through<br />
township <strong>and</strong> village enterprises. By <strong>the</strong> end of 1991, a total of 6177 enterprises had cement<br />
production licenses. There are only 66 large-medium size plants. Small size plants have lesser<br />
<strong>in</strong>vestments <strong>and</strong> have short construction periods. Consequently, <strong>the</strong>y have low product grades<br />
<strong>and</strong> productivity. Table 6.1.3 shows <strong>the</strong> mix of production <strong>in</strong> <strong>the</strong> cement <strong>in</strong>dustry.<br />
6.1.2.3 Production satisfies <strong>the</strong> <strong>in</strong>ternal dem<strong>and</strong><br />
In <strong>the</strong> middle of <strong>the</strong> 1980’s, Ch<strong>in</strong>a had to spend a large amount of money to import cement to<br />
satisfy <strong>the</strong> <strong>in</strong>ternal dem<strong>and</strong>. Now, Ch<strong>in</strong>a has become a net exporter of cement, although <strong>the</strong><br />
consumption level of cement per capita is very low compared with o<strong>the</strong>r developed countries.<br />
Figure 6.1.1 <strong>and</strong> Tables 6.1.4 <strong>and</strong> 6.1.5 show <strong>the</strong> per capita cement consumption of Ch<strong>in</strong>a.<br />
Year Installed<br />
capacity<br />
(Mt)<br />
Table 6.1.3. Cement production mix<br />
Total cement<br />
production<br />
(Mt)<br />
Production by largemedium<br />
size plant<br />
(Mt)<br />
Proportion of<br />
large-medium size<br />
plant (%)<br />
Production<br />
of cl<strong>in</strong>ker<br />
(Mt)<br />
1960 15.65 11.01 70.35<br />
1965 18.65 16.34 11.06 67.69<br />
1970 33.98 25.75 15.17 58.91<br />
1975 57.52 46.26 19.09 41.27<br />
1980 86.80 79.86 25.58 32.03<br />
1985 153.43 159.55 32.35 20.28<br />
1986 177.20 166.06 32.35 19.48<br />
1987 204.67 186.25 33.89 18.20<br />
1988 232.24 210.14<br />
1989 252.64 210.29 35.45 16.87<br />
1990 268.89 209.71 39.86 19.01 154.9<br />
1991 293.95 252.61 42.50 16.82 186.5<br />
1992 308.22 85.99 27.90<br />
1993 367.88 86.91 24.36<br />
Sources: Statistical Yearbook of Ch<strong>in</strong>a, 1994<br />
Statistical Yearbook of Build<strong>in</strong>g Material Industry 1991,1992<br />
6.1.2.4 Better product quality <strong>and</strong> low <strong>energy</strong> <strong>in</strong>tensity<br />
Table 6.1.6 shows <strong>the</strong> trajectory of <strong>the</strong> ma<strong>in</strong> techno-economic <strong>in</strong>dicators of <strong>the</strong> cement <strong>in</strong>dustry.<br />
The heat <strong>in</strong>tensity of cl<strong>in</strong>ker has decl<strong>in</strong>ed due to successful achievements <strong>in</strong> <strong>energy</strong> conservation.<br />
The <strong>energy</strong> <strong>in</strong>tensity, however, is still quite high <strong>and</strong> <strong>the</strong>re is a large potential for improvement.
Profile of <strong>the</strong> Cement Industry <strong>in</strong> Ch<strong>in</strong>a 55<br />
kg/capita<br />
350<br />
300<br />
250<br />
200<br />
150<br />
100<br />
50<br />
0<br />
Year Cement<br />
production<br />
1960<br />
1965<br />
1970<br />
1975<br />
1980<br />
1985<br />
1986<br />
1987<br />
Year<br />
1988<br />
1989<br />
1990<br />
1991<br />
1992<br />
1993<br />
Figure 6.1.1. Cement consumption per capita<br />
Table 6.1.4. Cement resource balance table of Ch<strong>in</strong>a<br />
(Mt)<br />
Import<br />
(Mt)<br />
Export<br />
(Mt)<br />
National<br />
consumption<br />
(Mt)<br />
Consumption<br />
(kg/capita)<br />
1960 15.65<br />
1965 16.34 0.31 1.02 15.63 22<br />
1970 25.75 0.08 0.43 26.42 32<br />
1975 46.26 0.43 0.91 45.78 50<br />
1980 79.86 1.32 1.00 80.18 81<br />
1985 159.55 3.66 0.14 163.07 154<br />
1986 166.06 3.55 0.19 169.42 158<br />
1987 186.25 2.11 0.17 188.19 172<br />
1988 210.14 1.52 0.15 211.51 191<br />
1989 210.29 1.23 0.44 211.08 187<br />
1990 209.71 0.4 6.83 203.28 178<br />
1991 252.61 0 10.74 241.87 209<br />
1992 308.22 0 6.45 301.77 258<br />
1993 367.88 0 2.45 365.43 308<br />
Source: Statistical Yearbook of Industrial Economy of Ch<strong>in</strong>a, 1993<br />
Table 6.1.5. Comparison of cement consumption per capita (1990)<br />
Country Cement consumption per capita (kg)<br />
Italy 749<br />
Spanish 744<br />
Former West Germany 429
56 Technology, Energy Efficiency <strong>and</strong> Environmental Externalities of <strong>the</strong> Cement Industry<br />
Former USSR 470<br />
France 448<br />
Denmark 256<br />
Ch<strong>in</strong>a 178<br />
Table 6.1.6. Ma<strong>in</strong> techno-economic <strong>in</strong>dicators of <strong>the</strong> cement <strong>in</strong>dustry<br />
Year As percent<br />
of product<br />
up to<br />
st<strong>and</strong>ard<br />
(%)<br />
Grade<br />
of<br />
cement<br />
Runn<strong>in</strong>g<br />
ratio of rotary<br />
kiln<br />
(%)<br />
Heat <strong>in</strong>tensity<br />
of cl<strong>in</strong>ker<br />
(kgoe/ton)<br />
Integrated<br />
electricity<br />
<strong>in</strong>tensity of<br />
cement<br />
(kWh/ton)<br />
1960 402 74.93 278.2<br />
1965 99.99 483 84.50 221.8<br />
1970 99.80 479 81.20 223.1 91.20<br />
1975 99.80 483 76.82 215.9 95.86<br />
1980 99.99 448 85.27 206.54 96.65<br />
1985 99.99 604 84.07 201.10 103.93<br />
1986 99.99 611 81.34 198.15 105.59<br />
1987 100 618 80.77 193.30 106.23<br />
1988 100 614 78.40 191.20 107.31<br />
1989 99.99 605 78.77 188.3 108.67<br />
1990 100 604 79.49 185.4 109.93<br />
1991 99.99 605 79.61 183.5 110.53<br />
1992 100 610 81.57 178.3 110.30<br />
Source: Statistical Yearbook of Industrial Economy of Ch<strong>in</strong>a, 1993<br />
6.1.2.5 Coal as <strong>the</strong> ma<strong>in</strong> fuel<br />
Figure 6.1.2 <strong>and</strong> Tables 6.1.7 <strong>and</strong> 6.1.8 show <strong>the</strong> <strong>energy</strong> consumption <strong>and</strong> <strong>the</strong> mix of <strong>the</strong> cement<br />
<strong>in</strong>dustry <strong>in</strong> Ch<strong>in</strong>a. It can be seen that coal is <strong>the</strong> ma<strong>in</strong> fuel used <strong>in</strong> <strong>the</strong> <strong>in</strong>dustry, <strong>and</strong> this causes<br />
severe <strong>environmental</strong> pollution.<br />
Table 6.1.7. Energy consumption of cement <strong>in</strong>dustry <strong>in</strong> 1985 <strong>and</strong> 1990<br />
Indicator 1985 1990<br />
Specific Coal Consumption (kgoe/ton cement)<br />
116.3<br />
for large <strong>and</strong> medium size plant<br />
109.9<br />
for small size plant<br />
Specific Electricity Consumption (kWh/ton cement)<br />
106.4<br />
for large <strong>and</strong> medium size plant<br />
103.56 110<br />
for small size plant<br />
100 100
Profile of <strong>the</strong> Cement Industry <strong>in</strong> Ch<strong>in</strong>a 57<br />
Coal Consumption (ktoe)<br />
for large <strong>and</strong> medium size plant<br />
for small size plant<br />
Electricity Consumption (G Wh)<br />
for large <strong>and</strong> medium size plant<br />
for small size plant<br />
Total Energy Consumption (kgoe) (1)<br />
for large <strong>and</strong> medium size plant<br />
for small size plant<br />
Source: State Adm<strong>in</strong>istration of Build<strong>in</strong>g Material Industry of Ch<strong>in</strong>a, 1992<br />
90%<br />
S o ild fu el Liquid fuel Electricity<br />
16864.5<br />
14667<br />
Figure 6.1.2. F<strong>in</strong>al <strong>energy</strong> mix of cement <strong>in</strong>dustry <strong>in</strong> 1990<br />
%<br />
7%<br />
22452.6<br />
4380.6<br />
18068.5<br />
21370<br />
4390<br />
16985<br />
20950.7 28496.0<br />
5620.6<br />
22875.4<br />
Table 6.1.8. F<strong>in</strong>al <strong>energy</strong> consumption <strong>and</strong> its mix <strong>in</strong> cement <strong>in</strong>dustry (1990)<br />
Fuel type Energy consumption<br />
(ktoe)<br />
Mix (%)<br />
Total 21185.5 100<br />
Solid fuel 19210.8 90.68<br />
Liquid fuel 534.1 2.52<br />
Heat 13.3 0.06<br />
Electricity (1) 1427.3 6.74<br />
Source: Energy Balance Table <strong>in</strong> 1990 (Note: 1 kWh = 3600 kJ = 0.086 kgoe)<br />
It should be mentioned that a statistical system has been built s<strong>in</strong>ce <strong>the</strong> 1980s. It is difficult,<br />
however, to get historical data for <strong>the</strong> cement <strong>in</strong>dustry. In spite of that, <strong>the</strong> technological<br />
trajectory of <strong>the</strong> cement <strong>in</strong>dustry <strong>in</strong> Ch<strong>in</strong>a can still be seen.
58 Technology, Energy Efficiency <strong>and</strong> Environmental Externalities of <strong>the</strong> Cement Industry<br />
6.1.3 Evolution of <strong>energy</strong> <strong>efficiency</strong> <strong>in</strong> <strong>the</strong> cement <strong>in</strong>dustry<br />
Table 6.1.9 shows <strong>the</strong> <strong>energy</strong> <strong>in</strong>tensity of cement manufactur<strong>in</strong>g <strong>in</strong> selected countries.<br />
Table 6.1.9. Comparison of specific <strong>energy</strong> consumption with developed countries<br />
Country Year Heat <strong>in</strong>tensity<br />
(kgoe/ton<br />
cl<strong>in</strong>ker)<br />
Japan<br />
Former<br />
West<br />
Germany<br />
Ch<strong>in</strong>a (for<br />
large <strong>and</strong><br />
medium<br />
size plant)<br />
1980<br />
1985<br />
1988<br />
1990<br />
1991<br />
1980<br />
1988<br />
1990<br />
1980<br />
1985<br />
1988<br />
1990<br />
84.2<br />
77.5<br />
70.9<br />
70.4<br />
70.2<br />
76.9<br />
72.4<br />
62.7<br />
144.3<br />
140.0<br />
133.9<br />
129.8<br />
Electricity<br />
<strong>in</strong>tensity<br />
(kWh/ton<br />
cement)<br />
124<br />
114<br />
103<br />
102.2<br />
102.6<br />
104<br />
109<br />
104<br />
96.65<br />
103.9<br />
107.3<br />
109.9<br />
Integrated <strong>energy</strong><br />
<strong>in</strong>tensity<br />
(kgoe/ton cement)<br />
94.9<br />
87.3<br />
79.8<br />
79.1<br />
79.0<br />
85.8<br />
81.8<br />
71.7<br />
146.2<br />
145.6<br />
140.0<br />
140.7<br />
Source: State Adm<strong>in</strong>istration of Build<strong>in</strong>g Material Industry of Ch<strong>in</strong>a, 1992<br />
The reasons for <strong>the</strong> low <strong>energy</strong> <strong>efficiency</strong> can be identified <strong>in</strong> <strong>the</strong> follow<strong>in</strong>g aspects:<br />
• Outdated production process <strong>in</strong> enterprises<br />
Figure 6.1.3 shows <strong>the</strong> process mix of large <strong>and</strong> medium-size cement plants. The water content<br />
of mix<strong>in</strong>g raw material is about 24-28% <strong>in</strong> <strong>the</strong> rotary kiln wet process, but it is only 7-14% <strong>in</strong> <strong>the</strong><br />
dry process. A large amount of heat must be used for evaporat<strong>in</strong>g water, so <strong>the</strong> <strong>energy</strong> <strong>in</strong>tensity<br />
of wet process is 30% higher than <strong>the</strong> dry process (Table 6.1.10). In some developed countries<br />
like Japan <strong>and</strong> <strong>the</strong> former West Germany, <strong>the</strong> wet process has already been elim<strong>in</strong>ated <strong>in</strong> favor<br />
of <strong>the</strong> dry process.
Profile of <strong>the</strong> Cement Industry <strong>in</strong> Ch<strong>in</strong>a 59<br />
100%<br />
90%<br />
80%<br />
70%<br />
60%<br />
50%<br />
40%<br />
30%<br />
20%<br />
10%<br />
0%<br />
46.4<br />
46.9<br />
53.6 53.1<br />
40<br />
60<br />
47<br />
53<br />
1970 1975 1980 1990<br />
Dry & Semi-dry Process<br />
Wet Process<br />
Figure 6.1.3. Process mix of large-medium size plant of <strong>the</strong> cement <strong>in</strong>dustry<br />
Table 6.1.10. Energy <strong>in</strong>tensity of ma<strong>in</strong> large <strong>and</strong> medium cement plants of Ch<strong>in</strong>a<br />
Heat <strong>in</strong>tensity of cl<strong>in</strong>ker (kgoe/ton)<br />
Dry process<br />
Semi-dry process<br />
Wet process<br />
Electricity <strong>in</strong>tensity of cement<br />
(kWh/ton)<br />
Dry process<br />
Semi-dry process<br />
Wet process<br />
Year 1980 1985 1990<br />
153.0<br />
119.6<br />
149.6<br />
89.5<br />
115.3<br />
95.6<br />
Source: Energy Statistical Yearbook of Ch<strong>in</strong>a, 1991<br />
• Low Efficiency of Equipment<br />
134.2<br />
119.1<br />
148.4<br />
105.4<br />
119.5<br />
99.4<br />
115.1<br />
111.2<br />
143.3<br />
115.2<br />
121.3<br />
103.9<br />
Table 6.1.11 shows <strong>the</strong> <strong>the</strong>rmal <strong>efficiency</strong> of <strong>the</strong> different k<strong>in</strong>ds of kilns <strong>in</strong> Ch<strong>in</strong>a compared to<br />
developed countries.<br />
• Unreasonable Mix of Equipment<br />
Table 6.1.12 shows <strong>the</strong> mix of kilns <strong>in</strong> Ch<strong>in</strong>a. There are about 5500 shaft kilns <strong>in</strong> small cement<br />
plants, <strong>and</strong> <strong>the</strong>ir output makes up 80% of Ch<strong>in</strong>a’s total output. Most of <strong>the</strong>m have low <strong>energy</strong><br />
<strong>efficiency</strong> <strong>and</strong> produce lower grade cement. The output of advanced dry process kilns is just<br />
8.9% of <strong>the</strong> total. Table 6.1.13 shows <strong>the</strong> comparison of technological <strong>in</strong>dicators between two<br />
k<strong>in</strong>ds of kilns <strong>in</strong> 1991.
60 Technology, Energy Efficiency <strong>and</strong> Environmental Externalities of <strong>the</strong> Cement Industry<br />
Table 6.1.11. Thermal <strong>efficiency</strong> of kilns <strong>in</strong> 1990 (%)<br />
Kiln type Average level for<br />
Ch<strong>in</strong>a<br />
Advanced level of world<br />
Wet rotary kiln for large- 27.6 31<br />
medium size plant<br />
New suspension preheater (NSP<br />
kiln) for large-medium size plant<br />
41.7 52.4<br />
Shaft kiln for large-medium size<br />
plant<br />
36.8 60.9<br />
Semi-dry kiln for large-medium<br />
size plant<br />
35 48.3<br />
Mechanized shaft kiln for small<br />
size plant<br />
35.4 47.3<br />
Source: State Adm<strong>in</strong>istration of Build<strong>in</strong>g Material Industry of Ch<strong>in</strong>a, 1992<br />
• Unbalanced Technology Development<br />
Because of <strong>the</strong> differences <strong>in</strong> management level <strong>and</strong> labor quality, <strong>the</strong>re is a large gap of <strong>energy</strong><br />
<strong>efficiency</strong> among <strong>the</strong> different plants as shown <strong>in</strong> Tables 6.1.14 <strong>and</strong> 6.1.15<br />
Large & medium size plant:<br />
Table 6.1.12. Mix of kilns <strong>in</strong> 1990<br />
Kiln type Numbe<br />
r<br />
Percent of<br />
production (%)<br />
Wet rotary kiln 108 9.72<br />
Waste heat recovery for electricity kiln 35 2.22<br />
Preheater kiln 12 0.84<br />
New suspension preheater(NSP kiln) 13 3.15<br />
Libor kiln 14 3.07<br />
Small size plant:<br />
Mechanized shaft kiln 3241 60.74<br />
Small size rotary kiln 489 9.54<br />
Manual operation shaft kiln >2000 10.72<br />
Source: State Adm<strong>in</strong>istration of Build<strong>in</strong>g Material Industry of Ch<strong>in</strong>a, 1993
Profile of <strong>the</strong> Cement Industry <strong>in</strong> Ch<strong>in</strong>a 61<br />
• Small Scale Equipment<br />
Due to <strong>the</strong> economies of scale, <strong>the</strong> use of advanced technologies to improve <strong>energy</strong> <strong>efficiency</strong><br />
may not be beneficial to <strong>the</strong> small scale firms. Table 6.1.16 shows <strong>the</strong> difference of capacity per<br />
kiln between Ch<strong>in</strong>a <strong>and</strong> Japan.<br />
Table 6.1.13. Comparison of technological <strong>in</strong>dicators between two k<strong>in</strong>ds of kilns <strong>in</strong> 1991<br />
(capacity > 88 k ton/kiln)<br />
Revolv<strong>in</strong>g kiln for<br />
Large-medium size<br />
plant<br />
Vertical kiln for<br />
Medium-small size<br />
plant<br />
Average<br />
Qualified ratio of product (%) 99.99 99.99 99.99<br />
Cl<strong>in</strong>ker grade (#) 595 569 580<br />
Cement grade (#) 476 428 449<br />
Energy use (toe/ton cement) 143.7 114.0 127.0<br />
Coal use <strong>in</strong> cl<strong>in</strong>ker mak<strong>in</strong>g (toe/ton cl<strong>in</strong>ker) 132.3 103.5 116.0<br />
Electricity use (kWh/ton cement) 111.78 91.17 99.96<br />
Kiln number (sets) 435 1438<br />
Production per hour (ton/hour) 5705.2 7744.0<br />
Runn<strong>in</strong>g ratio (%) 85.04 68.97<br />
Productivity (ton/employee) 211.47 161.79 180.21<br />
Source: Statistical Reference of National Build<strong>in</strong>g Material Industry, 1991<br />
Table 6.1.14. Specific <strong>energy</strong> use of different kilns <strong>in</strong> Ch<strong>in</strong>a (kgoe/ton cl<strong>in</strong>ker)<br />
Kiln type Average level Advanced level Gap<br />
Wet rotary kiln 152.2 145.4 6.8<br />
Waste heat recovery generator<br />
kiln<br />
174.5 139.0 35<br />
Shaft-preheater kiln 160.7 153.9 6.8<br />
Cyclone preheater 186.1 157.7 28.4<br />
Suspension preheater kiln 188.21 162.72 25.48<br />
Inner hollow kiln 293.45 230.64 62.81<br />
Libor kiln 211.05 188.81 22.24<br />
Mechanized kiln 199.81 142.65 57.16<br />
Semi-mechanized kiln 229.71 147.58 82.13<br />
Manual operation kiln 283.48 208.70 74.78<br />
Source: State Adm<strong>in</strong>istration of Build<strong>in</strong>g Material Industry of Ch<strong>in</strong>a, 1993<br />
6.1.4 Environmental <strong>externalities</strong> of technological development<br />
An <strong>in</strong>vestigation of <strong>in</strong>dustrial pollution <strong>in</strong> 1985 identified 13 <strong>in</strong>dustrial sub-sectors as major<br />
sources of pollution, with <strong>in</strong>dividual waste discharges of over 100 Bm 3 . The rate of total waste<br />
gas emissions amounted to 6128.32 Bm 3 /year, or 88.4% of <strong>the</strong> national total waste gas emissions<br />
(Table 6.1.18). Among <strong>the</strong>se <strong>in</strong>dustrial sectors, <strong>the</strong> build<strong>in</strong>g materials <strong>in</strong>dustry ranks second after
62 Technology, Energy Efficiency <strong>and</strong> Environmental Externalities of <strong>the</strong> Cement Industry<br />
<strong>the</strong> power generation sector <strong>in</strong> terms of waste gas emissions <strong>and</strong> emission per unit of gross<br />
output.<br />
Table 6.1.15. Energy <strong>efficiency</strong> status <strong>in</strong> 1991<br />
Maximum Average M<strong>in</strong>imum<br />
Specific <strong>energy</strong> use for large <strong>and</strong> medium size<br />
plant (kgoe/ton cement)<br />
189.7 119.0 98.7<br />
Electricity use for large <strong>and</strong> medium size plant<br />
(kWh/ton cement)<br />
135 109.94 86<br />
Specific coal use for cl<strong>in</strong>ker (kgoe/ton cl<strong>in</strong>ker) 170.1 112.0 77.0<br />
Source: Energy Conservation Reference SPC, Ch<strong>in</strong>a, 1993<br />
Table 6.1.16. Comparison of capacity per kiln<br />
Number of kilns (set) 1985<br />
1987<br />
1990<br />
Capacity (k ton) 1985<br />
1987<br />
Average capacity per kiln<br />
(k ton)<br />
Source: Cement No. 1, 1993<br />
1990<br />
1985<br />
1987<br />
1990<br />
Year Ch<strong>in</strong>a Japan<br />
2871<br />
3912<br />
204670<br />
268890<br />
71<br />
69<br />
97<br />
96<br />
81<br />
97322<br />
97221<br />
87808<br />
1003<br />
1013<br />
1084<br />
Table 6.1.18. Waste gas emission from <strong>in</strong>dustrial sectors (1985)<br />
Waste gas emission<br />
Sector<br />
(billion m 3 Emission per<br />
/year)<br />
% of unit gross<br />
From From fuel<br />
national output<br />
proces<br />
s<br />
burn<strong>in</strong>g Total total (m 3 /yuan)<br />
Electric power, steam <strong>and</strong> hot water<br />
production <strong>and</strong> supply<br />
27.2 1592.5 1619.7 23.36 67.47<br />
Build<strong>in</strong>g material <strong>in</strong>dustry 681.4 496.5 1177.9 16.98 35.54<br />
Smelt<strong>in</strong>g & press<strong>in</strong>g of ferrous metals 429.6 408.1 837.7 12.08 14.55<br />
Chemical <strong>in</strong>dustry 336.8 350.5 687.3 9.91 12.33<br />
Coal m<strong>in</strong><strong>in</strong>g <strong>and</strong> process<strong>in</strong>g 263.0 132.4 395.4 5.70 21.75<br />
O<strong>the</strong>rs n/a n/a 1410.32 20.33 -<br />
Industry sub-total 6128.32 88.40 n/a<br />
National total 2710.2 4224.8 6934.90 9.33<br />
Source: National Industrial Pollution Source Investigation, Evaluation <strong>and</strong> Research, 1990<br />
The ma<strong>in</strong> pollutants discharged by cement plants are dust, toxic gases, waste water <strong>and</strong> noise of<br />
which, dust <strong>and</strong> toxic gases have <strong>the</strong> greatest impact on <strong>the</strong> quality of <strong>the</strong> atmosphere. From<br />
Tables 6.1.19 to 6.1.21, which show <strong>the</strong> various <strong>environmental</strong> pollutants of <strong>the</strong> cement <strong>in</strong>dustry
Profile of <strong>the</strong> Cement Industry <strong>in</strong> Ch<strong>in</strong>a 63<br />
<strong>in</strong> 1991 <strong>and</strong> 1993, it can be seen that Ch<strong>in</strong>a has made an effort to reduce <strong>the</strong> emission of<br />
<strong>environmental</strong> pollutants from <strong>the</strong> cement <strong>in</strong>dustry <strong>in</strong> recent years.<br />
Table 6.1.19. Discharge <strong>and</strong> treatment of waste water by cement <strong>in</strong>dustry<br />
Year 1991 1993<br />
Number of Enterprises(unit) 1994 2418<br />
Total Industrial Waste Water Discharged (k ton) 228420 252560<br />
of which:<br />
Discharged Directly to Rivers, Lakes <strong>and</strong> Reservoirs (kton) 156880 181920<br />
% of total <strong>in</strong>dustrial waste water discharged 68.68 72.0<br />
Discharged Directly to Sea (k ton) 370 320<br />
% of total <strong>in</strong>dustrial waste water discharged 0.16 0.13<br />
Discharged Directly to Treatment Plant (k ton) 600 90<br />
% of total <strong>in</strong>dustrial waste water discharged 0.26 0.04<br />
Industrial Waste Water Reach<strong>in</strong>g Discharge St<strong>and</strong>ards (k ton) 153930 173260<br />
Proportion of Reach<strong>in</strong>g Discharge St<strong>and</strong>ards (% ) 67.4 68.6<br />
Source: Statistical Yearbook of Ch<strong>in</strong>a, 1994<br />
From 1991 to 1993, an <strong>in</strong>creas<strong>in</strong>g proportions of waste water is discharged directly to <strong>the</strong> lakes,<br />
rivers <strong>and</strong> reservoirs <strong>and</strong> a decreas<strong>in</strong>g amount goes to <strong>in</strong>dustrial treatment plants. There has been<br />
an <strong>in</strong>crease <strong>in</strong> <strong>the</strong> proportions of waste water discharges be<strong>in</strong>g able to reach <strong>in</strong>dustry st<strong>and</strong>ards.<br />
As shown <strong>in</strong> Table 6.1.20, <strong>the</strong> total quantity of dust discharged from <strong>the</strong> cement manufactur<strong>in</strong>g<br />
process accounts for about 1.14 <strong>and</strong>0.9 % (for 1991 <strong>and</strong> 1993, respectively) of <strong>the</strong> total cement<br />
production <strong>in</strong> <strong>the</strong> same years (refer to Table 6.1.3 for total production of cement). It is estimated<br />
that <strong>the</strong> dust discharge for large <strong>and</strong> medium size plants accounts for 2% of <strong>the</strong>ir production as<br />
compared to 3.5% <strong>in</strong> small size plants. This is attributed to <strong>the</strong> adoption of advanced abatement<br />
technologies <strong>in</strong> <strong>the</strong> larger plants. In some developed countries, this figure has been cut down<br />
below 0.01%, <strong>and</strong> <strong>the</strong> discharged density has been controlled at 30 mg/m 3 . Ch<strong>in</strong>a’s discharge<br />
control level, meanwhile, has just reached <strong>the</strong> 1960s’ level of <strong>the</strong> developed countries.<br />
Figure 6.1.4 shows <strong>the</strong> comparison of waste gas emissions from fuel consumption <strong>and</strong> product<br />
processes <strong>in</strong> 1991 <strong>and</strong> 1993, respectively. The large reduction <strong>in</strong> <strong>the</strong> proportion of waste gas<br />
emission between <strong>the</strong> two-year period is due to <strong>the</strong> <strong>energy</strong> conservation programs <strong>and</strong> measures<br />
adopted by <strong>the</strong> <strong>in</strong>dustry. It is worthy to note, however, that air pollution <strong>in</strong> <strong>the</strong> cement <strong>in</strong>dustry<br />
is not of <strong>the</strong> coal-smoke type. This has important implications for <strong>energy</strong> <strong>efficiency</strong><br />
improvement <strong>and</strong> <strong>the</strong> application of pollution abatement technologies.<br />
Table 6.1.20. Emission <strong>and</strong> treatment of waste gas by cement <strong>in</strong>dustry<br />
Year 1991 1993<br />
Total Volume of Waste Gas Emission (Million cu. m) 701600 910500<br />
Waste Gas from Fuel 98000 119800
64 Technology, Energy Efficiency <strong>and</strong> Environmental Externalities of <strong>the</strong> Cement Industry<br />
<strong>in</strong> which: Soot <strong>and</strong> Dust Removed 68800 88400<br />
Removed Ratio (%) 70.2 73.8<br />
Waste Gas <strong>in</strong> <strong>the</strong> Process of Production 603800 790600<br />
<strong>in</strong> which: Gas Purified 404700 599800<br />
Purified Ratio (%) 67.0 75.9<br />
Proportion of Waste Gas from Fuel (%) 14.0 13.2<br />
Proportion of Waste Gas from Process (%) 86.0 86.8<br />
Industrial SO2 Discharged (ton) 560000 666703<br />
Industrial SO2 Removed (ton) 30000 48373<br />
SO2 Removed Ratio (%) 5.36 7.26<br />
Industrial Soot Discharged (ton) 260000 392669<br />
Industrial Soot Removed (ton) 470000 756125<br />
Soot Removed Ratio (%) 64.38 65.82<br />
Industrial Dust Discharged (ton) 2890000 3353936<br />
Industrial Dust Removed (ton) 9220000 12193140<br />
Dust Removed Ratio (%) 76.14 78.38<br />
Source: Statistical Yearbook of Ch<strong>in</strong>a, 1994<br />
Table 6.1.21. Production, use <strong>and</strong> treatment of waste residue <strong>in</strong> cement mak<strong>in</strong>g<br />
from<br />
Process<br />
86%<br />
Year 1991 1993<br />
Industrial Waste Residue Produced ( k ton) 2030 3090<br />
Industrial Waste Residue Used ( k ton) 1610 2650<br />
Industrial Waste Residue Stored ( k ton) 80 40<br />
Industrial Waste Residue H<strong>and</strong>led ( k ton) 390 390<br />
Industrial Waste Residue Discharged ( k ton) 80 100<br />
Industrial Waste Residue Discharged ratio (%) 3.94 3.24<br />
Total Volume of Industrial Waste Residue Accumulated (k ton) 19120 19270<br />
Areas of Industrial Residue Dumps (k sq. m) 730 390<br />
Source: Statistical Yearbook of Ch<strong>in</strong>a, 1994.<br />
from Fuel<br />
14%<br />
from<br />
Process<br />
87%<br />
from Fuel<br />
13%<br />
1991 1993<br />
Figure 6.1.4. Proportion of waste gas emissions from fuel burn<strong>in</strong>g <strong>and</strong> processes<br />
From a study conducted <strong>in</strong> 1993, <strong>the</strong> pollution emission rates for different kilns from 259 firms<br />
were determ<strong>in</strong>ed (Table 6.1.22). Accord<strong>in</strong>g to <strong>the</strong> type of kiln be<strong>in</strong>g employed, <strong>the</strong> quantity of<br />
pollutants conta<strong>in</strong>ed <strong>in</strong> <strong>the</strong> exhaust gases vary. Table 6.1.23 shows <strong>the</strong> composition of NOX <strong>in</strong><br />
exhausted gases from <strong>the</strong> different types of kilns.
Profile of <strong>the</strong> Cement Industry <strong>in</strong> Ch<strong>in</strong>a 65<br />
Table 6.1.22. Pollution Emission Rates of Cement Kilns (1993)<br />
Kiln type Pollution emission rate (kg/ton cement)<br />
Range Average<br />
NSP kiln 0.60~17.25 3.86<br />
Preheater kiln 0.39~22.45 7.82<br />
Inner hollow kiln with waste 1.02~96.81 15.00<br />
heat recovery generation<br />
Wet process kiln 1.13~18.21 10.64<br />
Libor kiln 1.06~65.4 7.52<br />
Mechanized shaft kiln 0.88~23.89 7.50<br />
Table 6.1.23. NO x content <strong>in</strong> kiln-exhaust gases<br />
Kiln type NO X content (ppm)<br />
Inner hollow kiln 700<br />
Pre-heater kiln 600-400<br />
SP kiln 150<br />
NSP kiln 100<br />
Likewise, <strong>the</strong> absorption of sulfur from <strong>the</strong> production of cement differs for <strong>the</strong> different types<br />
of kilns (Table 6.1.24). This is determ<strong>in</strong>ed by <strong>the</strong> presence of CaO <strong>and</strong> its ability to absorb SO2<br />
to form CaSO4 <strong>and</strong> CaSO3 when <strong>the</strong> temperature of <strong>the</strong> kiln reaches 800-1000 o C. From <strong>the</strong><br />
table, SP kilns, preheater <strong>and</strong> Libor kilns have higher absorption rates of sulfur than <strong>the</strong><br />
conventional kilns used <strong>in</strong> cement production.<br />
Table 6.1.24. Absorption rate of sulfur for different kilns<br />
Kiln type Sulfur absorption rate (%)<br />
SP kiln 98 - 100<br />
Preheater kiln 95 - 100<br />
Libor kiln 95 - 100<br />
Shaft kiln 80 - 95<br />
Wet process kiln 75 - 85
66 Technology, Energy Efficiency <strong>and</strong> Environmental Externalities of <strong>the</strong> Cement Industry<br />
6.1.5 Potential for <strong>energy</strong> <strong>efficiency</strong> improvement <strong>and</strong> pollution abatement through<br />
technological changes<br />
In order to estimate <strong>the</strong> potential for <strong>energy</strong> <strong>efficiency</strong> improvement <strong>and</strong> pollution abatement<br />
through technological changes, a case study was conducted on a large size plant <strong>in</strong> Ch<strong>in</strong>a. In<br />
March 1980, 2 wet process kilns with dimensions of ∅ 2.7/3.1×95m were built up with an annual<br />
cl<strong>in</strong>ker capacity of 170,000 tons. An equivalent of an annual cement capacity of 260,000 tons was<br />
generated. Expansion on <strong>the</strong> two kilns was carried out <strong>in</strong> 1983 <strong>and</strong> 1986, to enlarge <strong>the</strong><br />
dimension of kilns to ∅ 3.3/2.7/3.1×95m. This led to an additional 46,000 tons of cl<strong>in</strong>ker,<br />
equivalent to 50,000 tons of cement. Thus, 310,000 tons of cement was produced. In 1987, a 600<br />
ton/day wet process kiln (No. 3) was built, with dimensions of ∅ 3.5×145m. This produced<br />
193,000 tons of cl<strong>in</strong>ker per year, equivalent to 300,000 tons of cement. The total annual cl<strong>in</strong>ker<br />
production generated by <strong>the</strong> enterprise was 410,000 tons, equivalent to 610,000 tons of cement.<br />
In order to change <strong>the</strong> old <strong>technology</strong> <strong>and</strong> improve on <strong>energy</strong> conservation <strong>and</strong> <strong>environmental</strong><br />
protection measures, a two-step rehabilitation program has been made. This was based on <strong>the</strong><br />
rules of comprehensive plann<strong>in</strong>g <strong>and</strong> multiple-step implementation issued by <strong>the</strong> State<br />
Adm<strong>in</strong>istration of <strong>the</strong> Build<strong>in</strong>g Material Industry. The first-step rehabilitation adopted <strong>the</strong> hybrid<br />
method: <strong>the</strong> mixture of raw material slurry <strong>and</strong> raw powder after be<strong>in</strong>g dried <strong>and</strong> crushed, is fed<br />
toge<strong>the</strong>r <strong>in</strong>to a preheat<strong>in</strong>g system, for <strong>energy</strong> conservation <strong>and</strong> <strong>the</strong> balance of <strong>the</strong> ma<strong>in</strong> mach<strong>in</strong>es<br />
<strong>and</strong> equipment capacities. The <strong>energy</strong> conservation technical rehabilitation project on kilns 1 <strong>and</strong><br />
2 started <strong>in</strong> March 1993, <strong>and</strong> was f<strong>in</strong>ished <strong>in</strong> October 1994. After rehabilitation, <strong>the</strong> kiln with <strong>the</strong><br />
two-step preheater <strong>and</strong> calc<strong>in</strong>er was able to produce 1,000 tons of cl<strong>in</strong>ker per day, 300,000 tons<br />
of cl<strong>in</strong>ker per year, or an equivalent to 450,000 tons of cement.<br />
The <strong>energy</strong> conservation <strong>and</strong> environment protection technical rehabilitation project on kiln 3<br />
will beg<strong>in</strong> <strong>in</strong> 1996. One 2000 ton/day production l<strong>in</strong>e with a remarkably advanced <strong>technology</strong> for<br />
<strong>energy</strong> conservation <strong>and</strong> <strong>environmental</strong> protection is adopted for <strong>the</strong> project. The dimension of<br />
<strong>the</strong> kiln is ∅ 4×56m with a five-step preheater/ precalc<strong>in</strong>er. It will result <strong>in</strong> an addition of<br />
400,000 tons of cl<strong>in</strong>ker.<br />
After <strong>the</strong> project is commissioned, heat consumption can be reduced from 144.2 kgoe to 73.1<br />
kgoe per ton of cl<strong>in</strong>ker (a reduction of 49.2%), electricity consumption can be reduced from 108<br />
kWh to 105 kWh per ton of cement, or a reduction of 3 kWh.<br />
The dust emission can be reduced from 6.16 kg to 0.45 kg per ton of cement. NOx toxic gas<br />
emissions can be reduced from 2.01 kg to 0.875 kg per ton of cl<strong>in</strong>ker, <strong>and</strong> sulfur dioxide<br />
emissions can be reduced from 0.79 kg to 0.09 kg per ton of cl<strong>in</strong>ker.<br />
Table 6.1.25 shows <strong>the</strong> comparison between three typical technologies of cement production. It<br />
can be seen that <strong>energy</strong> conservation <strong>and</strong> pollution abatement can be realized through<br />
technological change.
Profile of <strong>the</strong> Cement Industry <strong>in</strong> Ch<strong>in</strong>a 67<br />
Table 6.1.25. Comparison of techno-economic <strong>in</strong>dicators <strong>in</strong> selected kilns<br />
Process Wet process Semi-dry process Dry process<br />
Kiln type ∅3.5×145m long<br />
kiln<br />
∅3.5×54m with<br />
two-step preheater<br />
<strong>and</strong> calc<strong>in</strong>er<br />
∅4×56m with<br />
five-step preheater<br />
<strong>and</strong> precalc<strong>in</strong>er<br />
Capacity<br />
Cl<strong>in</strong>ker production (ton/day)<br />
600<br />
1000<br />
2000<br />
Cement production (kton/year)<br />
240<br />
360<br />
716<br />
Heat consumption (kJ/kg cl<strong>in</strong>ker)<br />
6068<br />
4389<br />
3093<br />
(kgoe/ton cl<strong>in</strong>ker)<br />
145.6<br />
105<br />
73.5<br />
Electricity use (kWh/ton cement)<br />
Dust discharge (ton/year)<br />
108 109 105<br />
From raw material to kiln<br />
357.5<br />
324.7<br />
268.02<br />
From cement mill to packag<strong>in</strong>g<br />
373.5<br />
373.5<br />
74.25<br />
Total<br />
731<br />
692.8<br />
342.27<br />
Discharge per ton of cl<strong>in</strong>ker (kg)<br />
1.85<br />
1.27<br />
0.44<br />
Discharge per ton of cement (kg)<br />
Toxic gas emission<br />
3.04<br />
1.92<br />
0.48<br />
NOx (kg/day)<br />
1209.6<br />
1193.0<br />
1750<br />
(kg/ton cl<strong>in</strong>ker)<br />
2.01<br />
1.19<br />
0.875<br />
SO2 (kg/day)<br />
474.48<br />
328.56<br />
180<br />
(kg/ton cl<strong>in</strong>ker)<br />
0.79<br />
0.328<br />
0.09<br />
Update <strong>in</strong>vestment (kyuan RMB)<br />
61885<br />
132563<br />
Average <strong>in</strong>vestment per ton of cement<br />
(yuan RMB/ton cement)<br />
171.9<br />
185.1<br />
Shaft kilns <strong>in</strong> small cement plants are <strong>the</strong> ma<strong>in</strong> <strong>energy</strong> consumers <strong>in</strong> Ch<strong>in</strong>a. The average <strong>energy</strong><br />
<strong>in</strong>tensity of <strong>the</strong> cement cl<strong>in</strong>ker <strong>in</strong> mechanized shaft kilns is 115.5 kgoe/ton for <strong>the</strong> fuel <strong>and</strong> 99<br />
kWh/ton for electricity. Ano<strong>the</strong>r case study has been done to estimate <strong>the</strong> potential for <strong>energy</strong><br />
conservation of shaft kilns. Table 6.1.26 shows <strong>the</strong> results of a typical shaft kiln test<strong>in</strong>g. By us<strong>in</strong>g<br />
some effective measures such as pre-water<strong>in</strong>g, pre-homogeniz<strong>in</strong>g, <strong>and</strong> so on, <strong>energy</strong> <strong>in</strong>tensity can<br />
be reduced from 108.9 kgoe to 87.7 kgoe per ton of cl<strong>in</strong>ker.<br />
Table 6.1.27 shows a typical Libor kiln heat consumption. Besides <strong>the</strong> cl<strong>in</strong>ker reaction heat <strong>and</strong><br />
heat consumption for material water evaporation (items 1 & 2, respectively), heat expenditures<br />
occur <strong>in</strong> <strong>the</strong> waste gas fan, stovepipe, kiln surface <strong>and</strong> cooler. Through effective measures, such<br />
as <strong>the</strong> use of advanced <strong>the</strong>rmal <strong>in</strong>sulation material, seal <strong>technology</strong> for calc<strong>in</strong>e system, etc., <strong>energy</strong><br />
<strong>in</strong>tensity can be reduced from 138.70 kgoe to 113.74 kgoe per ton of cl<strong>in</strong>ker.<br />
From <strong>the</strong> forego<strong>in</strong>g discussion, it is evident that <strong>the</strong> <strong>energy</strong>-sav<strong>in</strong>gs potential of Ch<strong>in</strong>a’s cement<br />
<strong>in</strong>dustry is quite considerable. The pr<strong>in</strong>cipal measures to consider are presented <strong>in</strong> Table 6.1.28<br />
<strong>and</strong> as follows:
68 Technology, Energy Efficiency <strong>and</strong> Environmental Externalities of <strong>the</strong> Cement Industry<br />
Table 6.1.26. Heat expenditures of shaft kiln<br />
Expenditure item Heat expenditure<br />
(kgoe/ton cl<strong>in</strong>ker)<br />
As percent of total (%)<br />
1. Cl<strong>in</strong>ker reaction heat 36.74 33.74<br />
2. Heat consumption for material water evaporation 16.92 15.54<br />
3. Heat carried off by cl<strong>in</strong>ker cooler 3.48 3.2<br />
4. Heat carried off by waste gas fan 12.18 11.18<br />
5. Heat lost from stovepipe 2.22 2.04<br />
6. Heat carried off by <strong>in</strong>complete burn<strong>in</strong>g 29.34 26.95<br />
7. Heat lost from surface of kiln 6.03 5.54<br />
8. Heat carried off by cool<strong>in</strong>g water 1.03 0.95<br />
9. O<strong>the</strong>rs 0.94 0.86<br />
Total 108.90 100<br />
Table 6.1.27. Heat expenditures of libor kiln<br />
Expenditure item Heat expenditure As percent of total<br />
(kgoe/ton cl<strong>in</strong>ker)<br />
(%)<br />
1. Cl<strong>in</strong>ker reaction heat 37.75 27.2<br />
2. Heat consumption for material water evaporation 13.27 9.6<br />
3. Heat carried off by cl<strong>in</strong>ker cooler 3.27 2.4<br />
4. Heat carried off by waste gas fan 30.21 21.8<br />
5. Heat lost from stovepipe 15.21 11.0<br />
6. Heat carried off by CO emission 0.36 0.2<br />
7. Heat lost from surface of kiln 15.38 11.1<br />
8. Heat carried off by waste gas cooler 19.21 13.8<br />
9. Heat carried off by fry ash 0.33 0.2<br />
10. Heat consumption for fry ash water<br />
evaporation <strong>and</strong> decomposition<br />
2.06 1.5<br />
11. Heat carried off by cool water 1.14 0.8<br />
12. O<strong>the</strong>rs 0.59 0.4<br />
Total 138.70 100<br />
Table 6.1.28. Technical <strong>and</strong> economic analysis of <strong>in</strong>tegrated <strong>energy</strong>-sav<strong>in</strong>g measures for<br />
Ch<strong>in</strong>a’s cement <strong>in</strong>dustry<br />
Item Potential of<br />
<strong>energy</strong> sav<strong>in</strong>g<br />
(k toe)<br />
Comprehensive <strong>in</strong>novation of mechanized<br />
shaft kilns<br />
Unit <strong>in</strong>vestment <strong>in</strong><br />
<strong>energy</strong> sav<strong>in</strong>g<br />
(yuan/toe)<br />
3577 551<br />
Substitut<strong>in</strong>g dry process for wet process 623 843<br />
Substitut<strong>in</strong>g wet gr<strong>in</strong>d <strong>and</strong> dry roast for wet<br />
process<br />
441 871
Profile of <strong>the</strong> Cement Industry <strong>in</strong> Ch<strong>in</strong>a 69<br />
Integrated <strong>in</strong>novation of wet process kilns 182 593<br />
Renewal of <strong>in</strong>ner hollow kilns 1855.7 1684<br />
Innovation of kilns with vertical shaped<br />
preheater<br />
70 910<br />
Innovation of labor kilns 98 1454<br />
Innovation of gr<strong>in</strong>d mach<strong>in</strong>es 1620 1232<br />
Total<br />
Source: Cheng M<strong>in</strong>g , 1993<br />
11400<br />
(1) Comprehensive <strong>energy</strong>-conserv<strong>in</strong>g <strong>in</strong>novation on mechanized shaft kiln<br />
Us<strong>in</strong>g a comb<strong>in</strong>ation of measures such as pre-water<strong>in</strong>g, raw material mix<strong>in</strong>g, pre-homogeniz<strong>in</strong>g,<br />
<strong>and</strong> <strong>in</strong>tegrated kiln reconstruction, can reduce <strong>energy</strong> <strong>in</strong>tensity by 25%.<br />
(2) Substitut<strong>in</strong>g <strong>the</strong> wet process with <strong>the</strong> dry process<br />
Substitut<strong>in</strong>g <strong>the</strong> wet process with <strong>the</strong> dry process can considerably improve <strong>energy</strong> <strong>efficiency</strong> by<br />
reduc<strong>in</strong>g <strong>the</strong> cement cl<strong>in</strong>ker <strong>energy</strong> <strong>in</strong>tensity by about 50%.<br />
(3) Substitut<strong>in</strong>g <strong>the</strong> wet process with wet gr<strong>in</strong>d<strong>in</strong>g <strong>and</strong> dry burn<strong>in</strong>g<br />
Based on <strong>the</strong> wet process, add<strong>in</strong>g mechanical dewater<strong>in</strong>g equipment can reduce <strong>the</strong> water content<br />
<strong>in</strong> raw material, thus reduc<strong>in</strong>g <strong>the</strong> <strong>energy</strong> consumption <strong>and</strong> <strong>in</strong>creas<strong>in</strong>g output. Accord<strong>in</strong>g to <strong>the</strong><br />
data from demonstration projects, <strong>energy</strong> <strong>in</strong>tensity can be decreased by 40%, <strong>and</strong> cement output<br />
<strong>in</strong>creased by 30%.<br />
(4) Integrated renewal of <strong>the</strong> wet process kiln<br />
The cement plants which have to use <strong>the</strong> wet process can still save about 20% of <strong>the</strong>ir <strong>energy</strong><br />
consumption by us<strong>in</strong>g various <strong>energy</strong>-sav<strong>in</strong>g measures <strong>and</strong> <strong>in</strong>tegrated renewal of <strong>the</strong> wet process<br />
kiln.<br />
(5) Renewal of <strong>in</strong>ner hollow kiln<br />
The <strong>in</strong>ner hollow kiln is a small-scale, highly <strong>energy</strong>-<strong>in</strong>tensive rotary kiln that needs to be ei<strong>the</strong>r<br />
upgraded or rejected. There are various types of small-scale rotary kilns <strong>in</strong> Ch<strong>in</strong>a, total<strong>in</strong>g about<br />
400 units. Their renovation can save <strong>energy</strong> <strong>and</strong> <strong>in</strong>crease cement output. Tak<strong>in</strong>g a plant as an<br />
example of renovation, <strong>the</strong> average cl<strong>in</strong>ker output per hour for one kiln before renewal was 4.5<br />
tons, <strong>and</strong> <strong>energy</strong> <strong>in</strong>tensity was 286 kgce/ton. After renewal, <strong>the</strong> output per hour became 12.5<br />
tons <strong>and</strong> <strong>the</strong> <strong>energy</strong> <strong>in</strong>tensity of cl<strong>in</strong>ker was 136 kgce/ton.<br />
6.1.6 Status of application of new technologies for <strong>energy</strong> <strong>efficiency</strong> improvement <strong>and</strong><br />
pollution abatement<br />
From <strong>the</strong> po<strong>in</strong>t of view of <strong>energy</strong> <strong>efficiency</strong> improvement <strong>and</strong> pollution abatement, <strong>the</strong> dry<br />
process is <strong>the</strong> best to adopt <strong>in</strong> cement manufactur<strong>in</strong>g. Because of limited capital, however, it is
70 Technology, Energy Efficiency <strong>and</strong> Environmental Externalities of <strong>the</strong> Cement Industry<br />
impossible to substitute wet kilns <strong>and</strong> shaft kilns by <strong>the</strong> NSP kilns, though <strong>the</strong> use of <strong>the</strong> shaft<br />
kiln process <strong>and</strong> new dry process is expected to <strong>in</strong>crease fur<strong>the</strong>r <strong>in</strong> <strong>the</strong> future.<br />
The situation of hav<strong>in</strong>g various types of kilns <strong>in</strong> operation throughout Ch<strong>in</strong>a’s cement <strong>in</strong>dustry<br />
poses a problem for <strong>energy</strong> <strong>efficiency</strong> improvement. Different kilns adopt different technologies,<br />
<strong>and</strong> thus add to <strong>the</strong> complexity of <strong>energy</strong> studies <strong>and</strong> <strong>energy</strong> <strong>efficiency</strong> programs to be<br />
implemented. An example is as follows: <strong>the</strong>re were 84 wet kilns <strong>in</strong> large <strong>and</strong> medium size cement<br />
plants <strong>in</strong> 1994. Most of <strong>the</strong>se plants were not <strong>in</strong> <strong>the</strong> right condition to retrofit to NSP kilns. Only<br />
those kilns with ∅3.5×145 m long can be substituted by <strong>the</strong> dry process. The o<strong>the</strong>r k<strong>in</strong>ds of wet<br />
kilns can only adopt wet gr<strong>in</strong>d<strong>in</strong>g, dry roast <strong>technology</strong> <strong>and</strong> o<strong>the</strong>r specific <strong>energy</strong> conservation<br />
technologies.<br />
Table 6.1.29 shows <strong>the</strong> status of <strong>the</strong> application of new technologies for <strong>energy</strong> <strong>efficiency</strong><br />
improvement <strong>in</strong> large <strong>and</strong> medium size cement plants. It can be seen that tremendous efforts<br />
must be made <strong>in</strong> technological <strong>in</strong>novations.<br />
Table 6.1.29. Status of application of new <strong>technology</strong> for <strong>energy</strong> <strong>efficiency</strong> improvement<br />
<strong>in</strong> <strong>the</strong> cement <strong>in</strong>dustry <strong>in</strong> 1993 (for large <strong>and</strong> medium size plants)<br />
Kiln type Number % to total number of<br />
kilns<br />
Wet process kiln:<br />
84<br />
54.1<br />
∅3.5×145 m<br />
Capacity < 20 ton/hour<br />
20< Capacity30<br />
Dry process kiln<br />
NSP kiln<br />
Capacity
Profile of <strong>the</strong> Cement Industry <strong>in</strong> Ch<strong>in</strong>a 71<br />
total number of firms. This shows that pollution from <strong>the</strong> cement <strong>in</strong>dustry is a serious problem<br />
due to <strong>the</strong> serious impact on <strong>the</strong> environment.<br />
6.1.7 Conclusions<br />
From <strong>the</strong> above discussion, some ma<strong>in</strong> conclusions can be briefly summarized as follows:<br />
- Ch<strong>in</strong>a is <strong>the</strong> biggest cement-produc<strong>in</strong>g country <strong>in</strong> <strong>the</strong> world, while <strong>the</strong> cement<br />
<strong>in</strong>dustry holds an important position <strong>in</strong> <strong>the</strong> national economy.<br />
- The cement <strong>in</strong>dustry is a highly <strong>energy</strong>-<strong>in</strong>tensive <strong>and</strong> pollut<strong>in</strong>g <strong>in</strong>dustry.<br />
- The <strong>energy</strong> <strong>in</strong>tensity of cement manufactur<strong>in</strong>g <strong>in</strong> Ch<strong>in</strong>a is 1.78 times higher as that of<br />
Japan, <strong>and</strong> 1.96 higher than Germany. The <strong>energy</strong>-sav<strong>in</strong>gs potential of Ch<strong>in</strong>a’s cement<br />
<strong>in</strong>dustry is quite considerable.<br />
- The <strong>in</strong>dustry is characterized by outdated technologies both <strong>in</strong> <strong>the</strong> production process<br />
<strong>and</strong> equipment. New technologies have large market potentials <strong>in</strong> Ch<strong>in</strong>a.
72 Technology, Energy Efficiency <strong>and</strong> Environmental Externalities of <strong>the</strong> Cement Industry<br />
New <strong>technology</strong><br />
Wet process:<br />
1. Substitut<strong>in</strong>g dry process for wet process<br />
Table 6.1.30. Energy sav<strong>in</strong>g measures for different cement production processes<br />
Kiln type<br />
∅3.5×145<br />
m wet long<br />
kiln<br />
Kiln<br />
number<br />
34<br />
Capacity<br />
before<br />
retrofit<br />
(k ton<br />
cl<strong>in</strong>ker/<br />
year)<br />
Capacity<br />
<strong>in</strong>crease<br />
after retrofit<br />
(kton<br />
cl<strong>in</strong>ker/<br />
year)<br />
Heat<br />
<strong>in</strong>tensity<br />
before<br />
retrofit<br />
(kgoe/ton<br />
cl<strong>in</strong>ker)<br />
Heat<br />
<strong>in</strong>tensity<br />
after<br />
retrofit<br />
(kgoe/ton<br />
cl<strong>in</strong>ker)<br />
7000 5600 146.3 82.6 623<br />
2. Integrated <strong>in</strong>novation of wet process<br />
small 8000 280 147 119 182<br />
kilns<br />
plants<br />
3. Substitut<strong>in</strong>g wet gr<strong>in</strong>d <strong>and</strong> dry roast<br />
small 8000 3360 149.8 100.1 441<br />
for wet process<br />
Semi-dry process:<br />
plants<br />
1. Innovation of Libor kilns<br />
Dry process:<br />
Libor kiln small<br />
plants<br />
5200 830 112 91 98<br />
1. Renewal of <strong>in</strong>ner hollow kilns Inner 287 8400 14200 199.5 94.5 1855<br />
hollow kiln (small<br />
plants<br />
<strong>in</strong>cl.)<br />
2. Innovation shaft-preheater kiln Shaft small 4000 2200 124.6 101.5 70<br />
Mechanized shaft kilns:<br />
preheater<br />
kiln<br />
plants<br />
1. Prewater<strong>in</strong>g, raw material. mix<strong>in</strong>g,<br />
prehomogeniz<strong>in</strong>g, <strong>in</strong>tegrated kiln<br />
reconstruction, etc.<br />
Shaft kilns 4000 126000 37800 115.5 87.5 3577<br />
Potential<br />
of <strong>energy</strong><br />
sav<strong>in</strong>gs<br />
(k toe)
Profile of <strong>the</strong> Cement Industry <strong>in</strong> India 73<br />
6.2 COUNTRY REPORT: INDIA<br />
6.2.1 Introduction<br />
The Indian cement <strong>in</strong>dustry is a highly <strong>energy</strong>-<strong>in</strong>tensive <strong>and</strong> pollut<strong>in</strong>g <strong>in</strong>dustry, whose<br />
production at present <strong>in</strong>cludes 13 varieties of cement, three of which comprise more than 95%<br />
of <strong>the</strong> total production. Currently, <strong>the</strong> country exports cement to its neighbor<strong>in</strong>g countries, <strong>and</strong><br />
it has <strong>the</strong> advantage of be<strong>in</strong>g <strong>the</strong> resource base for <strong>the</strong> cement-import<strong>in</strong>g countries <strong>in</strong> <strong>the</strong> region.<br />
The <strong>in</strong>dustry, however, has not yet kept pace with <strong>the</strong> advances <strong>in</strong> science <strong>and</strong> <strong>technology</strong> tak<strong>in</strong>g<br />
place <strong>in</strong> <strong>the</strong> world. It is saddled with old plants <strong>and</strong> mach<strong>in</strong>ery designed dur<strong>in</strong>g those periods of<br />
cheap <strong>energy</strong>, <strong>and</strong> while <strong>the</strong> growth of <strong>energy</strong> conservation efforts has ga<strong>in</strong>ed momentum <strong>in</strong> <strong>the</strong><br />
developed countries, efforts <strong>in</strong> India are still at its <strong>in</strong>fancy stage with more focus on<br />
housekeep<strong>in</strong>g measures.<br />
The upheavals <strong>in</strong> <strong>the</strong> world <strong>energy</strong> market <strong>in</strong> <strong>the</strong> 1970s <strong>and</strong> <strong>the</strong> country’s gradual decontrol of<br />
cement <strong>in</strong> <strong>the</strong> 1980s, however, have spurred some <strong>technology</strong> improvements <strong>in</strong> <strong>the</strong> <strong>in</strong>dustry.<br />
While <strong>the</strong> <strong>in</strong>dustry is sett<strong>in</strong>g itself to meet <strong>the</strong> <strong>in</strong>creas<strong>in</strong>g dem<strong>and</strong>s for construction materials, it<br />
has also responded to <strong>the</strong> global calls for <strong>environmental</strong> protection <strong>and</strong> consciousness through<br />
<strong>the</strong> adoption of clean technologies at <strong>the</strong> plant level. Various constra<strong>in</strong>ts exist, however, <strong>and</strong><br />
aga<strong>in</strong>, India’s cement <strong>in</strong>dustry is characterized as <strong>in</strong>fant <strong>in</strong> terms of <strong>the</strong> adoption of<br />
environment-friendly <strong>and</strong> clean technologies.<br />
This section aims to assess <strong>the</strong> status of technologies <strong>in</strong> <strong>the</strong> <strong>energy</strong>-<strong>in</strong>tensive <strong>and</strong> pollut<strong>in</strong>g<br />
cement <strong>in</strong>dustry by present<strong>in</strong>g <strong>the</strong> exist<strong>in</strong>g technological <strong>and</strong> <strong>environmental</strong> conditions <strong>in</strong> <strong>the</strong><br />
<strong>in</strong>dustry. The latter part identifies <strong>the</strong> potential areas of <strong>energy</strong> conservation <strong>and</strong> pollution<br />
reduction <strong>in</strong> <strong>the</strong> <strong>in</strong>dustry with use of <strong>energy</strong>-efficient <strong>and</strong> <strong>environmental</strong>ly sound technologies.<br />
6.2.2 Technological trajectory of India’s cement <strong>in</strong>dustry<br />
6.2.2.1 Current scenario<br />
At present, <strong>the</strong> Indian cement <strong>in</strong>dustry produces thirteen varieties of cement, three of which<br />
comprise more than 95% of <strong>the</strong> total production. These are ord<strong>in</strong>ary Portl<strong>and</strong> cement, Portl<strong>and</strong><br />
pozzolana cement <strong>and</strong> Portl<strong>and</strong> slag cement. This total production is derived from cement<br />
plants whose number has been grow<strong>in</strong>g over all <strong>the</strong>se years (Figure 6.2.1). As a high-value added<br />
<strong>in</strong>dustry, it’s growth rate <strong>and</strong> contribution to <strong>the</strong> Indian economy is quite significant. It is<br />
estimated that <strong>the</strong> newer cement plants that compare well to world st<strong>and</strong>ards <strong>in</strong> terms of<br />
productivity <strong>and</strong> production costs, would be able to export about 5 million tons (Mt) per annum<br />
by 1996-1997. Table 6.2.1 summarizes <strong>the</strong> performance of <strong>the</strong> cement <strong>in</strong>dustry from 1973 to<br />
1989.<br />
The <strong>technology</strong> for cement manufacture <strong>in</strong> <strong>the</strong> country has changed substantially dur<strong>in</strong>g <strong>the</strong> past<br />
three to four decades. While plants based on <strong>the</strong> wet process were established <strong>in</strong> <strong>the</strong> 1950s <strong>and</strong><br />
early 1960, those us<strong>in</strong>g <strong>the</strong> dry process have been set up <strong>the</strong>reafter. Dry process cement plants,<br />
which are less <strong>energy</strong>- <strong>in</strong>tensive, now account for over 90% of <strong>in</strong>stalled capacity. Precalc<strong>in</strong>ator<br />
<strong>technology</strong> has also been <strong>in</strong>troduced <strong>in</strong> India, result<strong>in</strong>g <strong>in</strong> a significant decrease <strong>in</strong> <strong>the</strong> specific<br />
<strong>energy</strong> consumption. Three <strong>in</strong>dicators (value added - VA, <strong>the</strong>rmal, <strong>and</strong> power) for <strong>the</strong> cement<br />
<strong>in</strong>dustry are shown <strong>in</strong> Table 6.2.2.
74 Technology, Energy Efficiency <strong>and</strong> Environmental Externalities of <strong>the</strong> Cement Industry<br />
No. of Plants<br />
600<br />
500<br />
400<br />
300<br />
200<br />
100<br />
0<br />
126<br />
232<br />
328<br />
558<br />
1973-74 1978-79 1983-84 1988-89<br />
Figure 6.2.1. Growth <strong>in</strong> India’s cement factories<br />
Table 6.2.1. Performance characteristics of <strong>the</strong> cement <strong>in</strong>dustry <strong>in</strong> India<br />
All values <strong>in</strong> million 1973-1974 1978-1979 1983-1984 1988-1989<br />
Number of factories 126 232 328 558<br />
Fixed capital (Rs) 14 366 22 802 103 999 339 587<br />
Fuels consumed (Rs) 5 358 12 921 39 125 112 485<br />
Value of output (Rs) 21 361 46 318 150 676 331 885<br />
Depreciation (Rs) 1 394 1 994 9 875 30 769<br />
Net value added (Rs) 3 296 9 639 40 952 35 811<br />
All values <strong>in</strong><br />
million<br />
Real growth rate % Share <strong>in</strong> <strong>the</strong><br />
manufactur<strong>in</strong>g<br />
economy<br />
1973-1979 1979-1984 1984-1989 1983-1984 1988-1989<br />
Number of factories 12.99 7.17 11.21 0.26 0.83<br />
Fixed capital (Rs) 0.19 24.83 19.64 0.99 3.81<br />
Fuels consumed (Rs) 7.61 11.23 20.31 4.70 7.93<br />
Value of output (Rs) 5.1 13.04 13.9 1.04 1.8<br />
Depreciation (Rs) 1.35 4.31<br />
Net value added (Rs) 11.78 20.54 2.4 0.98 1.55<br />
Table 6.2.2. Indicators for <strong>the</strong> cement sub-sector<br />
Year VA (Cement Indicator) Coal Indicator Electricity Indicator<br />
1985-1986 100 100 100<br />
1986-1987 100 101.31 96.95<br />
1987-1988 98.56 92.79 90.91<br />
1988-1989 132.43 89.32 87.50<br />
1989-1990 121.13 79.96 78.33<br />
1990-1991 123.20 83.63 81.93<br />
1991-1992 NA 84.27 82.56<br />
Electric power <strong>and</strong> coal are <strong>the</strong> major <strong>energy</strong> forms used <strong>in</strong> <strong>the</strong> cement <strong>in</strong>dustry, although some<br />
plants use furnace oil <strong>and</strong> lignite as well. The cement <strong>in</strong>dustry accounts for over 10% of <strong>the</strong><br />
<strong>in</strong>dustrial sector's coal consumption, <strong>and</strong> over 6% of <strong>the</strong> sector's electricity consumption.<br />
Although <strong>the</strong> overall <strong>energy</strong> <strong>in</strong>tensity of <strong>the</strong> cement <strong>in</strong>dustry has decl<strong>in</strong>ed dur<strong>in</strong>g <strong>the</strong> past decade<br />
or more (due largely to an <strong>in</strong>creas<strong>in</strong>g share of production from dry process-based cement<br />
plants), <strong>energy</strong> consumption norms <strong>in</strong> India are significantly higher than <strong>in</strong>ternational ones.<br />
Table 6.2.3 gives <strong>the</strong> specific <strong>energy</strong> consumption for cement <strong>and</strong> <strong>the</strong> value added for nonmetallic<br />
m<strong>in</strong>eral production of which cement comprises 60-65%.
Profile of <strong>the</strong> Cement Industry <strong>in</strong> India 75<br />
Table 6.2.3. Value added <strong>and</strong> specific <strong>energy</strong> consumption for cement <strong>in</strong> India<br />
Value-added for non- Specific Energy Consumption<br />
Year metallic m<strong>in</strong>eral<br />
products<br />
(Rs Million 1980/81<br />
price)<br />
Coal (kgoe/ton)<br />
Electricity<br />
(kWh/ton)<br />
1970-71 20 74.1 NA NA<br />
1980-1981 4 740 NA NA<br />
1985-1986 9 700 100 104.75<br />
1986-1987 9 220 102 101.56<br />
1987-1988 10 580 93 95.23<br />
1988-1989 11 420 90 92.66<br />
1989-1990 11 750 80 82.06<br />
1990-1991 11 950 84 85.82<br />
1991-1992 NA 84 86.48<br />
Cement production dur<strong>in</strong>g 1990-91 at 48.86 Mt was 6.7% higher than <strong>the</strong> production of 45.79<br />
Mt <strong>in</strong> <strong>the</strong> previous year (Table 6.2.4). The <strong>in</strong>crease <strong>in</strong> production is entirely due to large scale<br />
plants <strong>in</strong> <strong>the</strong> private sector while production by public sector cement plants decl<strong>in</strong>ed to a share<br />
of 6.2%.<br />
Table 6.2.4. Cement production <strong>and</strong> <strong>energy</strong> consumption<br />
Energy consumption <strong>in</strong> cement production<br />
Year Million tons Electricity (GWh) Coal (‘000 tons) Fuel Oil (‘000 tons)<br />
1970-71 14.3 NA NA NA<br />
1980-1981 18.7 NA NA NA<br />
1985-1986 33.1 3467.3 7900 54<br />
1986-1987 36.6 3717 8850 NA<br />
1987-1988 39.6 3717 8850 NA<br />
1988-1989 44.8 4106.5 9550 NA<br />
1989-1990 45.5 3758.2 8740 NA<br />
1990-1991 48.9 4188.2 9740 NA<br />
1991-1992 53.61 4644 10800 NA<br />
Note: Figures of coal consumption are from <strong>the</strong> Department of Coal, India. Electricity<br />
consumption is based on four time series data for which both <strong>the</strong> electricity <strong>and</strong> coal<br />
consumption were available. Electricity consumption varied from 0.4 to 0.43 GWh<br />
per ton of coal consumed. The estimates are for <strong>the</strong> years 1988-89 to 1990-91.<br />
6.2.2.2 Structure of <strong>the</strong> cement <strong>in</strong>dustry<br />
Trends <strong>in</strong> cement production<br />
India's cement production <strong>in</strong>creased from 3.29 million tons <strong>in</strong> 1951-52 to 57.96 million tons <strong>in</strong><br />
1993-94 (Table 6.2.5). The highest compound growth rate per annum was recorded dur<strong>in</strong>g <strong>the</strong><br />
late fifties when output <strong>in</strong>creased at an annual average rate of 11.6%.<br />
Dur<strong>in</strong>g <strong>the</strong> early seventies, <strong>the</strong> average annual growth rate slowed down, reach<strong>in</strong>g an all time low<br />
of 3.7%. This downward trend was halted <strong>and</strong> reversed <strong>in</strong> <strong>the</strong> late seventies (1974-80) when <strong>the</strong><br />
average production <strong>in</strong>creased at <strong>the</strong> rate of 7.2 % per annum. Good progress was made <strong>in</strong> <strong>the</strong><br />
early eighties; <strong>in</strong> real terms, this implied that output <strong>in</strong>creased from 18.7 million tons <strong>in</strong> 1980 to
76 Technology, Energy Efficiency <strong>and</strong> Environmental Externalities of <strong>the</strong> Cement Industry<br />
30 million tons <strong>in</strong> 1985. This upward trend cont<strong>in</strong>ued <strong>and</strong> production reached 45 Mt by 1989-<br />
90.<br />
In essence, <strong>the</strong> decade of <strong>the</strong> seventies witnessed a slow<strong>in</strong>g down <strong>in</strong> production. This adverse<br />
trend was halted <strong>and</strong> reversed dur<strong>in</strong>g <strong>the</strong> eighties. The performance <strong>in</strong> 1991-92 was <strong>in</strong>deed<br />
remarkable; production <strong>in</strong>creased by almost 4.5 million tons over <strong>the</strong> previous year’s record of<br />
49 million tons.<br />
Trends <strong>in</strong> capacity<br />
The cement <strong>in</strong>dustry witnessed an <strong>in</strong>crease <strong>in</strong> production at an average rate of 11.6% per annum<br />
<strong>in</strong> <strong>the</strong> late fifties. Production <strong>in</strong>creased from 4.8 million tons <strong>in</strong> 1955-56 to 7.97 million tons <strong>in</strong><br />
1960-61. The follow<strong>in</strong>g year, a target for additional <strong>in</strong>stalled capacity was 16 million tons, though<br />
<strong>the</strong> achieved production was only 9.3 million tons, or just 58% of <strong>the</strong> planned production. The<br />
production performance was comparatively better dur<strong>in</strong>g <strong>the</strong> subsequent years. In 1984-85,<br />
aga<strong>in</strong>st a target of 34.5 million tons, a production of 30.1 million tons was achieved. In 1989-90,<br />
achievement was 45.41 million tons which exceeded <strong>the</strong> target of 45.0 million tons. Thereafter,<br />
achievements have been <strong>in</strong> excess of 95% of <strong>the</strong> target.<br />
Table 6.2.5. Cement <strong>in</strong>dustry trends <strong>in</strong> capacity, production, <strong>and</strong> capacity utilization<br />
(Mt) (<strong>in</strong>clusive of m<strong>in</strong>i-cement plants)<br />
Year Installed Capacity Actual Production Capacity Utilization (%)<br />
1950-1951 3.75 3.29 88<br />
1960-1961 9.30 7.97 86<br />
1968-1969 14.98 12.24 82<br />
1980-1981 26.99 18.56 67<br />
1990-1991 64.36 48.90 76<br />
1991-1992 66.59 53.61 81<br />
1992-1993 70.19 54.08 77<br />
1993-1994 76.88 57.96 76<br />
Source : Basic Data for Cement Industry (May 1995): Cement Manufacturers'<br />
Association<br />
The relation between <strong>in</strong>stalled capacity <strong>and</strong> production has shown an almost cont<strong>in</strong>uous<br />
downward trend. Dur<strong>in</strong>g <strong>the</strong> <strong>in</strong>itial years, capacity utilization fluctuated between 88% <strong>and</strong> 96%.<br />
However, from 1956 onwards, capacity utilization decl<strong>in</strong>ed, reach<strong>in</strong>g an all time low of 67% <strong>in</strong><br />
<strong>the</strong> years 1980-81 <strong>and</strong> 1986-87. Dur<strong>in</strong>g <strong>the</strong> 60's, capacity utilization fluctuated between 83%-<br />
90%, between 73-80% <strong>in</strong> <strong>the</strong> 1980's <strong>and</strong> f<strong>in</strong>ally, between 67% <strong>and</strong> 75% for <strong>the</strong> period of 1980-<br />
90. The share of <strong>the</strong> public sector <strong>in</strong> India’s cement production is shown <strong>in</strong> Table 6.2.6.<br />
Table 6.2.6. Distribution of capacity <strong>and</strong> production by ownership<br />
1977 1983 1991 1992<br />
C P C P C P C P<br />
Share of Public Sector (%) 11.46 9.92 17.40 16.10 15.50 10.20 14.70 10.40<br />
Share of Private Sector (%) 88.54 90.08 82.60 83.90 84.50 89.80 85.30 89.60<br />
Total (Mt) 21.67 19.17 36.2 25.70 61.31 50.60 64.84 50.70<br />
Source: Indian Cement Industry Statistics (relevant years). C: capacity <strong>and</strong> P: Production<br />
In 1977, out of a total production of 19.17 million tons, <strong>the</strong> public sector accounted for<br />
approximately 10%, <strong>the</strong> rest be<strong>in</strong>g produced by <strong>the</strong> private sector. The contribution of small<br />
units <strong>in</strong> <strong>the</strong> private sector cont<strong>in</strong>ues to rema<strong>in</strong> marg<strong>in</strong>al. Between 1970 <strong>and</strong> 1991, production
Profile of <strong>the</strong> Cement Industry <strong>in</strong> India 77<br />
from <strong>the</strong> private sector <strong>in</strong>creased by almost four times from 14 million tons to 65 million tons;<br />
simultaneously, <strong>the</strong> public sector contribution <strong>in</strong>creased from 6% to 10%. This largely reflects<br />
<strong>the</strong> expansion of <strong>the</strong> Central Government-owned Cement Corporation of India.<br />
Trends <strong>in</strong> Energy Intensity<br />
The trend <strong>in</strong> average specific <strong>the</strong>rmal <strong>and</strong> electrical <strong>energy</strong> consumption <strong>in</strong> Indian cement plants<br />
over <strong>the</strong> period is given <strong>in</strong> Table 6.2.7.<br />
Table 6.2.7. Trends <strong>in</strong> Specific Energy Consumption <strong>in</strong> Indian Cement Plants<br />
Average specific <strong>energy</strong> consumption<br />
Year Thermal <strong>energy</strong> (kgoe/ton cl<strong>in</strong>ker) Electrical <strong>energy</strong> (kWh/ton cement)<br />
1960 166.5 122<br />
1970 158.6 132<br />
1980 139.6 133<br />
1983 126.1 139<br />
1985 121.0 131<br />
1986 112.0 128<br />
1989 101.5 128<br />
1990 97.8 124<br />
1991 96.2 120<br />
Source: BICP Reports on Energy Audits<br />
The <strong>in</strong>dustry has exhibited considerable reduction <strong>in</strong> specific <strong>the</strong>rmal <strong>energy</strong> consumption over<br />
<strong>the</strong> last three decades be<strong>in</strong>g at 166.5 kgoe/tonne of cl<strong>in</strong>ker <strong>in</strong> 1960 to 96.5 kcal/tonne <strong>in</strong> <strong>the</strong><br />
year 1991. This has been ma<strong>in</strong>ly attributed to <strong>the</strong> <strong>in</strong>creas<strong>in</strong>g adoption of dry process <strong>technology</strong><br />
which is more <strong>energy</strong> (<strong>the</strong>rmal) efficient.<br />
6.2.3 Evolution of <strong>energy</strong> <strong>efficiency</strong> <strong>in</strong> <strong>the</strong> Indian cement <strong>in</strong>dustry<br />
6.2.3.1 Process <strong>technology</strong> profile<br />
The Indian <strong>in</strong>dustry at present is a conglomerate of modern dry process plants <strong>and</strong> old wet<br />
process plants. The chang<strong>in</strong>g process profile of <strong>the</strong> Indian cement <strong>in</strong>dustry dur<strong>in</strong>g <strong>the</strong> last<br />
decades is given <strong>in</strong> Table 6.2.8.<br />
Table 6.2.8. Process profile of <strong>the</strong> Indian cement <strong>in</strong>dustry (% annual capacity)<br />
Process 1960 1970 1980 1992-1993<br />
Dry 1.1 21.5 32.7 82.00<br />
Semi-dry 4.5 9.0 5.7 2.00<br />
Wet 94.4 69.5 61.6 16.00<br />
It is observed from Table 6.2.8 that <strong>in</strong> <strong>the</strong> total <strong>in</strong>stalled capacity of cement <strong>in</strong>dustry, <strong>the</strong> share of<br />
wet process plants has decreased over <strong>the</strong> past three decades, from 94.4% <strong>in</strong> 1960 to 16% <strong>in</strong><br />
1992-93. The share of dry process plants <strong>in</strong>creased from a mere 1.1% <strong>in</strong> 1960 to 82.0% <strong>in</strong> 1992-<br />
93. This is <strong>in</strong> l<strong>in</strong>e with <strong>the</strong> <strong>in</strong>ternational trend to set up new dry process units or convert wet<br />
process to <strong>the</strong> more <strong>energy</strong> efficient dry process.<br />
From 1992-93, 51 cement companies <strong>in</strong> <strong>the</strong> country consisted of 99 cement plants, with a total<br />
of 176 cement kilns, 89 of which were based on <strong>the</strong> wet process, 84 based on <strong>the</strong> dry process,<br />
<strong>and</strong> 3 on <strong>the</strong> semi-dry process. The v<strong>in</strong>tage profile of kilns with respect to 54 cement units<br />
studied is shown <strong>in</strong> Table 6.2.9.
78 Technology, Energy Efficiency <strong>and</strong> Environmental Externalities of <strong>the</strong> Cement Industry<br />
Table 6.2.9. V<strong>in</strong>tage profile of kilns for 54 sample plants (as of January 1993)<br />
Number of kilns % of kilns<br />
V<strong>in</strong>tage Dry Semi-dry Wet Dry Semi-dry Wet<br />
< 10 years 19 0 0 37 0 0<br />
10 - 25 years 31 1 7 61 11 23<br />
> 25 years 1 8 24 2 89 77<br />
Total 51 9 31 100 100 100<br />
Most of <strong>the</strong> wet <strong>and</strong> semi-dry kilns are of high v<strong>in</strong>tage. About 77% of <strong>the</strong> wet <strong>and</strong> 89% of <strong>the</strong><br />
semi-dry kilns are more than 25 years old <strong>and</strong> none is below 10 years. It is also noticed that 14<br />
kilns are more than 40 years old. In <strong>the</strong> case of dry process kilns, most of <strong>the</strong>m are less than 25<br />
years of age, 61% be<strong>in</strong>g between 10 <strong>and</strong> 25 years <strong>and</strong> 37% less than 10 years.<br />
6.2.3.2 Plant Size<br />
The size of a plant or kiln <strong>in</strong>stalled has a bear<strong>in</strong>g on <strong>the</strong> cost of production as well as on specific<br />
<strong>energy</strong> consumption. There have been <strong>in</strong>creas<strong>in</strong>g trend all over <strong>the</strong> world for adoption of higher<br />
capacities. In Table 6.2.10, a comparison of plant size profile of <strong>the</strong> Indian cement <strong>in</strong>dustry has<br />
been made with that of Japan.<br />
Table 6.2.10. Comparison of Indian cement plant sizes with that of Japan<br />
Plant size<br />
(Installed<br />
Japan (1987) India (1992)<br />
capacity)<br />
Mt per annum<br />
No. of plants % No. of plants %<br />
> 3 11 26.2 0 0<br />
2 - 3 4 9.5 0 0<br />
2 - 2.5 8 19.5 2 2.1<br />
1.5 - 2 7 16.7 7 7.2<br />
1 - 1.5 7 16.7 4 4.1<br />
0.5 - 1 4 9.5 39 40.2<br />
up to 0.5 1 2.4 45 46.4<br />
Total 42 100.0 97* 100.0<br />
* Out of 99 cement plants <strong>in</strong> <strong>the</strong> country, 2 plants produce only cl<strong>in</strong>ker<br />
Currently, <strong>the</strong> m<strong>in</strong>imum economical size for a new cement plant <strong>in</strong> India is 1 MTPA (Million<br />
tons per annum). In Japan, 88% of <strong>the</strong> plants are above 1 MTPA <strong>and</strong> more than 50% of <strong>the</strong>se<br />
are above 2 MTPA. Correspond<strong>in</strong>gly, <strong>in</strong> Indian cement <strong>in</strong>dustry, 13.4% plants are above 1<br />
MTPA <strong>and</strong> only 2 plants produce more than 20 MTPA. 84 out of <strong>the</strong> total 97 plants, i.e., 86.6%<br />
of <strong>the</strong> plants <strong>in</strong> <strong>the</strong> <strong>in</strong>dustry are below 1 MTPA capacity.<br />
The <strong>in</strong>stalled capacities of kilns have also varied widely <strong>in</strong> India. Among <strong>the</strong> 54 sample plants for<br />
<strong>the</strong> study, <strong>the</strong> kiln capacity has ranged from as low as 120 tons per day (TPD) to a maximum of<br />
4500 TPD. The size of <strong>the</strong> Indian plants to be considered economical <strong>in</strong> early 1950's was about<br />
300 TPD. This was st<strong>and</strong>ardized at 600 TPD <strong>in</strong> <strong>the</strong> mid 1960's <strong>and</strong> a decade later, <strong>the</strong> new<br />
plants to be established were st<strong>and</strong>ardized at 1200 TPD. The last decade, however, has shown a<br />
trend towards higher capacity kilns. The capacity of <strong>the</strong> kilns set up dur<strong>in</strong>g <strong>the</strong> years 1981 to<br />
1990 have ranged between 1200 TPD <strong>and</strong> 3850 TPD. In 1991, <strong>the</strong> size of kiln commissioned
Profile of <strong>the</strong> Cement Industry <strong>in</strong> India 79<br />
has gone up fur<strong>the</strong>r at 4500 TPD capacity. Table 6.2.11 below gives <strong>the</strong> trend <strong>in</strong> sett<strong>in</strong>g up of<br />
kiln sizes dur<strong>in</strong>g <strong>the</strong> period 1981 to 1991 among <strong>the</strong> 54 sample plants.<br />
Table 6.2.11. Size range <strong>and</strong> number of kilns commissioned (1981 to 1991)<br />
Capacity ranges of kilns<br />
(TPD)<br />
Kilns set-up dur<strong>in</strong>g <strong>the</strong> period<br />
No. of kilns % of kilns<br />
< 1200 - -<br />
1200 - 1500 9 34.6<br />
1500 - 2000 3 11.5<br />
2000 - 2500 2 7.7<br />
3000 <strong>and</strong> above 12 46.2<br />
Total 26 100.0<br />
It is observed from <strong>the</strong> table that about 46% of <strong>the</strong> kilns set up dur<strong>in</strong>g <strong>the</strong> period 1981 to 1991<br />
were of 3000 or above TPD <strong>in</strong>stalled capacity.<br />
6.2.3.3 Thermal Energy Consumption<br />
Process-wise specific heat consumption characteristics for <strong>in</strong>dividual plants <strong>in</strong> 1987-88 <strong>and</strong><br />
1991-92 <strong>and</strong> <strong>the</strong> correspond<strong>in</strong>g weighted average specific consumption for <strong>the</strong> sample <strong>in</strong>dustry<br />
<strong>in</strong> each of <strong>the</strong> years are shown <strong>in</strong> <strong>the</strong> Table 6.2.12.<br />
Table 6.2.12. Process-wise specific heat consumption (kgoe/ton cl<strong>in</strong>ker <strong>in</strong> 1987-1988<br />
<strong>and</strong> 1991-1992) of Indian cement plants<br />
Year Dry Semi-dry Wet All Plants<br />
Max. 124.20 95.60 160.40 160.40<br />
1987-1988 M<strong>in</strong>. 80.10 95.60 140.60 80.10<br />
Wt. Ave. 91.47 95.60 148.30 96.30<br />
Max. 105.70 95.30 161.40 161.40<br />
1988-1989 M<strong>in</strong>. 81.00 85.30 139.40 81.00<br />
Wt. Ave. 90.90 95.30 144.60 95.10<br />
Max. 111.20 96.00 174.90 174.90<br />
1989-1990 M<strong>in</strong>. 80.80 96.00 136.70 80.80<br />
Wt. Ave. 90.60 96.00 144.80 93.70<br />
Max. 109.10 96.40 151.70 151.70<br />
1990-1991 M<strong>in</strong>. 81.50 96.40 135.20 81.50<br />
Wt. Ave. 88.60 96.40 135.20 81.50<br />
Max. 96.60 91.50 158.30 158.30<br />
1991-1992 M<strong>in</strong>. 80.90 91.50 136.00 80.90<br />
Wt. Ave. 85.63 91.50 142.00 87.90<br />
No. of plants<br />
<strong>in</strong>vestigated<br />
15 1 4 20<br />
Source: Bureau of Industrial Cost & Prices (BICP) Energy Audit Study of Cement Industry<br />
In <strong>the</strong> case of <strong>the</strong> dry process, <strong>the</strong> weighted average specific heat consumption for <strong>the</strong> 15 sample<br />
units has shown an improved trend dur<strong>in</strong>g 1987-88 to 1991-92. The extent of improvement has<br />
been 6.38% <strong>in</strong> kgoe/ton cl<strong>in</strong>ker. The m<strong>in</strong>imum specific heat consumption <strong>in</strong> each of <strong>the</strong> years<br />
has been more or less at <strong>the</strong> same level (between 80.1 to 81.5 kgoe/ton) whereas <strong>the</strong> maximum
80 Technology, Energy Efficiency <strong>and</strong> Environmental Externalities of <strong>the</strong> Cement Industry<br />
level have come down by 22.2% dur<strong>in</strong>g <strong>the</strong> same period (124.2 kgoe/ton <strong>in</strong> 1987-88 <strong>and</strong> 96.6<br />
kgoe/ton <strong>in</strong> 1991-92). The difference between maximum-m<strong>in</strong>imum annual figures has<br />
narrowed down significantly from 55% <strong>in</strong> 1987-88 to 19.5% <strong>in</strong> 1991-92, <strong>in</strong>dicat<strong>in</strong>g that many of<br />
<strong>the</strong> units have improved <strong>efficiency</strong> <strong>in</strong> this area.<br />
In <strong>the</strong> case of <strong>the</strong> wet process, <strong>the</strong> yearly weighted average specific heat consumption <strong>in</strong> <strong>the</strong> 4<br />
sample units has shown an improvement of 5.8% dur<strong>in</strong>g <strong>the</strong> year 87-88 to 90-91, but marg<strong>in</strong>ally<br />
<strong>in</strong>creased by 1.6% dur<strong>in</strong>g 1990-91 to 1991-92.<br />
In <strong>the</strong> case of semi-dry process, data could be obta<strong>in</strong>ed from one plant only. The specific heat<br />
consumption had more or less stagnated (95.3 to 96.4 kgoe/ton) dur<strong>in</strong>g <strong>the</strong> years 1987-88 to<br />
1990-91. It however registered a 5.08% improvement <strong>in</strong> 1991-92 with respect to <strong>the</strong> previous<br />
year.<br />
On <strong>the</strong> whole, all processes taken toge<strong>the</strong>r, <strong>the</strong> weighted average specific heat consumption of<br />
20 plants decreased steadily dur<strong>in</strong>g 1987-88 to 1991-92. As compared to <strong>the</strong> heat consumption<br />
of 96.4 kgoe/ton cl<strong>in</strong>ker <strong>in</strong> 1987-88, this has reduced to 88 kgoe/ton <strong>in</strong> 1991-92, thus show<strong>in</strong>g a<br />
reduction of 8.68% <strong>in</strong> <strong>the</strong> specific heat consumption dur<strong>in</strong>g <strong>the</strong> above period.<br />
Improvement <strong>in</strong> specific heat consumption <strong>in</strong> cement plants from 1983 - 1984<br />
Table 6.2.13 shows <strong>the</strong> process-wise weighted average specific heat consumption of <strong>the</strong> sample<br />
plants dur<strong>in</strong>g <strong>the</strong> years 1987-88 <strong>and</strong> 1991-92 compared with that of 1983-84.<br />
Table 6.2.13. Improvement <strong>in</strong> <strong>the</strong> weighted average specific heat consumption of<br />
cement plants dur<strong>in</strong>g 1987-88 <strong>and</strong> 1991-92 over 1983-84<br />
Weighted average specific heat % Improvement <strong>in</strong> heat<br />
Process consumption (kgoe/ton cl<strong>in</strong>ker) consumption over 1983-1984<br />
1983-1984 1987-1988 1991-1992 1987-1988 1991-1992<br />
Dry 101.50 91.40 85.60 9.9 15.6<br />
Semi-dry 103.90 95.60 91.50 8.0 11.9<br />
Wet 180.00 148.30 142.00 17.6 21.1<br />
Overall 119.30 96.30 87.90 19.2 26.2<br />
It is observed that <strong>in</strong> all <strong>the</strong> three processes, i.e., dry, semi-dry <strong>and</strong> wet processes, <strong>the</strong>re have<br />
been significant improvements <strong>in</strong> <strong>the</strong> specific heat consumption dur<strong>in</strong>g <strong>the</strong> period 1983-84 to<br />
1991-92. The extent of reduction <strong>in</strong> this period has been 15.6% <strong>in</strong> <strong>the</strong> dry process, 11.9% <strong>in</strong> <strong>the</strong><br />
semi-dry <strong>and</strong> <strong>the</strong> 21.10% <strong>in</strong> <strong>the</strong> wet process. Overall, a decrease of 26.2% has been observed.<br />
Apart from o<strong>the</strong>r reasons mentioned <strong>in</strong> <strong>the</strong> subsequent paragraphs, one reason for a low specific<br />
heat consumption <strong>in</strong> 1991-92 relative to 1983-84, has been that many of <strong>the</strong> plants with wet or<br />
semi-dry processes have switched over to <strong>the</strong> more <strong>energy</strong> efficient dry-process. In 1983-84, out<br />
of 21 plants exam<strong>in</strong>ed, 6 employed <strong>the</strong> dry process, 2 were semi-dry <strong>and</strong> 13 were wet-process<br />
plants. In 1991-92, 15 were dry, 1 semi-dry <strong>and</strong> 4 were wet process plants among 20 plants. It is<br />
seen that <strong>the</strong> switch<strong>in</strong>g over from <strong>the</strong> wet to dry process is <strong>the</strong> most effective measure to reduce<br />
specific <strong>energy</strong> consumption.<br />
The reduction <strong>in</strong> specific heat consumption <strong>in</strong> <strong>the</strong> case of all <strong>the</strong> three process over <strong>the</strong> years<br />
(1983-84 to 1991-92) is attributed to various <strong>energy</strong> conservation measures adopted by<br />
<strong>in</strong>dividual plants. These <strong>in</strong>cluded better operational control <strong>and</strong> optimization (reduc<strong>in</strong>g false air<br />
<strong>in</strong>filtration, efficient feed<strong>in</strong>g systems, use of m<strong>in</strong>eralizers <strong>and</strong> slurry thickeners, etc.); <strong>technology</strong>
Profile of <strong>the</strong> Cement Industry <strong>in</strong> India 81<br />
upgrad<strong>in</strong>g (automation of process control <strong>and</strong> <strong>energy</strong> efficient equipment/system); <strong>and</strong><br />
improved <strong>energy</strong> management activities.<br />
The current level of <strong>the</strong>rmal <strong>energy</strong> consumption (pyro-process<strong>in</strong>g) achieved by <strong>in</strong>ternational<br />
practice abroad is reported to be 71.0 kgoe/ton cl<strong>in</strong>ker. These are <strong>in</strong>variably for dry process<br />
plants as <strong>the</strong>re are hardly any wet process operations abroad. Therefore, <strong>the</strong>re is potential for<br />
fur<strong>the</strong>r reduction <strong>in</strong> <strong>the</strong>rmal <strong>energy</strong> consumption by <strong>the</strong> Indian <strong>in</strong>dustry.<br />
Comparison with <strong>the</strong> <strong>in</strong>ternational scenario (overall cl<strong>in</strong>ker <strong>and</strong> cement plants)<br />
The weighted average specific <strong>energy</strong> consumption levels of USA, UK, Japan <strong>and</strong> India for<br />
particular years are given below <strong>in</strong> Table 6.2.14.<br />
Table 6.2.14. Comparison of specific <strong>energy</strong> consumptions of selected countries<br />
Country Specific <strong>the</strong>rmal <strong>energy</strong><br />
Specific electrical <strong>energy</strong><br />
consumption (kgoe/ton cl<strong>in</strong>ker) consumption (kWh/ton cement)<br />
USA (1990) 98.4 127.9<br />
UK (1989) 111.6 122<br />
Japan (1988) 71.0 103<br />
India (1991-92) 88.0 120.64<br />
Source: DSIR Report<br />
The above data may not be strictly comparable due to <strong>the</strong> difference <strong>in</strong> reference years, but it is<br />
<strong>in</strong>dicative that compared to <strong>the</strong> best run plants (even dur<strong>in</strong>g 1988) <strong>in</strong> Japan, specific<br />
consumption <strong>in</strong> India averaged 30% more <strong>in</strong> cl<strong>in</strong>ker stage.<br />
In <strong>the</strong> more recent period, some of <strong>the</strong> best perform<strong>in</strong>g plants abroad have reported <strong>the</strong>ir<br />
<strong>the</strong>rmal <strong>energy</strong> consumption <strong>in</strong> <strong>the</strong> range of 70-71 kgoe/ton cl<strong>in</strong>ker <strong>and</strong> power consumption<br />
around 90 kWh/ton cement through adoption of <strong>energy</strong> efficient technologies <strong>and</strong> practices. In<br />
<strong>the</strong> case of a Korean plant with cogeneration of power (17 kWh/ton cement) utiliz<strong>in</strong>g preheater<br />
<strong>and</strong> cooler waste heat, <strong>the</strong> specific power consumption was reported to be 72 kWh/t of cement.<br />
In comparison to modern dry process plants <strong>in</strong> Japan with a specific <strong>energy</strong> consumption of<br />
representative cement plants <strong>in</strong> India, a scope for reduction of 17 kgoe/ton cl<strong>in</strong>ker <strong>and</strong> 17.64<br />
kWh/ton cement exists <strong>in</strong> Indian plants <strong>and</strong> this corresponds to 19.3% <strong>the</strong>rmal <strong>and</strong> 14.6% <strong>in</strong><br />
electrical <strong>energy</strong> reduction with reference to <strong>the</strong> present level.<br />
Some of <strong>the</strong>se technological advancements have also been adopted <strong>in</strong> some of <strong>the</strong> Indian<br />
cement plants, result<strong>in</strong>g <strong>in</strong> higher <strong>energy</strong> efficiencies. In one of <strong>the</strong> recent 1 million ton per<br />
annum dry process Indian cement plant, <strong>the</strong> <strong>energy</strong> consumption level <strong>in</strong> <strong>the</strong> year 1991-92 was<br />
76.1 kgoe/ton cl<strong>in</strong>ker <strong>and</strong> 92 kWh/ton cement.<br />
6.2.3.4 Electrical <strong>energy</strong> consumption<br />
All <strong>the</strong> cement manufactur<strong>in</strong>g processes, e.g., crush<strong>in</strong>g, raw mill, pyro-process<strong>in</strong>g, coal mill,<br />
cement mill <strong>and</strong> pack<strong>in</strong>g sections consume electrical <strong>energy</strong>. Table 6.2.15 shows <strong>the</strong> specific<br />
electrical <strong>energy</strong> consumption per ton of cement for <strong>in</strong>dividual plants dur<strong>in</strong>g <strong>the</strong> years 1987-88<br />
to 1991-92, <strong>and</strong> <strong>the</strong> process-wise weighted average from 1987-88 to 1991-92.<br />
In <strong>the</strong> case of <strong>the</strong> dry process, <strong>the</strong> weighted average specific power consumption of 29 units<br />
showed a decreas<strong>in</strong>g trend s<strong>in</strong>ce 1987-88. The specific power consumption has come down<br />
from 136 kWh/t <strong>in</strong> 1987-88 to 122.1 kWh/t of cement <strong>in</strong> 1991-92. The updated data for <strong>the</strong>
82 Technology, Energy Efficiency <strong>and</strong> Environmental Externalities of <strong>the</strong> Cement Industry<br />
year 1992-93 of <strong>the</strong> 11 dry process plants <strong>in</strong>dicate that weighted average power consumption of<br />
<strong>the</strong>se plants is 109.7 kWh/t of cement. However, <strong>the</strong> <strong>in</strong>dividual plants showed a wide variation<br />
<strong>in</strong> specific power consumption <strong>and</strong> ranged between 136.1 kWh/t to 187.5 kWh/t <strong>in</strong> 1987-88<br />
<strong>and</strong> between 93.8 <strong>and</strong> 162.3 kWh/t of cement <strong>in</strong> 1991-92.<br />
Table 6.2.15. Process-wise specific electrical <strong>energy</strong> consumption (weighted average) <strong>in</strong><br />
all plants for <strong>the</strong> year 1987-88 to 1991-92 (<strong>in</strong> kWh/t of cement)<br />
Year Dry Semi-dry Wet All Plants<br />
1987-1988 136.1 134.5 111.8 130.7<br />
1988-1989 131.4 133.3 109.8 128.0<br />
1989-1990 126.9 122.6 109.5 124.3<br />
1990-1991 127.1 134.2 109.7 124.9<br />
1991-1992 122.1 134.1 108.8 120.6<br />
It is observed from <strong>the</strong> analysis that among <strong>the</strong> three processes, <strong>the</strong> wet process consumes <strong>the</strong><br />
least specific power. The weighted average specific power consumption <strong>in</strong> wet process has been<br />
89.1% <strong>and</strong> 81.2% of <strong>the</strong> dry <strong>and</strong> semi-dry process, respectively, dur<strong>in</strong>g <strong>the</strong> year 1991-92.<br />
The weighted average specific power consumption of 10 wet process plants exhibited a<br />
decreased consumption, i.e., 111.8 kWh/t of cement <strong>in</strong> 1987-88 <strong>and</strong> 108.8 kWh/t of cement <strong>in</strong><br />
1991-92. The reduction, however, has been marg<strong>in</strong>al (2.63%). The variation of specific<br />
consumption <strong>in</strong> different plants have not been as wide as <strong>in</strong> <strong>the</strong> dry process. It varied between<br />
99.6 kWh/t <strong>and</strong> 133.7 kWh/t of cement <strong>in</strong> 1987-88 <strong>and</strong> between 93.8 kWh/t to 138 kWh/t <strong>in</strong><br />
1991-92.<br />
In case of <strong>the</strong> semi-dry process plants, <strong>the</strong> weighted average specific power consumption of 2<br />
units have been stagnant at around 134 kWh/t of cement dur<strong>in</strong>g <strong>the</strong> above period (except for<br />
<strong>the</strong> year 1989-90 which showed <strong>the</strong> lower consumption of 122.6 kWh/t). The specific power<br />
consumption of both <strong>the</strong> <strong>in</strong>dividual units also rema<strong>in</strong>ed more or less at <strong>the</strong> same level dur<strong>in</strong>g <strong>the</strong><br />
above period.<br />
The overall weighted average specific power consumption exhibited a steady decreas<strong>in</strong>g trend.<br />
As compared to <strong>the</strong> power consumption of 130.74 kWh/t cement <strong>in</strong> 1987-88, <strong>the</strong> reduction has<br />
been 7.7% <strong>in</strong> 1991-92.<br />
Improvement <strong>in</strong> <strong>the</strong> specific power consumption<br />
Table 6.2.16 compares <strong>the</strong> cement process-wise weighted average specific power consumption<br />
of sample plants dur<strong>in</strong>g <strong>the</strong> years 1987-88 <strong>and</strong> 1991-92 with <strong>the</strong> consumption scenario <strong>in</strong> 1983-<br />
84.<br />
It is observed from Table 6.2.16 that <strong>in</strong> <strong>the</strong> case of dry process, <strong>the</strong>re has been significant<br />
improvements <strong>in</strong> <strong>the</strong> power consumption. The weighted average specific power consumption<br />
has reduced from 155.0 kWh/t of cement <strong>in</strong> <strong>the</strong> year 1983-84 to 122.09 kWh/t <strong>in</strong> <strong>the</strong> year 1991-<br />
92. The reduction <strong>in</strong> specific consumption has been 21.2% dur<strong>in</strong>g <strong>the</strong> period.<br />
In <strong>the</strong> case of <strong>the</strong> wet process, <strong>the</strong>re has been only a marg<strong>in</strong>al decrease <strong>in</strong> <strong>the</strong> power<br />
consumption dur<strong>in</strong>g <strong>the</strong> periods 1983-84 over 1991-92. The weighted average specific power<br />
consumption which was 113.8 kWh/t of cement <strong>in</strong> 1983-84 has decreased by 4.4% dur<strong>in</strong>g <strong>the</strong><br />
year 1991-92.
Profile of <strong>the</strong> Cement Industry <strong>in</strong> India 83<br />
Table 6.2.16. Improvement <strong>in</strong> specific electricity consumption dur<strong>in</strong>g<br />
1987-88 <strong>and</strong> 1991-92 over 1983-84<br />
Weighted average specific electrical % Improvement <strong>in</strong> electrical<br />
Process <strong>energy</strong> consumption (kWh/t cement) <strong>energy</strong> consumption over 1983-<br />
84<br />
1983-84 1987-88 1991-92 1987-88 1991-92<br />
Dry 155.0 136.1 122.1 12.21 21.1<br />
Semi-dry 122.8 134.5 134.1 -9.59 -9.2<br />
Wet 113.8 111.8 108.8 1.78 4.4<br />
Overall 130.2 130.7 120.6 0.00 7.8<br />
No. of plants<br />
<strong>in</strong>vestigated<br />
Dry Semi-dry Wet Total<br />
1983-1984 6 2 13 21<br />
1987-88 & 1991-92 29 2 10 41<br />
Note: The comparison can only be <strong>in</strong>dicative s<strong>in</strong>ce <strong>the</strong> number of plants considered, as well as<br />
<strong>the</strong> process mix have not been <strong>the</strong> same <strong>in</strong> different periods (due to <strong>the</strong> fact that many<br />
of <strong>the</strong> plants hav<strong>in</strong>g wet process earlier have switched over to <strong>the</strong> dry process.)<br />
Never<strong>the</strong>less, this shows that <strong>the</strong> total <strong>energy</strong> consumption has been reduced.<br />
In case of semi-dry process, <strong>the</strong> specific power consumption is found to have <strong>in</strong>creased. The<br />
weighted average specific power consumption which was 122.76 kWh/t dur<strong>in</strong>g <strong>the</strong> year 1983-84<br />
has <strong>in</strong>creased to 134 kWh/t dur<strong>in</strong>g <strong>the</strong> year 1991-92, an <strong>in</strong>crement of 9% over that <strong>in</strong> 1983-84.<br />
This may not be of much significance s<strong>in</strong>ce <strong>the</strong> figure is only for one semi-dry unit <strong>and</strong> <strong>the</strong><br />
contribution of all semi-dry process units is only about 2.0% of <strong>the</strong> total cement <strong>in</strong>dustry<br />
capacity.<br />
The weighted average specific power consumption of 21 sample plants studied dur<strong>in</strong>g <strong>the</strong> entire<br />
period of 1983-84 was 130.2 kWh/t cement, which shows a reduction of 7.8% when compared<br />
to <strong>the</strong> weighted average specific power consumption of 41 plants dur<strong>in</strong>g <strong>the</strong> year 1991-92. The<br />
variation <strong>in</strong> specific power consumption <strong>in</strong> different units are ma<strong>in</strong>ly due to plant capacity<br />
utilization variations, irregular supply of grid power, variation of <strong>the</strong> equipment capacity <strong>in</strong>stalled<br />
among <strong>the</strong> units, partial load<strong>in</strong>g of equipment, idle equipment, <strong>in</strong>stallation of <strong>energy</strong> efficient<br />
equipment, etc. It is noteworthy that <strong>the</strong> weighted average specific power consumption <strong>in</strong><br />
precalc<strong>in</strong>er kiln (17 nos.) was low at 119.4 kWh/t cement as compared to 128.74 kWh/t cement<br />
<strong>in</strong> preheater kilns (12 nos.) for <strong>the</strong> year 1991-92. The reasons for this variation are <strong>the</strong> latter<br />
kilns’ higher specific <strong>energy</strong> consumption <strong>and</strong> more stable operation of <strong>the</strong> kilns <strong>in</strong> <strong>the</strong> former.<br />
6.2.3.5 Domestic Manufacture of Cement Mach<strong>in</strong>ery & Equipment<br />
In <strong>the</strong> early 1980s, <strong>the</strong> designs for manufactur<strong>in</strong>g large sized cement plants were not available <strong>in</strong><br />
<strong>the</strong> country, <strong>and</strong> this encouraged some of <strong>the</strong> Indian cement mach<strong>in</strong>ery manufacturers to go <strong>in</strong><br />
for collaboration efforts with foreign manufacturers. Through <strong>the</strong> experience ga<strong>in</strong>ed over time,<br />
<strong>the</strong> Indian mach<strong>in</strong>ery manufacturers are now able to manufacture cement mach<strong>in</strong>ery <strong>and</strong><br />
equipment, <strong>and</strong> to supply large size cement plants. Quite a large number of components <strong>and</strong><br />
systems which were earlier imported are also be<strong>in</strong>g manufactured <strong>in</strong>digenously. Some of <strong>the</strong><br />
items that cont<strong>in</strong>ue to be imported <strong>in</strong> various sections of cement plants are shown <strong>in</strong> Table<br />
6.2.17.
84 Technology, Energy Efficiency <strong>and</strong> Environmental Externalities of <strong>the</strong> Cement Industry<br />
Table 6.2.17. Item imported for various sections <strong>in</strong> Indian cement plants<br />
------------------------------------------------------------------------------------------------------------------------<br />
Crush<strong>in</strong>g Wear resistant l<strong>in</strong>ers for crushers, few mechanical components<br />
of <strong>the</strong> crusher.<br />
Raw mill Vertical roller mill systems mill drive.<br />
Blend<strong>in</strong>g <strong>and</strong> kiln Feed<strong>in</strong>g system for kiln (Dry Process)<br />
Burn<strong>in</strong>g <strong>and</strong> cool<strong>in</strong>g Parts of preheater, precalc<strong>in</strong>er Coal<br />
Coal Gr<strong>in</strong>d<strong>in</strong>g Weigh<strong>in</strong>g <strong>and</strong> feed<strong>in</strong>g systems.<br />
Cement Gr<strong>in</strong>d<strong>in</strong>g Special lubrication systems.<br />
Automation & Control system Computerized process control/monitor<strong>in</strong>g systems, on l<strong>in</strong>e<br />
analyses, advance <strong>in</strong>strumentation, etc.<br />
------------------------------------------------------------------------------------------------------------------------<br />
6.2.4 Environmental Externalities<br />
There is an <strong>in</strong>creas<strong>in</strong>g realization all over <strong>the</strong> world for <strong>the</strong> abatement of <strong>environmental</strong><br />
pollution. This is apparent from <strong>the</strong> str<strong>in</strong>gent emission limits as stipulated by <strong>the</strong> several<br />
governments world wide for compliance by <strong>the</strong> respective manufactur<strong>in</strong>g <strong>in</strong>dustries. The<br />
cement <strong>in</strong>dustry is one among <strong>the</strong> <strong>in</strong>dustries creat<strong>in</strong>g high pollution <strong>and</strong> is covered by such<br />
regulations.<br />
In India, <strong>the</strong> above aspects have ga<strong>in</strong>ed considerable importance <strong>and</strong> momentum <strong>in</strong> l<strong>in</strong>e with <strong>the</strong><br />
rapidly progress<strong>in</strong>g <strong>in</strong>dustrialization <strong>and</strong> modernization. The cement <strong>in</strong>dustry <strong>in</strong> particular has<br />
set itself for a rapid progress to meet <strong>the</strong> ever <strong>in</strong>creas<strong>in</strong>g dem<strong>and</strong> for construction materials. It is<br />
<strong>the</strong>refore imperative to improve <strong>the</strong> <strong>environmental</strong> conditions <strong>in</strong> <strong>the</strong> exist<strong>in</strong>g plants <strong>and</strong><br />
projected plants of <strong>the</strong> cement <strong>in</strong>dustry.<br />
Cement manufactur<strong>in</strong>g may contribute significantly to air pollution <strong>in</strong> <strong>the</strong> vic<strong>in</strong>ity of <strong>the</strong> work, as<br />
large quantities of pulverized materials are h<strong>and</strong>led at each stage of manufactur<strong>in</strong>g, from <strong>the</strong><br />
crush<strong>in</strong>g of raw materials to f<strong>in</strong>al packag<strong>in</strong>g of cement. Such pollution results from <strong>the</strong> emission<br />
of dust. In addition to above, a cement plant also produces noise <strong>and</strong> gaseous emissions, i.e.,<br />
NOX <strong>and</strong> SO2. However, emission of gaseous pollutants like NOX <strong>and</strong> SO2 is generally very<br />
less <strong>and</strong> is of m<strong>in</strong>or importance.<br />
Cement plants do not significantly contribute to <strong>the</strong> national <strong>and</strong> global pollution. The impact<br />
of pollution due to cement plants on environment is local, i.e., it is generally limited to a distance<br />
of 10 km maximum from its place of <strong>in</strong>stallation. The regulations issued <strong>in</strong> various countries<br />
until now are all primarily <strong>in</strong>tended to br<strong>in</strong>g air pollution under control with<strong>in</strong> <strong>the</strong> vic<strong>in</strong>ity, as<br />
well as <strong>in</strong>side <strong>the</strong> factory. The dom<strong>in</strong>at<strong>in</strong>g <strong>environmental</strong> problem <strong>in</strong> <strong>the</strong> Indian cement plants is<br />
<strong>the</strong> emission of dust to <strong>the</strong> atmosphere.<br />
The production of cement, irrespective of <strong>the</strong> technique adopted (dry, semi-dry, <strong>and</strong> wet) results<br />
<strong>in</strong> dust generation, <strong>and</strong> hence, pollution. However, dust generation is most <strong>in</strong>tense <strong>in</strong> <strong>the</strong> dry<br />
process. Tak<strong>in</strong>g <strong>in</strong>to account <strong>the</strong> air pollution by <strong>the</strong> cement <strong>in</strong>dustry, emission st<strong>and</strong>ards have
Profile of <strong>the</strong> Cement Industry <strong>in</strong> India 85<br />
been worked out for cement plants of different capacities by <strong>the</strong> Central Pollution Control<br />
Board of India <strong>and</strong> are shown <strong>in</strong> Table 6.2.18.<br />
Table 6.2.18. Emission st<strong>and</strong>ards <strong>in</strong> <strong>the</strong> cement <strong>in</strong>dustry of India<br />
Emission st<strong>and</strong>ards for particulate matter<br />
(mg/nm 3 )<br />
Plant production<br />
capacity<br />
Protected area O<strong>the</strong>r areas<br />
200 TPD or less 250 400<br />
> 200 TPD 150 250<br />
Source : Central Pollution Control Board<br />
The sources of dust generated <strong>in</strong> cement <strong>in</strong>dustry are from <strong>the</strong> follow<strong>in</strong>g operations:<br />
- Crush<strong>in</strong>g of raw materials<br />
- Storage <strong>and</strong> pre-blend<strong>in</strong>g of raw material<br />
- Gr<strong>in</strong>d<strong>in</strong>g<br />
- Blend<strong>in</strong>g <strong>and</strong> homogenization<br />
- Pyro-process<strong>in</strong>g<br />
- Cl<strong>in</strong>ker storage <strong>and</strong> transport<br />
- Cement gr<strong>in</strong>d<strong>in</strong>g<br />
- Cement storage<br />
- Cement pack<strong>in</strong>g operations<br />
- Convey<strong>in</strong>g of raw materials <strong>and</strong> f<strong>in</strong>ished products<br />
To produce one ton of cement means h<strong>and</strong>l<strong>in</strong>g a comb<strong>in</strong>ation of about 2-2.6 tons of rawmaterials,<br />
gypsum, coal, etc. Between 5-10% of <strong>the</strong>se f<strong>in</strong>ely pulverized materials rema<strong>in</strong><br />
suspended as dust <strong>in</strong> gas/air <strong>and</strong> have to be substantially removed before be<strong>in</strong>g discharged <strong>in</strong>to<br />
<strong>the</strong> atmosphere. Gas or air to be de-dusted, varies between 6 <strong>and</strong> 12 m 3 /kg cement production<br />
depend<strong>in</strong>g upon <strong>the</strong> design of <strong>the</strong> plant.<br />
6.2.5 Status of application of new technologies<br />
6.2.5.1 Status of <strong>the</strong> development of <strong>technology</strong> <strong>in</strong> India<br />
Processes <strong>and</strong> equipment<br />
Many of <strong>the</strong> Indian cement plants have adopted <strong>energy</strong> efficient processes <strong>and</strong> equipment to a<br />
certa<strong>in</strong> extent, based on <strong>the</strong> experiences of development worldwide <strong>and</strong> after <strong>in</strong>vestigat<strong>in</strong>g <strong>the</strong>ir<br />
appropriateness to domestic conditions. Some of <strong>the</strong> modern practices <strong>in</strong>troduced are as<br />
follows:<br />
• Mobile crushers<br />
Keep<strong>in</strong>g <strong>in</strong> view <strong>the</strong> split locations of limestone deposits <strong>and</strong> <strong>the</strong> long convey<strong>in</strong>g distances,<br />
mobile crushers are be<strong>in</strong>g given preference <strong>in</strong> some of <strong>the</strong> new cement <strong>in</strong>stallations <strong>in</strong> India.<br />
Brought about by its advantages over conventional systems, one plant is already operat<strong>in</strong>g with a<br />
mobile crusher <strong>and</strong> a few <strong>in</strong>stallations are com<strong>in</strong>g up <strong>in</strong> o<strong>the</strong>r plants.
86 Technology, Energy Efficiency <strong>and</strong> Environmental Externalities of <strong>the</strong> Cement Industry<br />
• Gyratory crushers<br />
A few plants are operat<strong>in</strong>g with gyratory crushers, though its acceptability is still limited ma<strong>in</strong>ly<br />
due to capacity considerations.<br />
• Vertical roller mills<br />
In <strong>the</strong> 54 sample plants studied, <strong>the</strong> number of vertical roller mills <strong>in</strong>stalled <strong>in</strong> <strong>the</strong> Raw Meal<br />
Gr<strong>in</strong>d<strong>in</strong>g <strong>and</strong> Coal Mill Sections are given <strong>in</strong> Table 6.2.19.<br />
Table 6.2.19. Adoption of vertical roller mills vis-à-vis ball mills<br />
Section/Mill Dry Semi-dry Wet Mixed Total<br />
Raw Meal Gr<strong>in</strong>d<strong>in</strong>g<br />
Ball mill 20 2 19 2 43<br />
Vertical roller 10 - - - 10<br />
Coal Mill<br />
Ball mill 9 1 16 - 26<br />
Vertical roller 6 - - - 6<br />
From <strong>the</strong> table, it is seen that all <strong>the</strong> wet <strong>and</strong> semi dry process plants utilize ball mills only <strong>in</strong> <strong>the</strong><br />
raw meal gr<strong>in</strong>d<strong>in</strong>g as well as <strong>in</strong> coal mill sections. In <strong>the</strong> case of <strong>the</strong> dry process plants, a number<br />
of plants operate with vertical roller mills. In <strong>the</strong> raw meal gr<strong>in</strong>d<strong>in</strong>g section, 33% of <strong>the</strong> plants<br />
have vertical roller mills <strong>and</strong> <strong>in</strong> <strong>the</strong> coal mill section, 40% of <strong>the</strong> plants are operat<strong>in</strong>g with<br />
vertical roller mills.<br />
• T<strong>and</strong>em mills<br />
These mills have been well accepted <strong>and</strong> <strong>in</strong>troduced <strong>in</strong> many Indian cement plants.<br />
• High pressure gr<strong>in</strong>d<strong>in</strong>g rolls (roller press)<br />
Two plants have already <strong>in</strong>stalled roller presses for raw materials gr<strong>in</strong>d<strong>in</strong>g after realiz<strong>in</strong>g <strong>the</strong><br />
benefits of <strong>in</strong>creased productivity <strong>and</strong> reduction <strong>in</strong> <strong>energy</strong> consumption.<br />
• Dust collect<strong>in</strong>g equipment<br />
The emission of dust particles causes loss of <strong>energy</strong> as well as loss <strong>in</strong> production, which<br />
o<strong>the</strong>rwise can be recycled through <strong>in</strong>sufflation <strong>and</strong> re-utilized <strong>in</strong> cement manufacture. For kiln<br />
flue gases, coal mill vent air <strong>and</strong> cement mill exit air Electro-Static Precipitators (ESPs) of latest<br />
<strong>technology</strong> are be<strong>in</strong>g <strong>in</strong>stalled. For vent<strong>in</strong>g out <strong>the</strong> excess hot air from <strong>the</strong> cooler, hightemperature<br />
ESPs are be<strong>in</strong>g considered. The <strong>in</strong>troduction of <strong>the</strong>se ESPs can result <strong>in</strong> conserv<strong>in</strong>g<br />
<strong>energy</strong> dur<strong>in</strong>g cement manufacture. For transfer po<strong>in</strong>ts of convey<strong>in</strong>g system, cassette-type bag<br />
dust collectors have also been accepted <strong>in</strong> some of <strong>the</strong> plants.<br />
• Precalc<strong>in</strong>ation <strong>technology</strong> <strong>and</strong> 5/6-stage suspension preheater<br />
Many of <strong>the</strong> new <strong>in</strong>stallations have come up with precalc<strong>in</strong>er kiln which have resulted <strong>in</strong> reduced<br />
kiln dimensions. The use of precalc<strong>in</strong>ator also enables <strong>the</strong> utilization of high ash coals which is a<br />
significant advantage under <strong>the</strong> Indian conditions.
Profile of <strong>the</strong> Cement Industry <strong>in</strong> India 87<br />
Similarly, <strong>in</strong>stallation of 5-stage preheater precalc<strong>in</strong>er system has also led to pressure drops<br />
which give a <strong>the</strong>rmal <strong>energy</strong> sav<strong>in</strong>g of 30-40 kcal/kg cl<strong>in</strong>ker, <strong>the</strong>reby promot<strong>in</strong>g <strong>energy</strong><br />
conservation. Fur<strong>the</strong>r addition of <strong>the</strong> sixth stage can br<strong>in</strong>g additional <strong>energy</strong> sav<strong>in</strong>g of 15-20<br />
kcal/kg cl<strong>in</strong>ker.<br />
The analysis of kilns set up dur<strong>in</strong>g <strong>the</strong> period between 1981 <strong>and</strong> 1991 have shown that out of 27<br />
dry process kilns <strong>in</strong>stalled dur<strong>in</strong>g this period, 15 have <strong>in</strong>corporated precalc<strong>in</strong>ation <strong>technology</strong>, 8<br />
are operat<strong>in</strong>g with 5 stage preheater ,<strong>and</strong> one plant has gone for 6th stage preheater. Low<br />
pressure cyclones have also been well accepted <strong>in</strong> all <strong>the</strong> new <strong>in</strong>stallations.<br />
Instrumentation, process control <strong>and</strong> computerization<br />
With <strong>the</strong> <strong>in</strong>crease <strong>in</strong> size of <strong>the</strong> cement units <strong>and</strong> consequently, <strong>the</strong> large magnitude of material<br />
h<strong>and</strong>l<strong>in</strong>g <strong>and</strong> movement, it has become essential to go <strong>in</strong> for a reasonable extent of automation<br />
<strong>in</strong> <strong>the</strong> cement <strong>in</strong>dustry. Most of <strong>the</strong> modern dry process cement plants <strong>in</strong> <strong>the</strong> country are<br />
presently equipped with advanced <strong>in</strong>strumentation <strong>and</strong> process control systems with ei<strong>the</strong>r<br />
micro-processor based control systems or complete computerized controls. Almost all one<br />
million ton per annum cement plants <strong>in</strong> <strong>the</strong> country have gone for <strong>the</strong> use of micro<br />
computer/computer for process monitor<strong>in</strong>g <strong>and</strong> control, data acquisition, supervision <strong>and</strong><br />
management <strong>in</strong>formation system. Eight cement plants <strong>in</strong> India have <strong>in</strong>stalled computerized<br />
expert systems for on-l<strong>in</strong>e kiln operations. The Indian cement <strong>in</strong>dustry has been able to develop<br />
<strong>the</strong> necessary capability towards application eng<strong>in</strong>eer<strong>in</strong>g <strong>and</strong> ma<strong>in</strong>tenance of <strong>the</strong>se sophisticated<br />
automation systems <strong>and</strong> <strong>the</strong>se are likely to f<strong>in</strong>d greater application <strong>in</strong> <strong>the</strong> future capacities. With<br />
more than 50 organizations throughout <strong>the</strong> world supply<strong>in</strong>g different types of automation<br />
systems, <strong>the</strong> selection of <strong>the</strong> most appropriate automation <strong>and</strong> computerized control system<br />
becomes a very difficult task. With this k<strong>in</strong>d of a scenario, it is important that some k<strong>in</strong>d of<br />
st<strong>and</strong>ardization is attempted on <strong>the</strong> use of such automation system based on <strong>the</strong>ir operational<br />
experience. Moreover, with <strong>the</strong> high technological status of <strong>the</strong> computer <strong>in</strong>dustry, both from<br />
software <strong>and</strong> hardware angle <strong>in</strong> <strong>the</strong> country, greater efforts should be directed towards<br />
<strong>in</strong>digenization of <strong>the</strong>se systems. In addition to advanced process <strong>and</strong> operational control, <strong>the</strong> use<br />
of <strong>in</strong>frared type shell temperature scanners have found wider application with <strong>the</strong> advent of high<br />
capacity kilns. These computerized scann<strong>in</strong>g systems are presently available with an <strong>in</strong>tegrated<br />
software package for complete refractory management which can monitor <strong>and</strong> predict refractory<br />
conditions result<strong>in</strong>g <strong>in</strong> substantial reduction of downtime due to refractory failures.<br />
In addition to <strong>the</strong> wide use of computers for on-l<strong>in</strong>e process control <strong>in</strong> <strong>the</strong> cement <strong>in</strong>dustry,<br />
computers have also found significant application <strong>in</strong> <strong>the</strong> area of quality control. The use of XRF<br />
analyzers with on-l<strong>in</strong>e computers has helped <strong>in</strong> automat<strong>in</strong>g raw material preparation <strong>in</strong> order to<br />
ma<strong>in</strong>ta<strong>in</strong> uniform quality of raw meal feed to <strong>the</strong> kiln.<br />
Recently, <strong>the</strong> use of Neutron Activation Technique has also been reported for both on-l<strong>in</strong>e bulk<br />
analysis as well as off-l<strong>in</strong>e elemental analysis <strong>and</strong> <strong>the</strong>se systems are available with real-time<br />
computers which enable immediate corrective action.<br />
Comprehensive computerization <strong>in</strong> <strong>the</strong> manufactur<strong>in</strong>g process <strong>and</strong> conversion of exist<strong>in</strong>g plants<br />
to modem control methods, by utiliz<strong>in</strong>g analytical <strong>in</strong>strumentation are on <strong>the</strong> move worldwide.<br />
Computer-based systems have been <strong>in</strong>stalled to ma<strong>in</strong>ta<strong>in</strong> control over <strong>the</strong> blend<strong>in</strong>g process <strong>in</strong><br />
many countries. The present ma<strong>in</strong>tenance practices <strong>in</strong> cement plants have shown that<br />
considerable production time is lost due to unplanned <strong>and</strong> unscheduled ma<strong>in</strong>tenance stoppages.<br />
The condition monitor<strong>in</strong>g systems (CMS) now <strong>in</strong> vogue, predict problems likely to arise <strong>and</strong>
88 Technology, Energy Efficiency <strong>and</strong> Environmental Externalities of <strong>the</strong> Cement Industry<br />
serve advance warn<strong>in</strong>g for timely <strong>and</strong> appropriate ma<strong>in</strong>tenance action. Computers can be<br />
applied to CMS <strong>in</strong> data storage <strong>and</strong> trend analysis; mach<strong>in</strong>e/component condition diagnostics:<br />
failure prediction, <strong>and</strong> report<strong>in</strong>g <strong>and</strong> l<strong>in</strong>k<strong>in</strong>g to a plann<strong>in</strong>g system for ma<strong>in</strong>tenance action. The<br />
use of advanced <strong>in</strong>strumentation systems <strong>and</strong> computers would be essential for <strong>the</strong> higher<br />
capacity plants to be set up <strong>in</strong> <strong>the</strong> next few years <strong>and</strong> <strong>the</strong> adoption of <strong>the</strong>se systems should be<br />
encouraged <strong>in</strong> order to derive <strong>the</strong> advantages of higher productivity, lower cost of production,<br />
<strong>in</strong>creased plant availability <strong>and</strong> improved <strong>and</strong> consistent quality of product.<br />
Expert systems<br />
The advent of one-million-<strong>and</strong>-above ton capacity dry process plants has brought <strong>in</strong>to focus<br />
some new associated problems. A major problem is that of f<strong>in</strong>d<strong>in</strong>g experts to cope with<br />
abnormal situations <strong>in</strong> case of plant upsets, for which <strong>the</strong> presently available computer controls<br />
are not of much use. Artificial <strong>in</strong>telligence (AI) <strong>and</strong> heuristic programm<strong>in</strong>g techniques offer a<br />
way of solv<strong>in</strong>g <strong>the</strong>se problems. Artificial <strong>in</strong>telligence based expert systems are expected to be<br />
used to aid <strong>the</strong> plant personnel to recover from complicated <strong>and</strong> abnormal situations <strong>and</strong> thus<br />
reduce both plant outages <strong>and</strong> personnel requirements.<br />
Automatic kiln control systems based on expert <strong>and</strong> fuzzy systems have been successfully<br />
implemented <strong>in</strong> <strong>the</strong> cement <strong>in</strong>dustry <strong>and</strong> about 8 such systems are now work<strong>in</strong>g <strong>in</strong> <strong>the</strong> Indian<br />
cement <strong>in</strong>dustry. Expert systems have also found applications <strong>in</strong> automatic controls of closed<br />
circuit ball mills. Efforts are reported <strong>in</strong> <strong>the</strong> area of raw mix control us<strong>in</strong>g expert systems. NCB<br />
has developed an expert system for efficient operation of rotary kiln which is a l<strong>in</strong>guistic rule<br />
based system us<strong>in</strong>g fuzzy ma<strong>the</strong>matics. NCB <strong>and</strong> DOE have jo<strong>in</strong>tly taken up steps for<br />
implementation of <strong>the</strong> complete expert kiln control system <strong>in</strong> Indian cement plants.<br />
In addition to <strong>the</strong> above, AI is likely to help <strong>in</strong> improv<strong>in</strong>g preventive ma<strong>in</strong>tenance schedules<br />
with passage of time at a cement plant. Failure prediction, detection <strong>and</strong> analysis is likely to<br />
become ano<strong>the</strong>r major application of AI techniques <strong>in</strong> cement plants. The cement <strong>in</strong>dustry will<br />
have to go <strong>in</strong> for application of AI techniques very soon <strong>in</strong> a big way.<br />
6.2.5.2 Particulate Pollution <strong>and</strong> Abatement<br />
Dust collection systems<br />
One major pollution abatement method is through <strong>the</strong> use of dust collection systems <strong>in</strong> various<br />
sections of <strong>the</strong> cement process plant.<br />
• Crush<strong>in</strong>g<br />
Crush<strong>in</strong>g is a prelim<strong>in</strong>ary operation used for size reduction of run of <strong>the</strong> quarry material of size<br />
500-1000 to a size of 16 mm acceptable for raw metal gr<strong>in</strong>d<strong>in</strong>g. Dust generation is about 5-15<br />
gm/nm 3 consist<strong>in</strong>g of coarse particles. The type of dust collector <strong>in</strong>cludes cyclones, bag filter<br />
<strong>and</strong> <strong>in</strong> some cases wet scrubbers. The ma<strong>in</strong> drawback of cyclone is its low collection <strong>efficiency</strong><br />
on small particles. As a result, it does not meet <strong>the</strong> st<strong>and</strong>ards stipulated by <strong>the</strong> state/central<br />
pollution control boards. In order to meet <strong>the</strong> st<strong>and</strong>ards as prescribed, generally higher<br />
<strong>efficiency</strong> dust collectors like fabric filters are used. Use of wet scrubbers may cause sludge<br />
disposal problem <strong>and</strong> hence <strong>the</strong>se are not <strong>in</strong>stalled.<br />
• Raw Mill<br />
Raw mill is used to gr<strong>in</strong>d raw materials to a size up to 10% reta<strong>in</strong>ed on 170 mesh or 90 microns,<br />
<strong>in</strong> order that it can be used as kiln feed. The normal dust generation <strong>in</strong> roller mill <strong>and</strong> ball mill
Profile of <strong>the</strong> Cement Industry <strong>in</strong> India 89<br />
are 300-500 gm/nm 3 <strong>and</strong> 25-60 gm/nm 3 respectively. The ball mill power consumption is<br />
higher, i.e., 22-30 kWh/t of product as compared to that of <strong>the</strong> roll mill which is 12-15 kWh/t<br />
of product. Dust is collected <strong>in</strong> raw mills <strong>in</strong> which <strong>the</strong> comb<strong>in</strong>ed dry<strong>in</strong>g <strong>and</strong> gr<strong>in</strong>d<strong>in</strong>g us<strong>in</strong>g kiln<br />
gases is adopted, by <strong>the</strong> electrostatic precipitator operat<strong>in</strong>g <strong>in</strong> comb<strong>in</strong>ation with <strong>the</strong> condition<strong>in</strong>g<br />
tower. Due to <strong>the</strong> very f<strong>in</strong>e nature of dust, cyclones/multiclones are not used <strong>in</strong> this section as<br />
f<strong>in</strong>al dust collectors.<br />
• Kiln<br />
The major source of particulate pollution <strong>in</strong> any cement factory are <strong>the</strong> kiln exhaust gases. In<br />
case of wet process kilns, gas temperature is normally below 200 o C <strong>and</strong> dew po<strong>in</strong>t is often high<br />
above 70 o C. The use of dust settl<strong>in</strong>g chamber/cyclone is not feasible as it cannot meet <strong>the</strong><br />
emission st<strong>and</strong>ards prescribed by <strong>the</strong> state/central pollution control board. In case of <strong>the</strong> semidry<br />
process kilns, <strong>the</strong> gas outlet conditions are suitable for <strong>the</strong> <strong>in</strong>stallation of ESP. The<br />
temperature of <strong>the</strong> exit gas from suspension preheater dry process kiln is about 330-360 o C.<br />
• Cl<strong>in</strong>ker cooler<br />
The planetary cooler does not require dust collection s<strong>in</strong>ce <strong>the</strong> cooler air is dra<strong>in</strong>ed <strong>in</strong>to <strong>the</strong> kiln<br />
through tubes mounted on <strong>the</strong> periphery of <strong>the</strong> kiln outlet end. The temperature of <strong>the</strong> outlet<br />
gas is about 200-220 o C <strong>and</strong> <strong>the</strong> quantity of dust generation is of <strong>the</strong> order of 5-10 gm/nm 3 . Bag<br />
filters for grate coolers are also <strong>in</strong> use hav<strong>in</strong>g pulse jet polyester as a fabric material preceded by<br />
heat exchanger.<br />
• Coal mill<br />
In <strong>the</strong> coal mill, gases are de-dusted ei<strong>the</strong>r by <strong>in</strong>stall<strong>in</strong>g bag filters or ESPs. Coal be<strong>in</strong>g highly<br />
volatile <strong>in</strong> nature, causes problems like fire <strong>and</strong> explosions which may damage <strong>the</strong> air pollution<br />
control equipment. The dust concentration of <strong>the</strong> exhaust gases from <strong>the</strong> coal mill is <strong>in</strong> <strong>the</strong><br />
range of 25-60 gm/nm 3 <strong>and</strong> dust consists of very f<strong>in</strong>e particles around 71% less than 5 microns<br />
<strong>in</strong> size.<br />
• Cement mill<br />
Like raw material gr<strong>in</strong>d<strong>in</strong>g, cement gr<strong>in</strong>d<strong>in</strong>g is ano<strong>the</strong>r process which generates considerable<br />
amount of dust. It is estimated that 7-10% cement is normally lost due to uncontrolled emission<br />
<strong>in</strong> cement mill. Apart from <strong>the</strong> pollution, it is f<strong>in</strong>ancially critical to take effective steps to curb<br />
this nuisance <strong>and</strong> recover <strong>the</strong> maximum amount of generated waste as possible. Dust<br />
concentration after <strong>the</strong> cement mill is normally <strong>in</strong> <strong>the</strong> range of 60-150 gm/nm 3 <strong>and</strong> consists of<br />
very f<strong>in</strong>e particles around 50% less than 5 microns <strong>in</strong> size. The exhaust temperature of gases<br />
leav<strong>in</strong>g <strong>the</strong> cement mill is about 80-100 o C. In <strong>the</strong> case of <strong>in</strong>ternal water spray systems where<br />
ventilated air is less <strong>and</strong> gas has higher humidity, ESP is found to be more suitable. For mills<br />
with external water spray, ei<strong>the</strong>r high ratio fabric filter or ESP can be used.<br />
• Pack<strong>in</strong>g section<br />
In pack<strong>in</strong>g house dust from <strong>the</strong> various generation po<strong>in</strong>ts such as hoppers, h<strong>and</strong>l<strong>in</strong>g po<strong>in</strong>ts etc.,<br />
is extracted through proper hoods <strong>and</strong> sent to a common dust collection unit. Dust
90 Technology, Energy Efficiency <strong>and</strong> Environmental Externalities of <strong>the</strong> Cement Industry<br />
concentration <strong>in</strong> <strong>the</strong> exit air from <strong>the</strong> pack<strong>in</strong>g section is normally <strong>in</strong> <strong>the</strong> range of 20-30 gm/nm 3<br />
<strong>and</strong> particle size is around 65% less than 5 microns <strong>in</strong> size. Fabric filter is generally preferred as<br />
a dust collector because its <strong>efficiency</strong> is very high even for very small particles.<br />
Operational problems<br />
The ma<strong>in</strong> operational problems <strong>in</strong> <strong>the</strong> use of fabric filters are:<br />
- Variation <strong>in</strong> filtration velocity<br />
- Gas temperature below <strong>the</strong> dew po<strong>in</strong>t of gas caus<strong>in</strong>g clogg<strong>in</strong>g of bags<br />
- Variation <strong>in</strong> pressure drop<br />
- Improper gas flow distribution <strong>in</strong> various compartments<br />
- Clean<strong>in</strong>g system <strong>and</strong> its operations<br />
- Flow control systems <strong>in</strong>let duct<strong>in</strong>g, fans, <strong>in</strong>strumentation, etc.<br />
- Fire <strong>and</strong> explosion hazard<br />
The recommended dust collectors for different sections <strong>in</strong> <strong>the</strong> cement plant are given <strong>in</strong> Table<br />
6.2.20. The estimated value of dust collected per annum for a typical 3000 TPD cement plant is<br />
also summarized.<br />
Dust emissions <strong>and</strong> compliance with emission regulations<br />
A number of factors are responsible for <strong>the</strong> high dust generation <strong>in</strong> <strong>the</strong> cement <strong>in</strong>dustry. These<br />
factors classified as external constra<strong>in</strong>ts <strong>in</strong>clude poor quality of coal, power, non-availability of<br />
spare parts, etc., <strong>and</strong> have to be tackled at <strong>the</strong> national level. The <strong>in</strong>ternal constra<strong>in</strong>ts are<br />
essentially those associated with <strong>the</strong> improper selection of operation <strong>and</strong> ma<strong>in</strong>tenance of <strong>the</strong><br />
dust control equipment <strong>in</strong>stalled, problems <strong>in</strong> <strong>in</strong>stall<strong>in</strong>g new dust collectors due to layout<br />
constra<strong>in</strong>ts, non-availability of tra<strong>in</strong>ed manpower, etc. These constra<strong>in</strong>ts, however, could be<br />
rectified by <strong>the</strong> plant management.<br />
Table 6.2.20. Dust collection for different sections <strong>in</strong> <strong>the</strong> cement plant<br />
Section Dust Collector Quantity of<br />
dust<br />
collected<br />
(TPA)<br />
Ave. cost of<br />
dust (Rs/t)<br />
Estimated value of<br />
collected dust per<br />
annum (million Rs)<br />
Crusher Bag filter 2739 110 3.01<br />
Raw mill Bag filter/ESP } 118305 } 230 } 272.10<br />
Kiln Bag filter/ESP } } }<br />
Cl<strong>in</strong>ker cooler ESP/Bag filter with<br />
heat exchanger<br />
31505 960 302.45<br />
Coal mill Bag filter/ESP 4396 1170 51.43<br />
Cement plant Bag filter/ESP 29971 1080 323.69<br />
Pack<strong>in</strong>g plant Bag filter 13306 1105 147.03
Profile of <strong>the</strong> Cement Industry <strong>in</strong> India 91<br />
External constra<strong>in</strong>ts<br />
There is a wide variation <strong>in</strong> <strong>the</strong> quality of coal received by <strong>the</strong> cement plants for use <strong>in</strong> <strong>the</strong><br />
production process. The ash content of <strong>the</strong> coal varies from 22-45% <strong>and</strong> <strong>the</strong> calorific value from<br />
3000-5000 kcal/kg coal. The variation <strong>in</strong> <strong>the</strong> coal used frequently leads to improper combustion<br />
<strong>and</strong> control of air flow, result<strong>in</strong>g <strong>in</strong> high concentration of CO <strong>in</strong> <strong>the</strong> exit which <strong>in</strong> turn creates<br />
<strong>the</strong> danger of an explosion <strong>in</strong> <strong>the</strong> ESP. Instances are not unknown <strong>in</strong> cement manufacture when<br />
<strong>the</strong> CO concentration goes up to as high as 0.2-0.6% <strong>in</strong> <strong>the</strong> air as a result of high dust emissions.<br />
For proper operations of <strong>the</strong> ESP equipment, <strong>the</strong>re must be a cont<strong>in</strong>uous <strong>and</strong> regular supply of<br />
power. Long duration of low voltage fluctuations <strong>and</strong> unscheduled power cuts adversely affect<br />
<strong>the</strong> <strong>efficiency</strong> of precipitators <strong>in</strong> controll<strong>in</strong>g <strong>and</strong> regulat<strong>in</strong>g emissions. These problems can be<br />
gotten rid of when plants are equipped with captive power units of sufficient capacity so as to<br />
enable ESP to perform effectively.<br />
A common problem faced by <strong>the</strong> cement plants <strong>in</strong> controll<strong>in</strong>g pollution is <strong>the</strong> non-availability of<br />
spare parts. In <strong>the</strong> case of fabric filters, non-availability of filter media is a major constra<strong>in</strong>t. In<br />
<strong>the</strong> coal mills section of <strong>the</strong> plant, <strong>the</strong>re should always be an ample stock of spare bags which is<br />
not always possible because <strong>in</strong> <strong>the</strong> case of pulse jet filters, <strong>the</strong> bags have to be imported. Also,<br />
fiber glass fabrics are not <strong>in</strong>digenously manufactured <strong>and</strong> have to be imported at a great expense.<br />
Internal constra<strong>in</strong>ts<br />
High dust emission <strong>in</strong> a cement plant is ei<strong>the</strong>r due to <strong>the</strong> absence of efficient dust collectors or<br />
due to <strong>the</strong> improper ma<strong>in</strong>tenance <strong>and</strong> operation. Most of <strong>the</strong> dust collectors have been reported<br />
to be <strong>in</strong>efficiently operated. It has been found that 63% of ESPs <strong>in</strong>stalled <strong>in</strong> <strong>the</strong> kiln section emit<br />
more than 250 mg/nm 3 which is undesirable.<br />
In <strong>the</strong> wet process of cement production, <strong>the</strong> de-dust<strong>in</strong>g of kiln gases is a serious problem<br />
because of its partially calc<strong>in</strong>ed nature. Reports of <strong>in</strong>vestigations <strong>in</strong>dicate that <strong>the</strong> chemical<br />
nature of dust generated by <strong>the</strong> wet process varies widely. There are various techniques presently<br />
available for controll<strong>in</strong>g kiln dust <strong>in</strong> <strong>the</strong> wet process of manufacture such as <strong>in</strong>sufflation, scoop<br />
method, mix<strong>in</strong>g with slurry, nodulization <strong>and</strong> feed<strong>in</strong>g <strong>in</strong> <strong>the</strong> kiln. The technique generally<br />
adopted, however, depends on <strong>the</strong> nature of dust generated, plant layout, etc.<br />
It is necessary to tra<strong>in</strong> manpower <strong>in</strong> <strong>the</strong> <strong>in</strong>dustry to ma<strong>in</strong>ta<strong>in</strong> a clean environment. Programs can<br />
be <strong>in</strong>itiated with <strong>the</strong> objective of tra<strong>in</strong><strong>in</strong>g personnel <strong>in</strong> <strong>the</strong> monitor<strong>in</strong>g of dust emission-related<br />
<strong>in</strong>strumentation <strong>and</strong> <strong>environmental</strong> improvement.<br />
The state-wise distribution of major cement factories <strong>and</strong> <strong>the</strong>ir pollution control status is given<br />
<strong>in</strong> Table 6.2.21.
92 Technology, Energy Efficiency <strong>and</strong> Environmental Externalities of <strong>the</strong> Cement Industry<br />
Table 6.2.21. Pollution control status <strong>and</strong> state-wise distribution of cement factories <strong>in</strong><br />
India<br />
State No. of Units Units Coupl<strong>in</strong>g<br />
Emission<br />
St<strong>and</strong>ards<br />
Units<br />
Closed<br />
No Action<br />
Andhra Pradesh 18 16 -<br />
Assam 1 - 1<br />
Bijar 6 1 2 2<br />
Gujarat 10 7 1<br />
Haryana 2 1 -<br />
H.P. 2 1<br />
J & K 1 1<br />
Karnataka 8 6 1<br />
Kerala 1 1<br />
M.P. 14 10<br />
Maharashtra 5 5 1<br />
Maghalaya 1 1<br />
Orissa 2 1<br />
Rajasthan 10 7 1<br />
Tamil Nadu 8 5<br />
Uttar Pradesh 4 1<br />
West Bengal 1 1<br />
It is seen that <strong>the</strong> performance of cement plants <strong>in</strong> <strong>the</strong> states of Andhra Pradesh, Karnataka,<br />
Madhya Pradesh, Gujarat, Rajasthan <strong>and</strong> Tamil Nadu has been commendable <strong>in</strong> <strong>the</strong><br />
implementation of pollution control measures. These States have also <strong>in</strong>troduced effective timebound<br />
programs for <strong>the</strong> default<strong>in</strong>g units.<br />
Technologies available <strong>and</strong> <strong>the</strong>ir cost implications<br />
It has generally been seen that <strong>the</strong> use of electro-static precipitators (ESP) on kilns have not<br />
been very successful <strong>in</strong> controll<strong>in</strong>g pollution, particularly <strong>in</strong> <strong>the</strong> dry season when <strong>the</strong>re is<br />
shortage of water. A number of alternatives are be<strong>in</strong>g considered <strong>and</strong> discussed below:<br />
- The gas condition<strong>in</strong>g tower is elim<strong>in</strong>ated from <strong>the</strong> circuit, <strong>and</strong> multi-pluck<strong>in</strong>g system<br />
is used <strong>in</strong>stead to ensure efficient operation of ESP.<br />
- The use of glass bag filters has been attempted by various cement plants like M/S<br />
Narmada Cement Works. However, <strong>the</strong> ma<strong>in</strong>tenance <strong>and</strong> upkeep of glass bag filters<br />
is costly. These are also not be<strong>in</strong>g presently manufactured <strong>in</strong> <strong>the</strong> country <strong>and</strong> have to<br />
be imported.<br />
- Cement plants set up with foreign collaboration have been experiment<strong>in</strong>g with gravel<br />
bed filters for controll<strong>in</strong>g pollution from <strong>the</strong> cl<strong>in</strong>ker cooler. However s<strong>in</strong>ce <strong>the</strong> gravel<br />
has to be imported, <strong>the</strong>y are expensive <strong>and</strong> <strong>the</strong>refore have not been proven to be<br />
popular so far.
Profile of <strong>the</strong> Cement Industry <strong>in</strong> India 93<br />
- Despite <strong>the</strong> use of ESP for dust<strong>in</strong>g kiln, high emission of CO gas have been detected<br />
<strong>in</strong> <strong>the</strong> past. ESP has not been successful due to large fluctuations <strong>in</strong> <strong>the</strong> quality of<br />
coal received. Cement plants have <strong>in</strong>stalled bed-blend<strong>in</strong>g systems to achieve a certa<strong>in</strong><br />
level of homogenization of <strong>the</strong> coal received <strong>and</strong> limit <strong>the</strong> effect of variation <strong>in</strong> ash<br />
content. The system is expensive, cost<strong>in</strong>g around Rs.100 to 150 million.<br />
- The ability of ESP's to control pollution has been severely curtailed by frequent<br />
failures <strong>in</strong> <strong>the</strong> supply of electricity as well as voltage fluctuations.<br />
6.2.5.3 Status of Research <strong>and</strong> Development<br />
Only a few manufactur<strong>in</strong>g units have established <strong>in</strong>-house research <strong>and</strong> development (R&D)<br />
facilities. In most of <strong>the</strong> units, R&D is conf<strong>in</strong>ed to test<strong>in</strong>g <strong>and</strong> quality control purposes only.<br />
Out of <strong>the</strong> 54 sample units for study, only 3 units have given details of R & D projects done by<br />
<strong>the</strong>m. The nature of projects undertaken by R&D, specifically related to <strong>energy</strong> economics are as<br />
follows :<br />
- Evaluation of various techniques for moisture reduction <strong>in</strong> wet process plants for<br />
achiev<strong>in</strong>g fuel economy<br />
- Evaluation of gr<strong>in</strong>d<strong>in</strong>g aids for improved cl<strong>in</strong>ker gr<strong>in</strong>d<strong>in</strong>g <strong>and</strong> <strong>energy</strong> sav<strong>in</strong>g<br />
- Use of m<strong>in</strong>eralizers <strong>and</strong> fixtures <strong>in</strong> manufacture of cl<strong>in</strong>ker for fuel economy<br />
- Study on us<strong>in</strong>g lignite as fuel<br />
- Optimiz<strong>in</strong>g <strong>the</strong> process parameters for kiln <strong>and</strong> mills.
94 Technology, Energy Efficiency <strong>and</strong> Environmental Externalities of <strong>the</strong> Cement Industry<br />
6.3 COUNTRY REPORT: PHILIPPINES<br />
6.3.1 Introduction<br />
The Philipp<strong>in</strong>e economy is projected to susta<strong>in</strong> its positive growth atta<strong>in</strong>ed dur<strong>in</strong>g <strong>the</strong><br />
previous years. In view of <strong>the</strong> government’s efforts to provide adequate supply of <strong>energy</strong><br />
<strong>in</strong>to <strong>the</strong> ma<strong>in</strong>stream of each <strong>and</strong> every users of <strong>energy</strong>, it is <strong>the</strong> government policy to<br />
promote <strong>energy</strong> conservation <strong>and</strong> <strong>efficiency</strong> <strong>in</strong> <strong>the</strong> commercial, transport, <strong>in</strong>dustrial, <strong>and</strong><br />
household sectors.<br />
One of <strong>the</strong> major imports that depletes foreign exchange of <strong>the</strong> country is oil. Due to <strong>the</strong><br />
projected cont<strong>in</strong>u<strong>in</strong>g <strong>in</strong>dustrial growth of <strong>the</strong> country, <strong>the</strong> country’s primary <strong>energy</strong><br />
requirement is expected to reach 248 million barrels of oil equivalent <strong>in</strong> <strong>the</strong> year 2000 which<br />
will be double <strong>the</strong> consumption <strong>in</strong> 1993.<br />
As <strong>energy</strong> saved becomes a new <strong>energy</strong> resource, <strong>the</strong> thrust towards <strong>energy</strong> self-reliance<br />
through <strong>the</strong> development <strong>and</strong> conservation of <strong>energy</strong> cont<strong>in</strong>ues to be <strong>the</strong> major component<br />
of <strong>the</strong> country’s national development efforts.<br />
The cement <strong>in</strong>dustry is one of <strong>the</strong> highest <strong>energy</strong>-<strong>in</strong>tensive <strong>in</strong>dustrial sectors. Hence, <strong>the</strong>re<br />
are various opportunities for <strong>energy</strong> sav<strong>in</strong>gs. The <strong>in</strong>dustry has been <strong>in</strong> operation for more<br />
than 30 years <strong>and</strong> has wea<strong>the</strong>red all ups <strong>and</strong> downs. Now that <strong>the</strong> economy is ga<strong>in</strong><strong>in</strong>g<br />
momentum for progress, <strong>the</strong>re is a great deal of enthusiasm among manufacturers to<br />
<strong>in</strong>crease <strong>the</strong>ir production relative to <strong>the</strong> market dem<strong>and</strong> as well as an <strong>in</strong>creas<strong>in</strong>g concern for<br />
production <strong>efficiency</strong>. This has created a grow<strong>in</strong>g awareness as to <strong>the</strong> effects of pollutants<br />
emitted by <strong>the</strong> <strong>in</strong>dustry for over three decades now.<br />
6.3.2 Technological trajectory of <strong>the</strong> Philipp<strong>in</strong>e cement <strong>in</strong>dustry<br />
6.3.2.1 Production capacity<br />
The Philipp<strong>in</strong>e cement <strong>in</strong>dustry is composed of eighteen cement plants with a total<br />
comb<strong>in</strong>ed annual output capacity of 7.4 <strong>and</strong> 9.7 million tons of cl<strong>in</strong>ker <strong>and</strong> cement,<br />
respectively (see Table 6.3.1). These manufactur<strong>in</strong>g firms are on an average 30 years old <strong>and</strong><br />
<strong>the</strong>re are 32 kilns <strong>in</strong>stalled with an average age of 24 years.<br />
Table 6.3.1. Sizes <strong>and</strong> capacity of <strong>the</strong> cement <strong>in</strong>dustry by process type<br />
Process type No. of plants Capacity <strong>in</strong> million tons (Mt)<br />
Cl<strong>in</strong>ker Cement<br />
Dry 9 3.8 4.9<br />
Semi-dry 2 0.8 0.9<br />
Wet 7 2.8 3.9<br />
Total 18 7.4 9.7<br />
Source: IRS Study Report, 1991<br />
In terms of cement capacity output, <strong>the</strong> dry process accounted for 51% of <strong>the</strong> comb<strong>in</strong>ed<br />
process output while <strong>the</strong> rema<strong>in</strong><strong>in</strong>g were shared by semi-dry (9%) <strong>and</strong> wet process (40%)<br />
S<strong>in</strong>ce 1981, PHILCEMCOR (a cement manufacturers association) has been re-rat<strong>in</strong>g <strong>the</strong><br />
<strong>in</strong>dustry’s output capacity of cl<strong>in</strong>ker production on a yearly basis. Table 6.3.2 shows <strong>the</strong><br />
utilization of <strong>the</strong> re-rated capacity which is high at 83% <strong>in</strong> 1989. The reason for re-rat<strong>in</strong>g <strong>the</strong>
Profile of <strong>the</strong> Cement Industry <strong>in</strong> India 95<br />
<strong>in</strong>dustry’s capacity is that majority of <strong>the</strong> exist<strong>in</strong>g plants are too old to operate at <strong>the</strong>ir<br />
orig<strong>in</strong>al rated capacities. Re-rat<strong>in</strong>g <strong>the</strong>m occasionally improves <strong>the</strong> current condition of <strong>the</strong><br />
equipment. No data is available for re-rated capacity <strong>in</strong> <strong>the</strong> f<strong>in</strong>ish mill section. In Table<br />
6.3.3, <strong>the</strong> production mix of <strong>the</strong> Philipp<strong>in</strong>e cement <strong>in</strong>dustry by process type is compared<br />
with that of Japan <strong>and</strong> Indonesia.<br />
Table 6.3.2. Capacity utilization for cl<strong>in</strong>ker production (Mt)<br />
Year Re-rated capacity Cl<strong>in</strong>ker production Utilization (%)<br />
(Mt)<br />
(Mt)<br />
1981 5.6 3.8 70<br />
1982 5.6 4.2 75<br />
1983 5.7 4.3 76<br />
1984 5.8 3.5 60<br />
1985 5.2 2.8 54<br />
1986 5.8 3.0 51<br />
1987 5.0 3.4 68<br />
1988 5.9 4.7 80<br />
1989 6.0 5.0 83<br />
Source: IRS Study Report, 1991<br />
Table 6.3.3. Comparison of production-mix of cement processes <strong>in</strong> <strong>the</strong> Philipp<strong>in</strong>es,<br />
Japan <strong>and</strong> Indonesia (%)<br />
Process Philipp<strong>in</strong>es Japan Indonesia<br />
Dry 50.8% 96.1% 96.7%<br />
Semi-dry 34.7% 3.9% 0.7%<br />
Wet 14.5% - 2.6%<br />
Total 100.0% 100.0% 100.0%<br />
Source: IRS Study Report, 1991<br />
On <strong>the</strong> basis of cement production, <strong>the</strong> <strong>in</strong>dustry registered an average production of 4.2<br />
million metric tons from 1975 to 1980. The production output was short-lived, however,<br />
when it dipped to about 3.5 million metric tons <strong>in</strong> 1985. However, it later <strong>in</strong>creased <strong>in</strong> <strong>the</strong><br />
late 80’s <strong>and</strong> <strong>the</strong> early 90’s. In 1991, total production was about 7 million metric tons,<br />
represent<strong>in</strong>g 74% of <strong>the</strong> total comb<strong>in</strong>ed production capacity of <strong>the</strong> <strong>in</strong>dustry. In 1993, cement<br />
production was 83% of <strong>the</strong> <strong>in</strong>dustry’s base plant capacity. Forecast <strong>in</strong>dicates that <strong>the</strong> dem<strong>and</strong><br />
will cont<strong>in</strong>ue to grow at <strong>the</strong> rate of 5.6% annually up to <strong>the</strong> year 2000, reach<strong>in</strong>g 12 million<br />
metric tons.<br />
6.3.2.2 Plant development<br />
In <strong>the</strong> early 70’s, <strong>the</strong> cement <strong>in</strong>dustry be<strong>in</strong>g a highly <strong>energy</strong> <strong>in</strong>tensive sector was faced with<br />
serious technical as well as f<strong>in</strong>ancial problems result<strong>in</strong>g primarily from escalat<strong>in</strong>g fuel costs<br />
<strong>and</strong> devaluation of currency. In view of <strong>the</strong> economic slump <strong>and</strong> excess capacity situation<br />
dur<strong>in</strong>g <strong>the</strong> first half of <strong>the</strong> 1980’s, cement companies experienced difficulty <strong>in</strong> meet<strong>in</strong>g <strong>the</strong>ir<br />
loan obligation. Thus, government-owned f<strong>in</strong>ancial <strong>in</strong>stitute bailed <strong>the</strong>m out by<br />
implement<strong>in</strong>g a f<strong>in</strong>ancial rehabilitation program which <strong>in</strong>volved <strong>the</strong> conversion of <strong>the</strong><br />
company’s loan <strong>in</strong>to equity.
96 Technology, Energy Efficiency <strong>and</strong> Environmental Externalities of <strong>the</strong> Cement Industry<br />
One of <strong>the</strong> milestones of <strong>the</strong> Philipp<strong>in</strong>e cement <strong>in</strong>dustry is <strong>the</strong> issuance of <strong>the</strong> Letter of<br />
Instruction no. 752 <strong>and</strong> 1094 <strong>in</strong> 1980, which states among o<strong>the</strong>rs <strong>the</strong> switch<strong>in</strong>g of fuel from<br />
bunker oil to coal <strong>in</strong> <strong>the</strong> exist<strong>in</strong>g plants. This was done <strong>in</strong> order to lessen <strong>the</strong> <strong>in</strong>dustry’s<br />
dependence on crude oil as <strong>energy</strong> source. To put fur<strong>the</strong>r relief to <strong>the</strong>se manufactur<strong>in</strong>g<br />
companies from o<strong>the</strong>r f<strong>in</strong>ancial obligations, <strong>the</strong> government on <strong>the</strong> same token, liberalized<br />
importation of coal. To date, all cement manufactur<strong>in</strong>g plants have converted to coal.<br />
With <strong>the</strong> <strong>in</strong>dustry’s cement dem<strong>and</strong> steadily climb<strong>in</strong>g up s<strong>in</strong>ce 1988, <strong>the</strong> government<br />
launched <strong>the</strong> Cement Industry Rehabilitation program whose aim is to provide adequate<br />
supply of cement <strong>in</strong> <strong>the</strong> local market. With <strong>the</strong> outdated processes <strong>and</strong> ag<strong>in</strong>g equipment,<br />
without a major rehabilitation effort, it is possible that <strong>the</strong> current production may fail to<br />
meet <strong>the</strong> dem<strong>and</strong> <strong>in</strong> <strong>the</strong> com<strong>in</strong>g years. Some developmental/rehabilitation projects adopted<br />
by some of <strong>the</strong> cement firm are:<br />
- <strong>in</strong>stallation of additional equipment;<br />
- conversion from direct to <strong>in</strong>direct fir<strong>in</strong>g system;<br />
- improvement of exist<strong>in</strong>g facility;<br />
- rehabilitation of small capacity kilns to achieve rated output;<br />
- conversion of semi-dry process to dry process;<br />
- <strong>in</strong>stallation of precalc<strong>in</strong>er to <strong>in</strong>crease plant capacity; <strong>and</strong><br />
- rehabilitation of cl<strong>in</strong>ker cooler to <strong>in</strong>crease kiln capacity.<br />
6.3.3 Evolution of <strong>energy</strong> <strong>efficiency</strong> <strong>in</strong> <strong>the</strong> Philipp<strong>in</strong>e cement <strong>in</strong>dustry<br />
There are three types of processes employed by <strong>the</strong> <strong>in</strong>dustry. These are <strong>the</strong> wet, dry <strong>and</strong><br />
semi-dry processes. The technologies employed <strong>in</strong> <strong>the</strong> Philipp<strong>in</strong>es are outdated, result<strong>in</strong>g <strong>in</strong><br />
high fuel <strong>and</strong> electricity consumption. For <strong>in</strong>stance, <strong>the</strong> average heat consumption of <strong>the</strong><br />
<strong>in</strong>dustry is 1200 kcal/kg cl<strong>in</strong>ker, while <strong>the</strong> average specific power (electricity) consumption is<br />
129 kWh/ton cement, much higher than that <strong>in</strong> <strong>the</strong> <strong>in</strong>dustrialized countries.<br />
The Philipp<strong>in</strong>e cement <strong>in</strong>dustry is heavily dependent on <strong>the</strong> follow<strong>in</strong>g types of <strong>energy</strong><br />
sources: coal, petcoke, bunker oil <strong>and</strong> electricity. For <strong>the</strong>rmal usage, Table 6.3.4 shows that<br />
shares of local coal was 52% <strong>and</strong> <strong>the</strong> rema<strong>in</strong><strong>in</strong>g amount came from imported coal (22%),<br />
petcoke (7%), fuel oil(18%) <strong>and</strong> o<strong>the</strong>rs (1%).<br />
Table 6.3.4. Share of fuel consumption (%)<br />
Year Local coal Imported<br />
coal<br />
Petcoke Fuel oil O<strong>the</strong>rs<br />
1991 59.0 27.0 4.0 9.0 1.0<br />
1992 50.7 17.3 8.8 22.5 0.7<br />
1993 47.0 21.0 9.0 23.0 0.3<br />
1994 52.0 22.0 7.0 18.0 1.0<br />
Source: IRS Study Report, 1991<br />
Energy audits conducted by <strong>the</strong> Office of Energy Affairs for <strong>the</strong> “Sectors Study report for<br />
<strong>the</strong> Cement Industry” <strong>in</strong> 1989 reported that <strong>in</strong> <strong>the</strong> wet process, <strong>energy</strong> <strong>in</strong>put is relatively<br />
much higher at 85% compared to <strong>the</strong> dry process which is only 75%. This is underst<strong>and</strong>able<br />
ow<strong>in</strong>g to <strong>the</strong> fact that <strong>in</strong> <strong>the</strong> wet process, water <strong>in</strong> <strong>the</strong> slurry accounts for 40% more of <strong>the</strong><br />
<strong>in</strong>put <strong>energy</strong> (see Table 6.3.5).
Profile of <strong>the</strong> Cement Industry <strong>in</strong> India 97<br />
Table 6.3.5. Energy usage <strong>in</strong> <strong>the</strong> cement <strong>in</strong>dustry<br />
Total Energy Input (%)<br />
Dry Wet<br />
Mechanical Power Drive 24 12.1<br />
Process Heat<strong>in</strong>g 74.5 85.4<br />
Transport/Out-of Plant 0.5 1.2<br />
Equipment<br />
Light<strong>in</strong>g/Air Condition<strong>in</strong>g 1 1.3<br />
Total 100 100<br />
Source: Sectoral Study for <strong>the</strong> Cement Industry, 1989.<br />
Table 6.3.6 shows that <strong>the</strong> wet process specific <strong>energy</strong> consumption is very high, rang<strong>in</strong>g<br />
from 141.03 to 188.05 kgoe/ton cement compared to <strong>the</strong> acceptable <strong>in</strong>ternational st<strong>and</strong>ard<br />
range which is 94.88 to 102.57 kgoe/ton cement. However, <strong>in</strong> <strong>the</strong> dry process <strong>the</strong> specific<br />
<strong>energy</strong> consumption shows sign of potential for improvement. It atta<strong>in</strong>ed <strong>the</strong> highest<br />
specific <strong>energy</strong> consumption at 122.23 kgoe/ton-cement down to 103.43 kgoe/ton-cement<br />
while <strong>the</strong> acceptable level was from 68.38-105.13 kgoe/ton-cement.<br />
Table 6.3.6. Average specific <strong>energy</strong> use by process type <strong>in</strong> <strong>the</strong> Philipp<strong>in</strong>es<br />
Process 1991 1992 1993 1994<br />
Dry 112.83 122.23 103.43 68.38 - 105.13<br />
Semi-dry 150.44 159.84 141.03 -<br />
Wet 141.03 197.45 188.05 94.88 - 102.57<br />
Average 135.05 159.84 144.45<br />
From <strong>the</strong> study conducted <strong>in</strong> 1991 to 1993, <strong>the</strong> specific electrical power consumption of <strong>the</strong><br />
<strong>in</strong>dustry averages 130 kWh/ton cement. In comparison with its Asian neighbors, <strong>the</strong><br />
Philipp<strong>in</strong>e cement <strong>in</strong>dustry was lagg<strong>in</strong>g beh<strong>in</strong>d <strong>in</strong> <strong>efficiency</strong> improvement (see Table 6.3.7).<br />
This <strong>in</strong>dicates that <strong>the</strong> cement sector is operat<strong>in</strong>g quite <strong>in</strong>efficiently.<br />
Table 6.3.7. Specific electrical <strong>energy</strong> consumption of <strong>the</strong><br />
Philipp<strong>in</strong>es <strong>in</strong> comparison with o<strong>the</strong>r Asian countries, 1993<br />
Thail<strong>and</strong><br />
Japan<br />
Korea<br />
Taiwan<br />
Indonesia<br />
Malaysia<br />
Philipp<strong>in</strong>es<br />
Source: PHILCEMCOR,1994<br />
SPC, kWh/ton cement<br />
85<br />
96<br />
107<br />
108<br />
114<br />
114<br />
130<br />
For <strong>the</strong> same period, <strong>the</strong> specific power consumption (SPC) by process type <strong>in</strong>dicates that<br />
<strong>the</strong> semi-dry process has an SPC of 157 kWh/ton cement, followed by <strong>the</strong> dry process at<br />
142 kWh/ton cement <strong>and</strong> <strong>the</strong> wet process at 105 kWh/ton cement (see Table 6.3.8).
98 Technology, Energy Efficiency <strong>and</strong> Environmental Externalities of <strong>the</strong> Cement Industry<br />
Table 6.3.8. Specific power use by process, <strong>in</strong> kWh/ton cement (1991-1993)<br />
Crush<strong>in</strong>g<br />
Raw mill<strong>in</strong>g<br />
Burn<strong>in</strong>g<br />
F<strong>in</strong>ish mill<strong>in</strong>g<br />
Pack<strong>in</strong>g<br />
Services<br />
Industry<br />
Wet Dry Semi-dry<br />
2.4<br />
24.4<br />
34.2<br />
44.5<br />
1.8<br />
5.4<br />
105.2<br />
Source: PHILCEMCOR, 1994.<br />
2.5<br />
32.6<br />
38.7<br />
47.7<br />
2.8<br />
5<br />
142<br />
1.8<br />
34.4<br />
38.4<br />
45.7<br />
2.3<br />
5.6<br />
156.8<br />
Kiln is one of <strong>the</strong> major <strong>energy</strong>-<strong>in</strong>tensive users of <strong>energy</strong>. The <strong>in</strong>dustry’s Kiln Specific<br />
Energy Consumption (KSEC) averaged 103.62 kgoe/ton cl<strong>in</strong>ker.<br />
6.3.4 Environmental <strong>externalities</strong> of <strong>the</strong> cement <strong>in</strong>dustry <strong>in</strong> <strong>the</strong> Philipp<strong>in</strong>es<br />
6.3.4.1 Environmental st<strong>and</strong>ards for pollution control <strong>and</strong> abatement<br />
The rules <strong>and</strong> regulations for <strong>environmental</strong> protection <strong>in</strong> <strong>the</strong> Philipp<strong>in</strong>es were published <strong>in</strong><br />
1978 by <strong>the</strong> National Pollution Commission. The said rules <strong>and</strong> regulations cover air quality<br />
control, water quality control, noise level control <strong>and</strong> procedures for application.<br />
In <strong>the</strong> regulation, <strong>the</strong> degree of pollution is classified <strong>in</strong>to three categories based on <strong>the</strong><br />
degree of severity: <strong>the</strong> highly pollutive zone, <strong>the</strong> pollutive zone <strong>and</strong> <strong>the</strong> non-pollutive zone.<br />
Air pollution is classified on <strong>the</strong> basis of value for air likely to cause <strong>the</strong> surround<strong>in</strong>g air<br />
around a plant (500 meter radius) to conta<strong>in</strong> <strong>the</strong> amount of substances specified <strong>in</strong> <strong>the</strong><br />
pollution control st<strong>and</strong>ards. Water pollution on <strong>the</strong> o<strong>the</strong>r h<strong>and</strong>, is classified on <strong>the</strong> basis of<br />
value likely to conta<strong>in</strong> <strong>the</strong> pollutive parameters of effluents specified <strong>in</strong> <strong>the</strong> control st<strong>and</strong>ard.<br />
For comparison with o<strong>the</strong>r Asian countries, typical figures applicable to <strong>the</strong> same <strong>in</strong>dustry of<br />
Japan <strong>and</strong> Taiwan are as follows:<br />
a. Air quality<br />
Particulate:<br />
Philipp<strong>in</strong>es - 500 mg/scm for exist<strong>in</strong>g sources<br />
- 300 mg/scm for new sources<br />
Taiwan - 217 mg/scm for sources with exhaust gas volume of 500 scm/m<strong>in</strong><br />
- 217 mg/scm for sources with exhaust gas volume of 300 scm/m<strong>in</strong><br />
Japan - 100 mg/scm for sources of cement kiln<br />
SOx:<br />
Philipp<strong>in</strong>es - 1587 ppm<br />
Taiwan - 500 ppm<br />
Japan - based on <strong>in</strong>dividual plant <strong>in</strong>stallation <strong>and</strong> exhaust gas volume<br />
NOx:<br />
Philipp<strong>in</strong>es - 1587 ppm<br />
Taiwan - 500 ppm for solid fuel sources
Profile of <strong>the</strong> Cement Industry <strong>in</strong> India 99<br />
Japan - 350 ppm for sources with exhaust gas volume < 100,000 scm/m<strong>in</strong><br />
The air quality st<strong>and</strong>ard <strong>in</strong> <strong>the</strong> Philipp<strong>in</strong>es is considered to be mild compared to o<strong>the</strong>r<br />
countries. However, <strong>in</strong> consideration of <strong>the</strong> accumulated amount of pollutants by which <strong>the</strong><br />
environment may be much affected <strong>in</strong> <strong>the</strong> near future, <strong>the</strong> present air quality st<strong>and</strong>ards<br />
should be changed to some extent.<br />
b. Water quality<br />
The present water quality st<strong>and</strong>ards <strong>in</strong>clude a lot of quality parameters to be monitored.<br />
However, only a few quality parameters which are considered to be applicable to <strong>the</strong> cement<br />
<strong>in</strong>dustry are shown below.<br />
pH:<br />
Philipp<strong>in</strong>es - 6.0 - 8.5 for class “D” water<br />
Taiwan - 5.0 - 9.0<br />
Japan - 6.0 - 8.5 for class “D” water<br />
Temperature:<br />
Philipp<strong>in</strong>es - 40 O C<br />
Taiwan - Max. rise shall not exceed 4 O C<br />
Japan - No provision<br />
c. Suspended solids<br />
Philipp<strong>in</strong>es - 75 mg/1 (75 ppm) for class “D” water<br />
Taiwan - 300 ppm<br />
Japan - 100 ppm for class “D” water<br />
Almost all wastes from a cement plant is usually discharged from a water cool<strong>in</strong>g pond. The<br />
wastewater, <strong>the</strong>refore, is discharged substantially from <strong>the</strong> cement plant with no special<br />
pollutants, except for a few suspended solids.<br />
6.3.4.2 Pollution control equipment<br />
Table 6.3.9 shows <strong>the</strong> type of dust collectors <strong>in</strong>stalled by <strong>the</strong> cement <strong>in</strong>dustry. Some 24<br />
percent of <strong>the</strong> total number of production sections <strong>in</strong> <strong>the</strong> <strong>in</strong>dustry have no dust collector<br />
equipment. A few dust collectors are <strong>in</strong>stalled <strong>in</strong> <strong>the</strong> crusher <strong>and</strong> raw material drier sections.<br />
Most cement plant operators believe that <strong>the</strong>se sections do not emit much dust. Actually, a<br />
lot of f<strong>in</strong>e particles is produced <strong>in</strong> <strong>the</strong>se sections <strong>and</strong> some are discharged <strong>in</strong>to <strong>the</strong><br />
atmosphere. Therefore dust collectors with high <strong>efficiency</strong> should be immediately <strong>in</strong>stalled<br />
especially <strong>in</strong> <strong>the</strong> drier section.
100 Technology, Energy Efficiency <strong>and</strong> Environmental Externalities of <strong>the</strong> Cement Industry<br />
Table 6.3.9. Distribution of dust collectors <strong>in</strong>stalled <strong>in</strong> <strong>the</strong> Philipp<strong>in</strong>e cement<br />
<strong>in</strong>dustry (# of cement plants)<br />
Application Electro-static Bag filter Multi-<br />
Area section precipitator cylone<br />
Crusher<br />
1<br />
4 0<br />
Drier<br />
4<br />
2 0<br />
Raw Mill<br />
6<br />
5 0<br />
Kiln<br />
10<br />
2 1<br />
Cooler<br />
0<br />
0 15<br />
Cement Mill 2<br />
4 0<br />
Pack<strong>in</strong>g<br />
0<br />
17 0<br />
House<br />
Percent (%)<br />
19.3<br />
37 14.3<br />
Source: IRS study for <strong>the</strong> cement sector, 1991.<br />
S<strong>in</strong>gle<br />
cylone<br />
2<br />
10<br />
0<br />
3<br />
1<br />
1<br />
0<br />
5<br />
Number of<br />
<strong>in</strong>stallations<br />
10<br />
-<br />
6<br />
1<br />
1<br />
-<br />
-<br />
24.4<br />
6.3.5 Potential for <strong>energy</strong> <strong>efficiency</strong> improvement <strong>and</strong> pollution abatement through<br />
technological change<br />
The list of <strong>energy</strong> <strong>efficiency</strong> projects undertaken by <strong>the</strong> cement <strong>in</strong>dustry shows a vary<strong>in</strong>g<br />
degree of application <strong>in</strong> stages. These <strong>in</strong>clude ma<strong>in</strong>tenance program to mid-range capital<br />
<strong>in</strong>vestment such as combustion control <strong>and</strong> waste heat recovery system. Likewise, <strong>the</strong> longrange<br />
program of coal conversion for cement plants which started <strong>in</strong> 1980 is completed.<br />
From <strong>the</strong> study report on cement <strong>in</strong>dustry by <strong>the</strong> Office of Energy Affairs <strong>in</strong> 1989, <strong>the</strong>re is<br />
considerable scope for application of various <strong>energy</strong> <strong>efficiency</strong> technologies identified <strong>and</strong><br />
this is discussed below with <strong>the</strong> correspond<strong>in</strong>g estimated <strong>energy</strong> sav<strong>in</strong>gs.<br />
Combustion Control<br />
For kiln process operation, combustion control systems are <strong>in</strong>dispensable for <strong>energy</strong><br />
efficient operations. From <strong>the</strong> survey conducted, flue gas analysis was prevalently used.<br />
In some of <strong>the</strong> plants audited, combustion control system are likewise utilized. However, <strong>the</strong><br />
need for improvement <strong>in</strong> terms of additional controls <strong>and</strong> <strong>in</strong>strumentation has been<br />
identified. The potential sav<strong>in</strong>gs from <strong>the</strong> <strong>technology</strong> was estimated to reach 5113 kgoe<br />
annually. This represents 0.2% of <strong>the</strong> <strong>in</strong>dustry’s total consumption for 1988.<br />
Cogeneration System<br />
Cogeneration is <strong>the</strong> simultaneous production of electricity <strong>and</strong> <strong>the</strong>rmal <strong>energy</strong> from a s<strong>in</strong>gle<br />
<strong>energy</strong> source. In <strong>the</strong> case of dry process plants, <strong>the</strong> higher temperature levels permit<br />
<strong>in</strong>stallation of <strong>the</strong> waste heat recovery boilers <strong>and</strong> turbo generators for <strong>in</strong>-plant generation.<br />
The estimated potential sav<strong>in</strong>g for this type of <strong>technology</strong> is 20968 kgoe annually,<br />
represent<strong>in</strong>g 0.8% of <strong>the</strong> <strong>in</strong>dustry’s 1988 level of <strong>energy</strong> consumption.<br />
Process Conversion<br />
In <strong>the</strong> case of <strong>the</strong> wet process plant, conversion to <strong>the</strong> dry process is a major step <strong>in</strong><br />
reduc<strong>in</strong>g fuel consumption while <strong>in</strong>creas<strong>in</strong>g production capacity. The potential sav<strong>in</strong>g was<br />
estimated at 102,571 kgoe annually represent<strong>in</strong>g 4.2% of <strong>the</strong> <strong>in</strong>dustry’s 1988 level of<br />
consumption.<br />
Waste Heat Utilization
Profile of <strong>the</strong> Cement Industry <strong>in</strong> India 101<br />
An example of <strong>the</strong> waste heat recovery employed <strong>in</strong> <strong>the</strong> <strong>in</strong>dustry is <strong>the</strong> use of hot air from<br />
<strong>the</strong> cl<strong>in</strong>ker cooler to heat secondary air to kiln or for dry<strong>in</strong>g of raw feed materials. Proper<br />
<strong>in</strong>sulation of ducts <strong>and</strong> hot portions <strong>in</strong> <strong>the</strong> system are likewise employed. In l<strong>in</strong>e with this,<br />
most plants use high quality refractories <strong>and</strong> better quality <strong>in</strong>sulation to reduce heat losses.<br />
Waste heat recovery from kiln system, however, has not been adopted yet. The estimated<br />
sav<strong>in</strong>g for this type of <strong>the</strong> <strong>technology</strong> is 6898 kgoe annually, represent<strong>in</strong>g 0.3% of <strong>the</strong> 1988<br />
<strong>energy</strong> consumption of <strong>the</strong> <strong>in</strong>dustry.<br />
Coal <strong>and</strong> Waste Fuel Utilization<br />
All cements plants have converted to coal fir<strong>in</strong>g system s<strong>in</strong>ce <strong>the</strong> early 80’s. Although<br />
problems of <strong>the</strong> consistency of coal quality <strong>and</strong> price are encountered, coal utilization is still<br />
viewed as an acceptable <strong>energy</strong> conservation measure over o<strong>the</strong>r liquid fuels. Aside from<br />
this, o<strong>the</strong>r resources such as rubber tires, rice-hulls, <strong>and</strong> o<strong>the</strong>r combustible wastes are also<br />
be<strong>in</strong>g utilized. Of <strong>the</strong> 18 cement plants, four have utilized <strong>the</strong>se waste fuels as<br />
supplementary <strong>energy</strong> source.<br />
A new <strong>technology</strong> us<strong>in</strong>g Suspension preheater with Precalc<strong>in</strong>er (SPP) <strong>and</strong> vertical roller mill<br />
is popular <strong>in</strong> <strong>the</strong> cement <strong>in</strong>dustry of many countries. This <strong>technology</strong> can reduce <strong>the</strong> present<br />
heat <strong>and</strong> electricity consumption of <strong>the</strong> <strong>in</strong>dustry by as much as 50%<br />
6.3.6 Status of Application of New Technologies<br />
As of June 1990, <strong>the</strong>re were thirteen cement firms adopt<strong>in</strong>g various rehabilitation <strong>and</strong>/or<br />
improvement projects. The production output <strong>in</strong> 1990 <strong>in</strong>creased by 50% <strong>in</strong> reference to <strong>the</strong><br />
1988 output after improvement/rehabilitation projects were completed. These projects are:<br />
- Installation of kiln with a capacity of 2000 tons per day.<br />
- Conversion of direct fired system to <strong>in</strong>direct fired systems<br />
- Improvement/upgrad<strong>in</strong>g of exist<strong>in</strong>g facility to <strong>in</strong>crease capacity from 1000 tons to<br />
1750 ton/day/unit<br />
- Total rehabilitation to achieve rated capacities of small kilns.<br />
- Installation of Precalc<strong>in</strong>er to <strong>in</strong>crease plant capacity to 2,700 tons/day.<br />
- Rehabilitation of cl<strong>in</strong>ker cooler to <strong>in</strong>crease kiln output capacity to 1600 tons/day.<br />
6.3.7 Conclud<strong>in</strong>g Remarks<br />
There is a tremendous opportunity for improv<strong>in</strong>g <strong>the</strong> <strong>efficiency</strong> of <strong>energy</strong> utilization <strong>in</strong> <strong>the</strong><br />
cement <strong>in</strong>dustry not only because of its big share <strong>in</strong> <strong>the</strong> <strong>energy</strong> consumption but also<br />
because <strong>the</strong> sector consists of relatively manageable number <strong>and</strong> sizes of <strong>energy</strong>-consum<strong>in</strong>g<br />
equipment facilities compared to <strong>the</strong> o<strong>the</strong>r sectors. Technologies to improve <strong>the</strong> efficiencies<br />
at <strong>the</strong> end-user level have been identified, <strong>and</strong> to some extent, are already be<strong>in</strong>g appreciated<br />
by <strong>the</strong> <strong>in</strong>dustry. Reliev<strong>in</strong>g <strong>the</strong> <strong>in</strong>creas<strong>in</strong>g burden of <strong>energy</strong> cost by achiev<strong>in</strong>g greater <strong>energy</strong><br />
<strong>efficiency</strong> will undoubtedly contribute significantly to lower production cost <strong>and</strong> enhanced<br />
competitiveness of <strong>the</strong> <strong>in</strong>dustry.
102 Technology, Energy Efficiency <strong>and</strong> Environmental Externalities of <strong>the</strong> Cement Industry<br />
BIBLIOGRAPHY<br />
Sections 1-4<br />
Asian Productivity Organization, 1982. “Energy Conservation <strong>in</strong> <strong>the</strong> Cement Industry-Some<br />
Experiences”, Tokyo.<br />
Bhattacharya, D., 1991. “Assessment of Energy Consumption Pattern Through Energy Analysis<br />
of Cement Industry”, Energy Management, January-March, pp. 5-9.<br />
Bonn, W., <strong>and</strong> Lang, Th., 1987. “Burn<strong>in</strong>g process (Kiln systems; material cycles; refractory<br />
l<strong>in</strong><strong>in</strong>g; coat<strong>in</strong>g problems)”, Process <strong>technology</strong> of cement manufactur<strong>in</strong>g, Proceed<strong>in</strong>gs of VDZkongress<br />
‘85, Bauverlag GmbH, Berl<strong>in</strong> pp. 368 - 384.<br />
Braig, H., 1987. “Measures for reduc<strong>in</strong>g <strong>the</strong> noise emission from a cement plant”, Process<br />
<strong>technology</strong> of cement manufactur<strong>in</strong>g, Proceed<strong>in</strong>gs of VDZ-kongress ‘85, Bauverlag GmbH,<br />
Berl<strong>in</strong> pp. 625 - 628.<br />
Bush, C.W., 1979. “The Decision for Cogeneration at Riverside Cement”, ICS Proceed<strong>in</strong>gs.<br />
Canadian Portl<strong>and</strong> Cement Association, 1989. “Resources recovery: <strong>the</strong> cement kiln solution”.<br />
Dodson, V.H., 1990. “Concrete admixtures”, Structural eng<strong>in</strong>eer<strong>in</strong>g series, Van Nostr<strong>and</strong><br />
Re<strong>in</strong>hold, New York.<br />
Fassbender, A. G., Mcgee, M. M. <strong>and</strong> Yanase, Y., 1983. “Energy Efficient Industrial<br />
Technology <strong>in</strong> Europe <strong>and</strong> Japan”, Noyes Data Corporation, Park Ridge, New Jersey, U.S.<br />
Fog, M.H. <strong>and</strong> Nadkarni, K.L., 1983. “Energy Efficiency <strong>and</strong> Fuel Substitution <strong>in</strong> <strong>the</strong> Cement<br />
Industry with Emphasis on Develop<strong>in</strong>g Countries”, World Bank Technical Paper.<br />
George, R.G., 1981. “Design<strong>in</strong>g a Pyroprocess<strong>in</strong>g System for Cement”, ICS Proceed<strong>in</strong>gs.<br />
Gillil<strong>and</strong>, J., 1973. “Air pollution control <strong>in</strong> Portl<strong>and</strong> cement <strong>in</strong>dustry”, Industrial air pollution<br />
control, edited by Kenneth Noll <strong>and</strong> Joseph Duncan, Ann Arbor Science Publishers <strong>in</strong>c.,<br />
Michigan, USA pp. 195 -202.<br />
Gordon, M., 1986. “Cost Effective Energy Reduction <strong>in</strong> <strong>the</strong> Cement Sector”, Energy<br />
Management Focus, Issue No. 7, p. 26-28.<br />
Jhansen, V., Egeløv, A.H., <strong>and</strong> Eiriksson, A.O., 1987. “Emission of Nox <strong>and</strong> SO2 from cement<br />
cl<strong>in</strong>ker burn<strong>in</strong>g”, Process <strong>technology</strong> of cement manufactur<strong>in</strong>g, Proceed<strong>in</strong>gs of VDZ-kongress<br />
‘85, Bauverlag GmbH, Berl<strong>in</strong> pp. 634 - 637.<br />
Katsuki, M.H. <strong>and</strong> Yano, M., 1985. “Automatic Kiln Control with <strong>the</strong> Aid of a Process<br />
Computer”, Process Technology of Cement Manufactur<strong>in</strong>g, p. 548-552, Tokyo, Japan.<br />
Kirchner, G., 1987. “Behavior of heavy metals dur<strong>in</strong>g cement cl<strong>in</strong>ker burn<strong>in</strong>g”, Process<br />
<strong>technology</strong> of cement manufactur<strong>in</strong>g, Proceed<strong>in</strong>gs of VDZ-kongress ‘85, Bauverlag GmbH,<br />
Berl<strong>in</strong> pp. 637 - 641.<br />
Kreft, W. <strong>and</strong> Schütte, R., 1987. “Influence on nitrogen oxide emission of <strong>the</strong> operat<strong>in</strong>g<br />
parameters of <strong>the</strong> cement burn<strong>in</strong>g process”, Process <strong>technology</strong> of cement manufactur<strong>in</strong>g,<br />
Proceed<strong>in</strong>gs of VDZ-kongress ‘85, Bauverlag GMBH, Berl<strong>in</strong> pp. 645 - 649.
Profile of <strong>the</strong> Cement Industry <strong>in</strong> India 103<br />
Kroboth, K. <strong>and</strong> Xeller, H., 1987. “Developments <strong>in</strong> <strong>environmental</strong> protection <strong>in</strong> <strong>the</strong> cement”,<br />
Process <strong>technology</strong> of cement manufactur<strong>in</strong>g, Proceed<strong>in</strong>gs of VDZ-kongress ‘85, Bauverlag<br />
GMBH, Berl<strong>in</strong> pp. 600 - 621.<br />
Kuklis, A. <strong>and</strong> Mc<strong>in</strong>tyer, G.T., “Adaptation of Automation <strong>in</strong> <strong>the</strong> Cement, Salt, <strong>and</strong> Iron<br />
Industries <strong>in</strong> South-Central United State”.<br />
Labahn, O. <strong>and</strong> Kohlhaas, B., 1983. “Cement Eng<strong>in</strong>eers’ H<strong>and</strong>book”, 4th ed., Bauverlag<br />
GmbH, Wiesbaden <strong>and</strong> Berl<strong>in</strong>.<br />
Misgra, J.C., Srivastava, V.K., <strong>and</strong> Narang, K.C., 1979. “Characterization of kiln dust <strong>and</strong> exit<br />
gases from cement plants”, Process <strong>technology</strong> of cement manufactur<strong>in</strong>g, Proceed<strong>in</strong>gs of VDZkongress<br />
‘77, Bauverlag GMBH, Berl<strong>in</strong> pp. 550 -554.<br />
Nemerow, N.L., 1978. “Industrial water pollution: orig<strong>in</strong>s, characteristics <strong>and</strong> treatment”,<br />
Addison-Wesley Publish<strong>in</strong>g Company Inc., Read<strong>in</strong>g, Massachusetts, pp. 569 - 571.<br />
Overcash, M.R., 1986. “Techniques for Industrial Pollution Prevention A Compendium for<br />
Hazardous <strong>and</strong> Nonhazardous Waste M<strong>in</strong>imization”, Translated by Michelle L. DeHertogh,<br />
Lewis Publishers, Inc.<br />
Rao, C.S., 1994. “Environmental Pollution Control Eng<strong>in</strong>eer<strong>in</strong>g”, Wiley Eastern Limited New<br />
Age International Limited, New Delhi. ISBN 81-224-0301-8<br />
Rodenhäuser, F., <strong>and</strong> Herchenbah, H., 1987. “Reduction of pollutant gas emission from<br />
cement plants”, Process <strong>technology</strong> of cement manufactur<strong>in</strong>g, Proceed<strong>in</strong>gs of VDZ-kongress ‘85,<br />
Bauverlag GMBH, Berl<strong>in</strong> pp. 668 - 671.<br />
Sahni, S.K., 1989. “Energy Audit <strong>and</strong> Conservation <strong>in</strong> Cement Plants”, Energy Management,<br />
April-June.<br />
Sell, N.J., 1992. “Industrial pollution control issues <strong>and</strong> techniques”, Van Nostr<strong>and</strong> Re<strong>in</strong>hold,<br />
New York, pp. 219 - 238.<br />
Stearn, E.W., 1980. “Cement Producers Move to Alternate Fuels”, Rock Products.<br />
Stoll, U., <strong>and</strong> Am<strong>in</strong>, N., 1995. “Pulp <strong>and</strong> paper <strong>in</strong>dustry pollution control <strong>and</strong> management”,<br />
Proceed<strong>in</strong>gs of <strong>the</strong> workshop on Development of Energy Efficient <strong>and</strong> Environmentally Sound<br />
Industrial Technologies <strong>in</strong> Asia, May 29 - 31, 1995, Manila, Philipp<strong>in</strong>e.<br />
Tripathy, S.C., Roy, M.C. <strong>and</strong> Balasubramanian, R., 1992. “Energy Audit<strong>in</strong>g Kit for Cement<br />
Industries”, Energy Convers. Mgmt, Vol. 33, No. 12, pp. 1037-1078.<br />
UNEP, 1990. “Energy Conservation <strong>in</strong> Indian Cement Industry”, Industry <strong>and</strong> Environment<br />
Program, April-June, Vol. 13, No. 2, pp. 61.<br />
UNEP, 1994. “Cleaner production”, Industry <strong>and</strong> Environment, Vol 17 No 4, October -<br />
December 1994.<br />
United Nations, New York, 1990. “Environmental impacts assessment, Guidel<strong>in</strong>es for <strong>in</strong>dustrial<br />
for development”, ESCAP - Environmental <strong>and</strong> Development Series, Economic <strong>and</strong> Social<br />
Commission for Asia <strong>and</strong> Pacific, Bangkok, Thail<strong>and</strong>.
104 Technology, Energy Efficiency <strong>and</strong> Environmental Externalities of <strong>the</strong> Cement Industry<br />
USEPA, 1991. “Pollution Prevention”, United States Environmental Protection Agency.<br />
Watson, D., 1980. “Low-Grade Fuels <strong>and</strong> Their Use <strong>in</strong> Cement Manufacture”.<br />
Wahyu, H, <strong>and</strong> Abudurrachman, A.,1993. “Energy Audit<strong>in</strong>g <strong>in</strong> Large Industries- A Case Study<br />
<strong>in</strong> Cement Industry”, Technical Report, AAECP/Energy Project Phase II, RDCAP LIPI B<strong>and</strong>ung.<br />
Widianto, W., 1989. “Thermal Performance Model<strong>in</strong>g of Cement Industries (A Case Study <strong>in</strong><br />
Indonesia)”, AIT Thesis No. ET-89-16, Asian Institute of Technology, Bangkok, Thail<strong>and</strong>.<br />
World Bank, 1995. Industrial Pollution Prevention & Abatement H<strong>and</strong>book, <strong>the</strong> World Bank <strong>in</strong><br />
colloboration with United Nations Industrial Development Organization <strong>and</strong> United Nations<br />
Environment Programme, Prelim<strong>in</strong>ary Version.<br />
SECTION 5:<br />
Economic <strong>and</strong> Social Commission for Asia <strong>and</strong> <strong>the</strong> Pacific (ESCAP), 1993. “Statistical<br />
Yearbook for Asia <strong>and</strong> <strong>the</strong> Pacific”, United Nations Publication.<br />
Energy Management Centre, 1995. “Technological Trajectory, Energy Efficiency <strong>and</strong><br />
Environmental Externalities of <strong>the</strong> cement Industry <strong>in</strong> India”, M<strong>in</strong>istry of Power, India, Paper<br />
presented <strong>in</strong> <strong>the</strong> Second SAREC Regional Workshop <strong>in</strong> Manila, Philipp<strong>in</strong>es, 29 & 30 May, 1995.<br />
Habitan, A. P., 1995. “Technological Trajectory, Energy Efficiency <strong>and</strong> Environmental<br />
Externalities of <strong>the</strong> cement Industry <strong>in</strong> <strong>the</strong> Philipp<strong>in</strong>es”, Energy Efficiency Division, Department<br />
of Energy, Philipp<strong>in</strong>es, Paper presented <strong>in</strong> <strong>the</strong> Second SAREC Regional Workshop <strong>in</strong> Manila,<br />
Philipp<strong>in</strong>es, 29 & 30 May, 1995.<br />
M<strong>in</strong>istry of Irrigation, Power <strong>and</strong> Energy, 1995. “Technological Trajectory, Energy<br />
Efficiency <strong>and</strong> Environmental Externalities of <strong>the</strong> cement Industry <strong>in</strong> Sri Lanka”, Paper presented<br />
<strong>in</strong> <strong>the</strong> Second SAREC Regional Workshop <strong>in</strong> Manila, Philipp<strong>in</strong>es, 29 & 30 May, 1995.<br />
Mohanty, Brahman<strong>and</strong>. <strong>and</strong> Aung Na<strong>in</strong>g Oo, 1995. “Energy Sav<strong>in</strong>g Opportunities <strong>and</strong><br />
Potential <strong>in</strong> <strong>the</strong> cement Industry”, Asian Institute of Technology, Bangkok, Thail<strong>and</strong>.<br />
Stoll, Uwe. <strong>and</strong> K. Parameswaran, 1995. “Environmental Impact of Cement Industry <strong>and</strong><br />
Pollution Control Measures”, Asian Institute of Technology, Bangkok, Thail<strong>and</strong>.<br />
Yanjia, Wang., 1995. “Technological Trajectory, Energy Efficiency <strong>and</strong> Environmental<br />
Externalities of <strong>the</strong> cement Industry <strong>in</strong> P.R. Ch<strong>in</strong>a”, Paper presented <strong>in</strong> <strong>the</strong> Second SAREC<br />
Regional Workshop <strong>in</strong> Manila, Philipp<strong>in</strong>es, 29 & 30 May, 1995.<br />
Worrell, E., R.F.A. Cuelenaere, K. Blok <strong>and</strong> W.C. Turkenbrg , 1994. “Energy Consumption<br />
by Industrial Process <strong>in</strong> <strong>the</strong> European Union”, Energy, Vol. 19, No. 11.<br />
SECTION 6.1<br />
ADB, 1992. National Response Strategy for Globe Climate Change: PRC, ADB TR1690-PRC<br />
Cao Chen, Innovation of Wet Process Kiln Cement No. 1. 1992.<br />
Chen M<strong>in</strong>g, 1992. 150 Case Studies of Energy Conservation of Build<strong>in</strong>g Material Industry,<br />
Ch<strong>in</strong>ese Build<strong>in</strong>g Material Industry Press ISBN 7-80090-032-0/TU.5, 1992
Profile of <strong>the</strong> Cement Industry <strong>in</strong> India 105<br />
Chen Shaocai, Decrease Coal Consumption <strong>and</strong> Increase Output of Libor Kiln Cement No. 3.<br />
1993<br />
Fu Zicheng, Energy Sav<strong>in</strong>g Potential <strong>in</strong> Cement Cl<strong>in</strong>ker Calc<strong>in</strong>e Cement No. 12. 1990.<br />
Guo Zhuncai et al., 1993. Technological Advancement of Cement <strong>and</strong> Concrete, Ch<strong>in</strong>ese<br />
Build<strong>in</strong>g Material Industry Press ISBN 7-80090-071-1/TB.10, 1993.<br />
Huang Youfen, 1994. Environmental Pollution <strong>and</strong> Control of Cement Industry Cement<br />
Technology No. 2. 1994.<br />
Orlemann, J. A., Jutze, G. A., et al., 1983. Fugijiye Dust Control Technology, NOYES DATA<br />
CORPORATION, Ch<strong>in</strong>a Environment Science Press, ISBN 7-80010-490-7/X.267, 1989.<br />
National Industrial Pollutant Investigation Office, 1990. National Industrial Pollution Sources<br />
Investigation Evaluation <strong>and</strong> Research, Ch<strong>in</strong>a Environment Science Press, ISBN 7-80010-700-<br />
0/X.386, 1990.<br />
Wan Quancheng, 1988. Atmosphere Implementation of Cement Plant Waste Gas Emission<br />
Cement Technology No. 1. 1988.<br />
Y<strong>in</strong> Q<strong>in</strong>shan et al, 1993. Energy Conservation Technology of Cement Industry, Ch<strong>in</strong>ese<br />
Build<strong>in</strong>g Material Industry Press ISBN 7-80090-089-4/TB.22, 1993.<br />
Zhu Zupei, 1992. Technological Innovation of Ch<strong>in</strong>a’s Cement Industry Cement <strong>technology</strong> No.<br />
1. 1992.<br />
SECTION 6.2<br />
CMA, 1995. Basic Data for Indian Cement Industry - Publication of Cement Manufacturers<br />
Association (CMA), May 1995.<br />
Cost benefit analysis of dust control equipment <strong>in</strong> cement <strong>in</strong>dustry, CBCP Publication.<br />
Centre for Monitor<strong>in</strong>g Indian Economy, 1995. various issues, 1995.<br />
Development Council for Cement Industry, Reports of <strong>the</strong> years 1992-93 to 1996-97.<br />
Report of <strong>the</strong> expert group on utilization of fly ash <strong>in</strong> cement <strong>in</strong>dustry, CBCP Publication.<br />
BICP, 1994. Report on Energy Audit of <strong>the</strong> cement <strong>in</strong>dustry conducted by <strong>the</strong> Bureau of Industrial<br />
Costs & Prices (BICP), M<strong>in</strong>istry of Industries, Government of India, March 1994.<br />
Report on pollution control implementation <strong>in</strong> cement <strong>in</strong>dustry, CBCP Publication.<br />
Report on utilization <strong>and</strong> conservation of <strong>energy</strong>. Summary volume prepared for Inter-M<strong>in</strong>isterial<br />
Work<strong>in</strong>g Group on Energy, 1983.<br />
TEDDY H<strong>and</strong> Book, 1995.<br />
Workshop on assessment of <strong>energy</strong> use pattern <strong>in</strong> Indian Cement Industry, jo<strong>in</strong>tly organized by BICP<br />
<strong>and</strong> National Council for Cement & Build<strong>in</strong>g Materials (NCCBM).
The Asian Institute of Technology (AIT) is an autonomous <strong>in</strong>ternational academic <strong>in</strong>stitution<br />
located <strong>in</strong> Bangkok, Thail<strong>and</strong>. It’s ma<strong>in</strong> mission is <strong>the</strong> promotion of technological changes<br />
<strong>and</strong> <strong>the</strong>ir management for susta<strong>in</strong>able development <strong>in</strong> <strong>the</strong> Asia-Pacific region through highlevel<br />
education, research <strong>and</strong> outreach activities which <strong>in</strong>tegrate <strong>technology</strong>, plann<strong>in</strong>g <strong>and</strong><br />
management.<br />
AIT carried out this Asian Regional Research Programme <strong>in</strong> Energy, Environment <strong>and</strong> Climate<br />
(ARRPEEC), with <strong>the</strong> support of <strong>the</strong> Swedish International Development Cooperation Agency (Sida).<br />
One of <strong>the</strong> projects under this program concerns <strong>the</strong> Development of Energy Efficient<br />
<strong>and</strong> Environmentally Sound Industrial Technologies <strong>in</strong> Asia.<br />
The objective of this specific project is to enhance <strong>the</strong> synergy among selected develop<strong>in</strong>g<br />
countries <strong>in</strong> <strong>the</strong>ir efforts to adopt <strong>and</strong> propagate <strong>energy</strong> efficient <strong>and</strong> <strong>environmental</strong>ly sound<br />
technologies. The <strong>in</strong>dustrial sub-sectors identified for <strong>in</strong>-depth analysis are iron & steel,<br />
cement, <strong>and</strong> pulp & paper. The project <strong>in</strong>volves active participation of experts from<br />
collaborat<strong>in</strong>g <strong>in</strong>stitutes from four Asian countries, namely Ch<strong>in</strong>a, India, <strong>the</strong> Philipp<strong>in</strong>es, <strong>and</strong> Sri<br />
Lanka.<br />
The technological trajectories, <strong>energy</strong> <strong>efficiency</strong> <strong>and</strong> <strong>environmental</strong> <strong>externalities</strong> of <strong>the</strong> pulp<br />
<strong>and</strong> paper <strong>in</strong>dustry <strong>in</strong> <strong>the</strong> four Asian countries are presented <strong>in</strong> this document (Volume I).<br />
O<strong>the</strong>r related publications based on this research f<strong>in</strong>d<strong>in</strong>g <strong>in</strong>clude:<br />
Volume I Technology, Energy Efficiency <strong>and</strong> Environmental Externalities <strong>in</strong> <strong>the</strong><br />
Cement Industry<br />
Volume II Technology, Energy Efficiency <strong>and</strong> Environmental Externalities <strong>in</strong> <strong>the</strong><br />
Iron & Steel Industry<br />
Volume IV Regulatory Measures <strong>and</strong> Technological Changes <strong>in</strong> <strong>the</strong> Cement, Iron<br />
& Steel, <strong>and</strong> Pulp & Paper Industries<br />
An assessment of <strong>the</strong> implementation of <strong>energy</strong> efficient <strong>and</strong> <strong>environmental</strong>ly sound<br />
<strong>in</strong>dustrial technologies among <strong>the</strong> selected countries is presented <strong>in</strong> a separate “Cross-<br />
Country Comparison” Report.<br />
ASIAN INSTITUTE<br />
OF TEC HN OLOGY<br />
19 5 9


