2011/2012 audited annual accounts - Falkirk Council
2011/2012 audited annual accounts - Falkirk Council
2011/2012 audited annual accounts - Falkirk Council

Create successful ePaper yourself
Turn your PDF publications into a flip-book with our unique Google optimized e-Paper software.
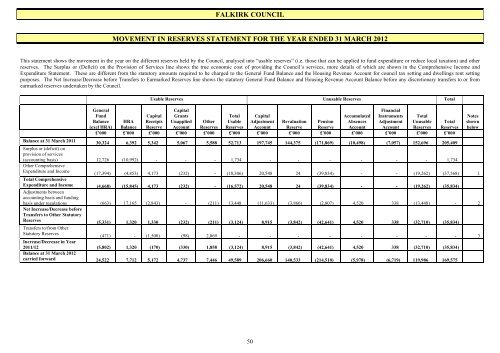
FALKIRK COUNCIL<br />
MOVEMENT IN RESERVES STATEMENT FOR THE YEAR ENDED 31 MARCH <strong>2012</strong><br />
This statement shows the movement in the year on the different reserves held by the <strong>Council</strong>, analysed into “usable reserves” (i.e. those that can be applied to fund expenditure or reduce local taxation) and other<br />
reserves. The Surplus or (Deficit) on the Provision of Services line shows the true economic cost of providing the <strong>Council</strong>’s services, more details of which are shown in the Comprehensive Income and<br />
Expenditure Statement. These are different from the statutory amounts required to be charged to the General Fund Balance and the Housing Revenue Account for council tax setting and dwellings rent setting<br />
purposes. The Net Increase/Decrease before Transfers to Earmarked Reserves line shows the statutory General Fund Balance and Housing Revenue Account Balance before any discretionary transfers to or from<br />
earmarked reserves undertaken by the <strong>Council</strong>.<br />
Usable Reserves Unusable Reserves Total<br />
General<br />
Capital<br />
Financial<br />
Fund<br />
Capital Grants<br />
Total Capital<br />
Accumulated Instruments Total<br />
Notes<br />
Balance HRA Receipts Unapplied Other Usable Adjustment Revaluation Pension Absences Adjustment Unusable Total shown<br />
(excl HRA) Balance Reserve Account Reserves Reserves Account Reserve Reserve Account Account Reserves Reserves below<br />
£’000 £’000 £’000 £’000 £’000 £’000 £’000 £’000 £’000 £’000 £’000 £’000 £’000<br />
Balance at 31 March <strong>2011</strong><br />
Surplus or (deficit) on<br />
provision of services<br />
30,324 6,392 5,342 5,067 5,588 52,713 197,745 144,375 (171,869) (10,498) (7,057) 152,696 205,409<br />
(accounting basis)<br />
Other Comprehensive<br />
12,726 (10,992) - - - 1,734 - - - - - - 1,734<br />
Expenditure and Income<br />
Total Comprehensive<br />
(17,394) (4,853) 4,173 (232) - (18,306) 20,548 24 (39,834) - - (19,262) (37,568) 1<br />
Expenditure and Income<br />
Adjustments between<br />
accounting basis and funding<br />
(4,668) (15,845) 4,173 (232) - (16,572) 20,548 24 (39,834) - - (19,262) (35,834)<br />
basis under regulations<br />
Net Increase/Decrease before<br />
Transfers to Other Statutory<br />
(663) 17,165 (2,843) - (211) 13,448 (11,633) (3,866) (2,807) 4,520 338 (13,448) - 2<br />
Reserves<br />
Transfers to/from Other<br />
(5,331) 1,320 1,330 (232) (211) (3,124) 8,915 (3,842) (42,641) 4,520 338 (32,710) (35,834)<br />
Statutory Reserves<br />
Increase/Decrease in Year<br />
(471) - (1,500) (98) 2,069 - - - - - - - - 3<br />
<strong>2011</strong>/12<br />
Balance at 31 March <strong>2012</strong><br />
(5,802) 1,320 (170) (330) 1,858 (3,124) 8,915 (3,842) (42,641) 4,520 338 (32,710) (35,834)<br />
carried forward 24,522 7,712 5,172 4,737 7,446 49,589 206,660 140,533 (214,510) (5,978) (6,719) 119,986 169,575<br />
50