A survey of freshwater fishes and their macroparasites in the ... - NINA
A survey of freshwater fishes and their macroparasites in the ... - NINA
A survey of freshwater fishes and their macroparasites in the ... - NINA

Create successful ePaper yourself
Turn your PDF publications into a flip-book with our unique Google optimized e-Paper software.
4.2 Fish communities<br />
15<br />
<strong>NINA</strong> Report 635<br />
4.2.1 Species diversity vs.altitude<br />
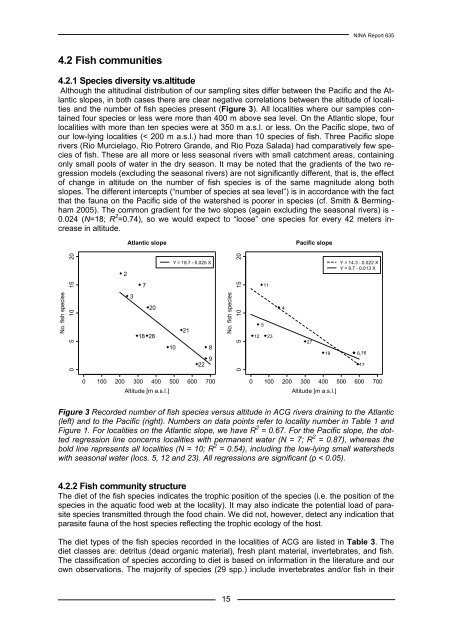
Although <strong>the</strong> altitud<strong>in</strong>al distribution <strong>of</strong> our sampl<strong>in</strong>g sites differ between <strong>the</strong> Pacific <strong>and</strong> <strong>the</strong> Atlantic<br />
slopes, <strong>in</strong> both cases <strong>the</strong>re are clear negative correlations between <strong>the</strong> altitude <strong>of</strong> localities<br />
<strong>and</strong> <strong>the</strong> number <strong>of</strong> fish species present (Figure 3). All localities where our samples conta<strong>in</strong>ed<br />
four species or less were more than 400 m above sea level. On <strong>the</strong> Atlantic slope, four<br />
localities with more than ten species were at 350 m a.s.l. or less. On <strong>the</strong> Pacific slope, two <strong>of</strong><br />
our low-ly<strong>in</strong>g localities (< 200 m a.s.l.) had more than 10 species <strong>of</strong> fish. Three Pacific slope<br />
rivers (Rio Murcielago, Rio Potrero Gr<strong>and</strong>e, <strong>and</strong> Rio Poza Salada) had comparatively few species<br />
<strong>of</strong> fish. These are all more or less seasonal rivers with small catchment areas, conta<strong>in</strong><strong>in</strong>g<br />
only small pools <strong>of</strong> water <strong>in</strong> <strong>the</strong> dry season. It may be noted that <strong>the</strong> gradients <strong>of</strong> <strong>the</strong> two regression<br />
models (exclud<strong>in</strong>g <strong>the</strong> seasonal rivers) are not significantly different, that is, <strong>the</strong> effect<br />
<strong>of</strong> change <strong>in</strong> altitude on <strong>the</strong> number <strong>of</strong> fish species is <strong>of</strong> <strong>the</strong> same magnitude along both<br />
slopes. The different <strong>in</strong>tercepts (“number <strong>of</strong> species at sea level”) is <strong>in</strong> accordance with <strong>the</strong> fact<br />
that <strong>the</strong> fauna on <strong>the</strong> Pacific side <strong>of</strong> <strong>the</strong> watershed is poorer <strong>in</strong> species (cf. Smith & Berm<strong>in</strong>gham<br />
2005). The common gradient for <strong>the</strong> two slopes (aga<strong>in</strong> exclud<strong>in</strong>g <strong>the</strong> seasonal rivers) is -<br />
0.024 (N=18; R 2 =0.74), so we would expect to “loose” one species for every 42 meters <strong>in</strong>crease<br />
<strong>in</strong> altitude.<br />
No. fish species<br />
0 5 10 15 20<br />
2<br />
Atlantic slope<br />
3<br />
7<br />
0 100 200 300 400 500 600 700<br />
20<br />
18 28<br />
Altitude [m a.s.l.]<br />
10<br />
Y = 18.7 - 0.025 X<br />
21<br />
8<br />
9<br />
22<br />
No. fish species<br />
0 5 10 15 20<br />
Pacific slope<br />
0 100 200 300 400 500 600 700<br />
Altitude [m a.s.l.]<br />
Figure 3 Recorded number <strong>of</strong> fish species versus altitude <strong>in</strong> ACG rivers dra<strong>in</strong><strong>in</strong>g to <strong>the</strong> Atlantic<br />
(left) <strong>and</strong> to <strong>the</strong> Pacific (right). Numbers on data po<strong>in</strong>ts refer to locality number <strong>in</strong> Table 1 <strong>and</strong><br />
Figure 1. For localities on <strong>the</strong> Atlantic slope, we have R 2 = 0.67. For <strong>the</strong> Pacific slope, <strong>the</strong> dotted<br />
regression l<strong>in</strong>e concerns localities with permanent water (N = 7; R 2 = 0.87), whereas <strong>the</strong><br />
bold l<strong>in</strong>e represents all localities (N = 10; R 2 = 0.54), <strong>in</strong>clud<strong>in</strong>g <strong>the</strong> low-ly<strong>in</strong>g small watersheds<br />
with seasonal water (locs. 5, 12 <strong>and</strong> 23). All regressions are significant (p < 0.05).<br />
4.2.2 Fish community structure<br />
The diet <strong>of</strong> <strong>the</strong> fish species <strong>in</strong>dicates <strong>the</strong> trophic position <strong>of</strong> <strong>the</strong> species (i.e. <strong>the</strong> position <strong>of</strong> <strong>the</strong><br />
species <strong>in</strong> <strong>the</strong> aquatic food web at <strong>the</strong> locality). It may also <strong>in</strong>dicate <strong>the</strong> potential load <strong>of</strong> parasite<br />
species transmitted through <strong>the</strong> food cha<strong>in</strong>. We did not, however, detect any <strong>in</strong>dication that<br />
parasite fauna <strong>of</strong> <strong>the</strong> host species reflect<strong>in</strong>g <strong>the</strong> trophic ecology <strong>of</strong> <strong>the</strong> host.<br />
The diet types <strong>of</strong> <strong>the</strong> fish species recorded <strong>in</strong> <strong>the</strong> localities <strong>of</strong> ACG are listed <strong>in</strong> Table 3. The<br />
diet classes are: detritus (dead organic material), fresh plant material, <strong>in</strong>vertebrates, <strong>and</strong> fish.<br />
The classification <strong>of</strong> species accord<strong>in</strong>g to diet is based on <strong>in</strong>formation <strong>in</strong> <strong>the</strong> literature <strong>and</strong> our<br />
own observations. The majority <strong>of</strong> species (29 spp.) <strong>in</strong>clude <strong>in</strong>vertebrates <strong>and</strong>/or fish <strong>in</strong> <strong><strong>the</strong>ir</strong><br />
12<br />
5<br />
11<br />
23<br />
4<br />
27<br />
Y = 14.3 - 0.022 X<br />
Y = 9.7 - 0.013 X<br />
19 6,16<br />
17