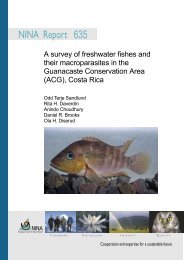
A survey of freshwater fishes and their macroparasites in the ... - NINA
A survey of freshwater fishes and their macroparasites in the ... - NINA
A survey of freshwater fishes and their macroparasites in the ... - NINA

Create successful ePaper yourself
Turn your PDF publications into a flip-book with our unique Google optimized e-Paper software.
23<br />
<strong>NINA</strong> Report 635<br />
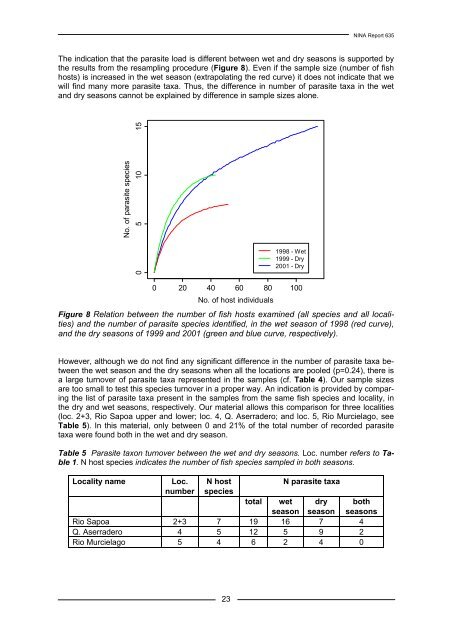
The <strong>in</strong>dication that <strong>the</strong> parasite load is different between wet <strong>and</strong> dry seasons is supported by<br />
<strong>the</strong> results from <strong>the</strong> resampl<strong>in</strong>g procedure (Figure 8). Even if <strong>the</strong> sample size (number <strong>of</strong> fish<br />
hosts) is <strong>in</strong>creased <strong>in</strong> <strong>the</strong> wet season (extrapolat<strong>in</strong>g <strong>the</strong> red curve) it does not <strong>in</strong>dicate that we<br />
will f<strong>in</strong>d many more parasite taxa. Thus, <strong>the</strong> difference <strong>in</strong> number <strong>of</strong> parasite taxa <strong>in</strong> <strong>the</strong> wet<br />
<strong>and</strong> dry seasons cannot be expla<strong>in</strong>ed by difference <strong>in</strong> sample sizes alone.<br />
No. <strong>of</strong> parasite species<br />
0 5 10 15<br />
Figure 8 Relation between <strong>the</strong> number <strong>of</strong> fish hosts exam<strong>in</strong>ed (all species <strong>and</strong> all localities)<br />
<strong>and</strong> <strong>the</strong> number <strong>of</strong> parasite species identified, <strong>in</strong> <strong>the</strong> wet season <strong>of</strong> 1998 (red curve),<br />
<strong>and</strong> <strong>the</strong> dry seasons <strong>of</strong> 1999 <strong>and</strong> 2001 (green <strong>and</strong> blue curve, respectively).<br />
However, although we do not f<strong>in</strong>d any significant difference <strong>in</strong> <strong>the</strong> number <strong>of</strong> parasite taxa between<br />
<strong>the</strong> wet season <strong>and</strong> <strong>the</strong> dry seasons when all <strong>the</strong> locations are pooled (p=0.24), <strong>the</strong>re is<br />
a large turnover <strong>of</strong> parasite taxa represented <strong>in</strong> <strong>the</strong> samples (cf. Table 4). Our sample sizes<br />
are too small to test this species turnover <strong>in</strong> a proper way. An <strong>in</strong>dication is provided by compar<strong>in</strong>g<br />
<strong>the</strong> list <strong>of</strong> parasite taxa present <strong>in</strong> <strong>the</strong> samples from <strong>the</strong> same fish species <strong>and</strong> locality, <strong>in</strong><br />
<strong>the</strong> dry <strong>and</strong> wet seasons, respectively. Our material allows this comparison for three localities<br />
(loc. 2+3, Rio Sapoa upper <strong>and</strong> lower; loc. 4, Q. Aserradero; <strong>and</strong> loc. 5, Rio Murcielago, see<br />
Table 5). In this material, only between 0 <strong>and</strong> 21% <strong>of</strong> <strong>the</strong> total number <strong>of</strong> recorded parasite<br />
taxa were found both <strong>in</strong> <strong>the</strong> wet <strong>and</strong> dry season.<br />
Table 5 Parasite taxon turnover between <strong>the</strong> wet <strong>and</strong> dry seasons. Loc. number refers to Table<br />
1. N host species <strong>in</strong>dicates <strong>the</strong> number <strong>of</strong> fish species sampled <strong>in</strong> both seasons.<br />
Locality name Loc.<br />
number<br />
0 20 40 60 80 100<br />
No. <strong>of</strong> host <strong>in</strong>dividuals<br />
N host<br />
species<br />
1998 - Wet<br />
1999 - Dry<br />
2001 - Dry<br />
N parasite taxa<br />
total wet dry both<br />
season season seasons<br />
Rio Sapoa 2+3 7 19 16 7 4<br />
Q. Aserradero 4 5 12 5 9 2<br />
Rio Murcielago 5 4 6 2 4 0