A survey of freshwater fishes and their macroparasites in the ... - NINA
A survey of freshwater fishes and their macroparasites in the ... - NINA
A survey of freshwater fishes and their macroparasites in the ... - NINA

Create successful ePaper yourself
Turn your PDF publications into a flip-book with our unique Google optimized e-Paper software.
21<br />
<strong>NINA</strong> Report 635<br />
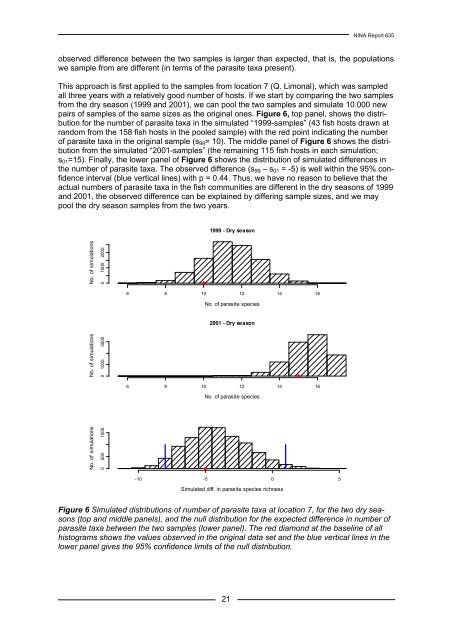
observed difference between <strong>the</strong> two samples is larger than expected, that is, <strong>the</strong> populations<br />
we sample from are different (<strong>in</strong> terms <strong>of</strong> <strong>the</strong> parasite taxa present).<br />
This approach is first applied to <strong>the</strong> samples from location 7 (Q. Limonal), which was sampled<br />
all three years with a relatively good number <strong>of</strong> hosts. If we start by compar<strong>in</strong>g <strong>the</strong> two samples<br />
from <strong>the</strong> dry season (1999 <strong>and</strong> 2001), we can pool <strong>the</strong> two samples <strong>and</strong> simulate 10.000 new<br />
pairs <strong>of</strong> samples <strong>of</strong> <strong>the</strong> same sizes as <strong>the</strong> orig<strong>in</strong>al ones. Figure 6, top panel, shows <strong>the</strong> distribution<br />
for <strong>the</strong> number <strong>of</strong> parasite taxa <strong>in</strong> <strong>the</strong> simulated “1999-samples” (43 fish hosts drawn at<br />
r<strong>and</strong>om from <strong>the</strong> 158 fish hosts <strong>in</strong> <strong>the</strong> pooled sample) with <strong>the</strong> red po<strong>in</strong>t <strong>in</strong>dicat<strong>in</strong>g <strong>the</strong> number<br />
<strong>of</strong> parasite taxa <strong>in</strong> <strong>the</strong> orig<strong>in</strong>al sample (s99= 10). The middle panel <strong>of</strong> Figure 6 shows <strong>the</strong> distribution<br />
from <strong>the</strong> simulated “2001-samples” (<strong>the</strong> rema<strong>in</strong><strong>in</strong>g 115 fish hosts <strong>in</strong> each simulation;<br />
s01=15). F<strong>in</strong>ally, <strong>the</strong> lower panel <strong>of</strong> Figure 6 shows <strong>the</strong> distribution <strong>of</strong> simulated differences <strong>in</strong><br />
<strong>the</strong> number <strong>of</strong> parasite taxa. The observed difference (s99 – s01 = -5) is well with<strong>in</strong> <strong>the</strong> 95% confidence<br />
<strong>in</strong>terval (blue vertical l<strong>in</strong>es) with p = 0.44. Thus, we have no reason to believe that <strong>the</strong><br />
actual numbers <strong>of</strong> parasite taxa <strong>in</strong> <strong>the</strong> fish communities are different <strong>in</strong> <strong>the</strong> dry seasons <strong>of</strong> 1999<br />
<strong>and</strong> 2001, <strong>the</strong> observed difference can be expla<strong>in</strong>ed by differ<strong>in</strong>g sample sizes, <strong>and</strong> we may<br />
pool <strong>the</strong> dry season samples from <strong>the</strong> two years.<br />
No. <strong>of</strong> simulations<br />
No. <strong>of</strong> simulations<br />
No. <strong>of</strong> simulations<br />
0 1000 2000<br />
0 1000 3000<br />
0 500 1500<br />
1999 - Dry season<br />
6 8 10 12 14 16<br />
No. <strong>of</strong> parasite species<br />
2001 - Dry season<br />
6 8 10 12 14 16<br />
No. <strong>of</strong> parasite species<br />
-10 -5 0 5<br />
Simulated diff. <strong>in</strong> parasite species richness<br />
Figure 6 Simulated distributions <strong>of</strong> number <strong>of</strong> parasite taxa at location 7, for <strong>the</strong> two dry seasons<br />
(top <strong>and</strong> middle panels), <strong>and</strong> <strong>the</strong> null distribution for <strong>the</strong> expected difference <strong>in</strong> number <strong>of</strong><br />
parasite taxa between <strong>the</strong> two samples (lower panel). The red diamond at <strong>the</strong> basel<strong>in</strong>e <strong>of</strong> all<br />
histograms shows <strong>the</strong> values observed <strong>in</strong> <strong>the</strong> orig<strong>in</strong>al data set <strong>and</strong> <strong>the</strong> blue vertical l<strong>in</strong>es <strong>in</strong> <strong>the</strong><br />
lower panel gives <strong>the</strong> 95% confidence limits <strong>of</strong> <strong>the</strong> null distribution.