PROPERTIES OF THE SIBOR® OXIDATION PROTECTIVE - Plansee
PROPERTIES OF THE SIBOR® OXIDATION PROTECTIVE - Plansee
PROPERTIES OF THE SIBOR® OXIDATION PROTECTIVE - Plansee

You also want an ePaper? Increase the reach of your titles
YUMPU automatically turns print PDFs into web optimized ePapers that Google loves.
72 RM 7 H.P. Martinz et al.<br />
No. (thickness) m before[g] test m after [g] test difference [mg]<br />
1 (050±30 µm) 1747,64 1746,96 -680<br />
2 (100±30 µm) 1773,01 1772,90 -110<br />
3 (150±30 µm) 1769,41 1769,60 190<br />
4 (200±30 µm) 1779,08 1777,57 -1510<br />
5 (250±30 µm) 1777,87 1774,28 -3590<br />
6 (200±30 µm) 1703,08 1703,43 350<br />
7 (200±30 µm) 1711,67 1712,04 370<br />
8 (200±30 µm) 1715,33 1715,76 430<br />
Fig.5: Table with planned coating thicknesses and mass change during ramp<br />
oxidation test<br />
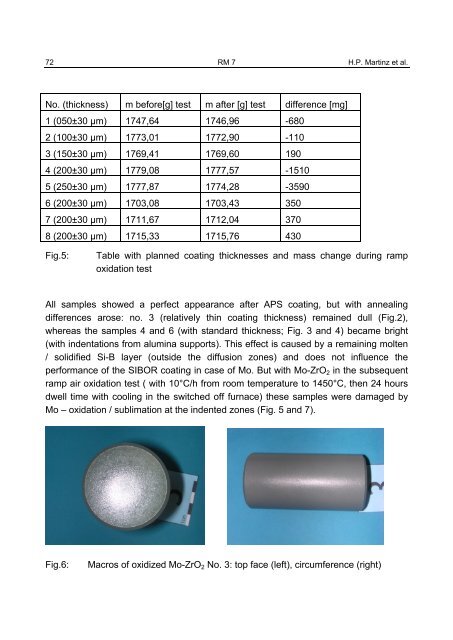
All samples showed a perfect appearance after APS coating, but with annealing<br />
differences arose: no. 3 (relatively thin coating thickness) remained dull (Fig.2),<br />
whereas the samples 4 and 6 (with standard thickness; Fig. 3 and 4) became bright<br />
(with indentations from alumina supports). This effect is caused by a remaining molten<br />
/ solidified Si-B layer (outside the diffusion zones) and does not influence the<br />
performance of the SIBOR coating in case of Mo. But with Mo-ZrO2 in the subsequent<br />
ramp air oxidation test ( with 10°C/h from room temperature to 1450°C, then 24 hours<br />
dwell time with cooling in the switched off furnace) these samples were damaged by<br />
Mo – oxidation / sublimation at the indented zones (Fig. 5 and 7).<br />
Fig.6: Macros of oxidized Mo-ZrO2 No. 3: top face (left), circumference (right)