PROPERTIES OF THE SIBOR® OXIDATION PROTECTIVE - Plansee
PROPERTIES OF THE SIBOR® OXIDATION PROTECTIVE - Plansee
PROPERTIES OF THE SIBOR® OXIDATION PROTECTIVE - Plansee

You also want an ePaper? Increase the reach of your titles
YUMPU automatically turns print PDFs into web optimized ePapers that Google loves.
H.P. Martinz et al. RM 7 75<br />
∆ m (g)<br />
0.07<br />
0.06<br />
0.05<br />
0.04<br />
0.03<br />
0.02<br />
0.01<br />
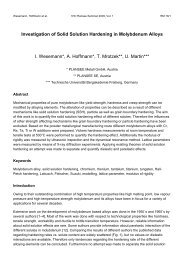
mass losses ∆ m vs.overall time<br />
M1<br />
0<br />
1 2 3 4 5 6 7<br />
S2<br />
S3<br />
E2<br />
S6<br />
time in days<br />
Fig.9: Diagram with mass losses (g) versus duration (days) of sample types M<br />
(uncoated Mo), S (SIBOR coated Mo) and E (Si-B-C coated, but not heat<br />
treated Mo samples) in white soda lime container glass<br />
Potential difference in mV<br />
600<br />
500<br />
400<br />
300<br />
200<br />
100<br />
Potential difference between Sibor and molybdenum (Sibor is more negative)<br />
0<br />
0 24 48 72 96 120 144<br />
Time in hrs<br />
Fig.10: Diagram with the potential difference (mV) between samples S6 (more<br />
negative / reactive) and M4 (more noble) versus time (hours).