PROPERTIES OF THE SIBOR® OXIDATION PROTECTIVE - Plansee
PROPERTIES OF THE SIBOR® OXIDATION PROTECTIVE - Plansee
PROPERTIES OF THE SIBOR® OXIDATION PROTECTIVE - Plansee

Create successful ePaper yourself
Turn your PDF publications into a flip-book with our unique Google optimized e-Paper software.
74 RM 7 H.P. Martinz et al.<br />
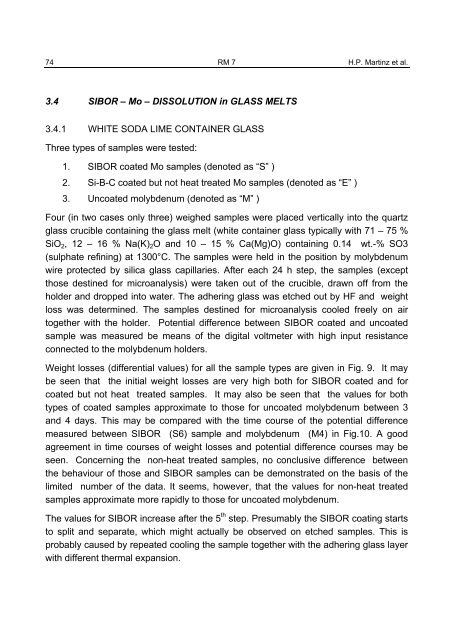
3.4 SIBOR – Mo – DISSOLUTION in GLASS MELTS<br />
3.4.1 WHITE SODA LIME CONTAINER GLASS<br />
Three types of samples were tested:<br />
1. SIBOR coated Mo samples (denoted as “S” )<br />
2. Si-B-C coated but not heat treated Mo samples (denoted as “E” )<br />
3. Uncoated molybdenum (denoted as “M” )<br />
Four (in two cases only three) weighed samples were placed vertically into the quartz<br />
glass crucible containing the glass melt (white container glass typically with 71 – 75 %<br />
SiO2, 12 – 16 % Na(K)2O and 10 – 15 % Ca(Mg)O) containing 0.14 wt.-% SO3<br />
(sulphate refining) at 1300°C. The samples were held in the position by molybdenum<br />
wire protected by silica glass capillaries. After each 24 h step, the samples (except<br />
those destined for microanalysis) were taken out of the crucible, drawn off from the<br />
holder and dropped into water. The adhering glass was etched out by HF and weight<br />
loss was determined. The samples destined for microanalysis cooled freely on air<br />
together with the holder. Potential difference between SIBOR coated and uncoated<br />
sample was measured be means of the digital voltmeter with high input resistance<br />
connected to the molybdenum holders.<br />
Weight losses (differential values) for all the sample types are given in Fig. 9. It may<br />
be seen that the initial weight losses are very high both for SIBOR coated and for<br />
coated but not heat treated samples. It may also be seen that the values for both<br />
types of coated samples approximate to those for uncoated molybdenum between 3<br />
and 4 days. This may be compared with the time course of the potential difference<br />
measured between SIBOR (S6) sample and molybdenum (M4) in Fig.10. A good<br />
agreement in time courses of weight losses and potential difference courses may be<br />
seen. Concerning the non-heat treated samples, no conclusive difference between<br />
the behaviour of those and SIBOR samples can be demonstrated on the basis of the<br />
limited number of the data. It seems, however, that the values for non-heat treated<br />
samples approximate more rapidly to those for uncoated molybdenum.<br />
The values for SIBOR increase after the 5 th step. Presumably the SIBOR coating starts<br />
to split and separate, which might actually be observed on etched samples. This is<br />
probably caused by repeated cooling the sample together with the adhering glass layer<br />
with different thermal expansion.