

Annual Report 2011 - Food Junction
Annual Report 2011 - Food Junction
Annual Report 2011 - Food Junction

You also want an ePaper? Increase the reach of your titles
YUMPU automatically turns print PDFs into web optimized ePapers that Google loves.
72<br />
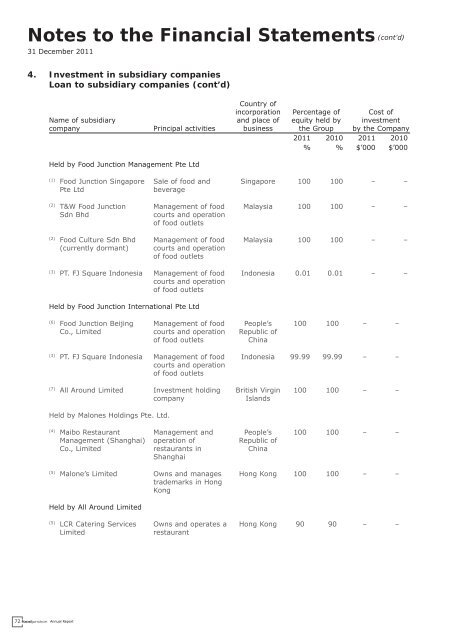
Notes to the Financial Statements (cont’d)<br />
31 December <strong>2011</strong><br />
4. Investment in subsidiary companies<br />
Loan to subsidiary companies (cont’d)<br />
Name of subsidiary<br />
company Principal activities<br />
Held by <strong>Food</strong> <strong>Junction</strong> Management Pte Ltd<br />
(1) <strong>Food</strong> <strong>Junction</strong> Singapore<br />
Pte Ltd<br />
(2) T&W <strong>Food</strong> <strong>Junction</strong><br />
Sdn Bhd<br />
(2) <strong>Food</strong> Culture Sdn Bhd<br />
(currently dormant)<br />
<strong>Annual</strong> <strong>Report</strong><br />
Sale of food and<br />
beverage<br />
Management of food<br />
courts and operation<br />
of food outlets<br />
Management of food<br />
courts and operation<br />
of food outlets<br />
(3) PT. FJ Square Indonesia Management of food<br />
courts and operation<br />
of food outlets<br />
Held by <strong>Food</strong> <strong>Junction</strong> International Pte Ltd<br />
(6) <strong>Food</strong> <strong>Junction</strong> Beijing<br />
Co., Limited<br />
Management of food<br />
courts and operation<br />
of food outlets<br />
(3) PT. FJ Square Indonesia Management of food<br />
courts and operation<br />
of food outlets<br />
(7) All Around Limited Investment holding<br />
company<br />
Held by Malones Holdings Pte. Ltd.<br />
(4) Maibo Restaurant<br />
Management (Shanghai)<br />
Co., Limited<br />
Management and<br />
operation of<br />
restaurants in<br />
Shanghai<br />
(5) Malone’s Limited Owns and manages<br />
trademarks in Hong<br />
Kong<br />
Held by All Around Limited<br />
(5) LCR Catering Services<br />
Limited<br />
Owns and operates a<br />
restaurant<br />
Country of<br />
incorporation<br />
and place of<br />
business<br />
Percentage of<br />
equity held by<br />
the Group<br />
Cost of<br />
investment<br />
by the Company<br />
<strong>2011</strong> 2010 <strong>2011</strong> 2010<br />
% % $’000 $’000<br />
Singapore 100 100 – –<br />
Malaysia 100 100 – –<br />
Malaysia 100 100 – –<br />
Indonesia 0.01 0.01 – –<br />
People’s<br />
Republic of<br />
China<br />
100 100 – –<br />
Indonesia 99.99 99.99 – –<br />
British Virgin<br />
Islands<br />
People’s<br />
Republic of<br />
China<br />
100 100 – –<br />
100 100 – –<br />
Hong Kong 100 100 – –<br />
Hong Kong 90 90 – –